A Straight and Narrow Ionized Filament
Abstract
We report the discovery of a extremely narrow, extremely linear, ionized filament. The filament is long and has an H surface brightness of 0.5 rayleighs. It is at high galactic latitude, stretching from to . The filament is approximately “Y” shaped. The vertical segment of the “Y” is long and wide, and the widest separation of the two diagonal segments is . We discuss four possible origins for this feature: (1) an extremely low density, nearby jet, (2) an unusually linear filament associated with some large-scale nearby nebula, perhaps even the Local Bubble, (3) an ionized trail left by mechanical input from a star or compact object moving through the ISM, or (4) an ionized trail left by photoionization (“Fossil Strömgren Trail”) from a star or compact object. We favor this last hypothesis, and derive some of the basic properties for an ionized trail. Regardless of whether this latter hypothesis applies to this specific filament, the basic properties of such a trail, its length, width, and brightness, are interesting, predictable, and should be observable behind some white dwarfs. If the filament is a photoionized trail, then the source should be closer than a few hundred parsecs, with a measureable proper motion and a luminosity of hydrogen ionizing photons of . We have searched for such sources in line with the filament and find one candidate, the X-ray source RXSJ094247.2+700238. If the M-dwarf binary star GL 360 is the optical counterpart of the X-ray source, as has been thought, then its proper motion eliminates it as a candidate, and we have no other potential candidate to leave a trail. We note the similarity of this structure to long narrow features (“canals”) observed as depolarizing regions against the Galactic synchrotron background and find that this emission filament may also be detectable as a region of Faraday depolarization. We suggest future tests for ascertaining the origin of this filament, and discuss how this structure might be useful to constrain the thermal and velocity structure of the nearby interstellar medium.
1 Introduction
We report the discovery of an unusual object found in the faint, diffuse, Galactic H emission: a thin, nearly linear filament stretching 2.5° long across the sky. In this paper, we present our initial discovery and follow-up observations, and explore the potential explanations for a straight and narrow filament. We favor the possibility that this filament is produced by the ionizing radiation from a high proper motion, low luminosity, hot star. However, other possibilities exist, and we propose specific observations to test this and alternate hypotheses.
Thuan (1975) developed a theory for the steady-state solution of an OB star moving through a uniform medium. Elmergreen (1976) also addressed the case of an O-type star moving at 100 km s-1 through a cloudy medium. He determined that a channel of ionized cloud debris would form around the O star and the channel would be thinnest perpendicular to the star’s direction of motion. In both cases, because Thuan and Elmergreen assumed the ionizing source was an O or B type star, the elongation of the resulting H II region was not very large. In order to leave a trail with a large ratio of length to width, the ionizing source must move a distance much larger than its Strömgren radius in a recombination time. Dupree & Raymond (1983) identified white dwarfs as just such a source and coined the term “Fossil Strömgren Trail” (hereafter, FST) to describe the ionized trail left long after the source had moved far away. Dupree & Raymond predicted that because many white dwarfs are nearby, with significant proper motions, their FST’s might be 20° long. They also noted because the cooling time for white dwarfs is similar to the gas’ recombination time, an FST could be associated with a (now) cool white dwarf, one that was recently hot enough to have ionized the FST. No such FST has been observed in H.
2 Observations
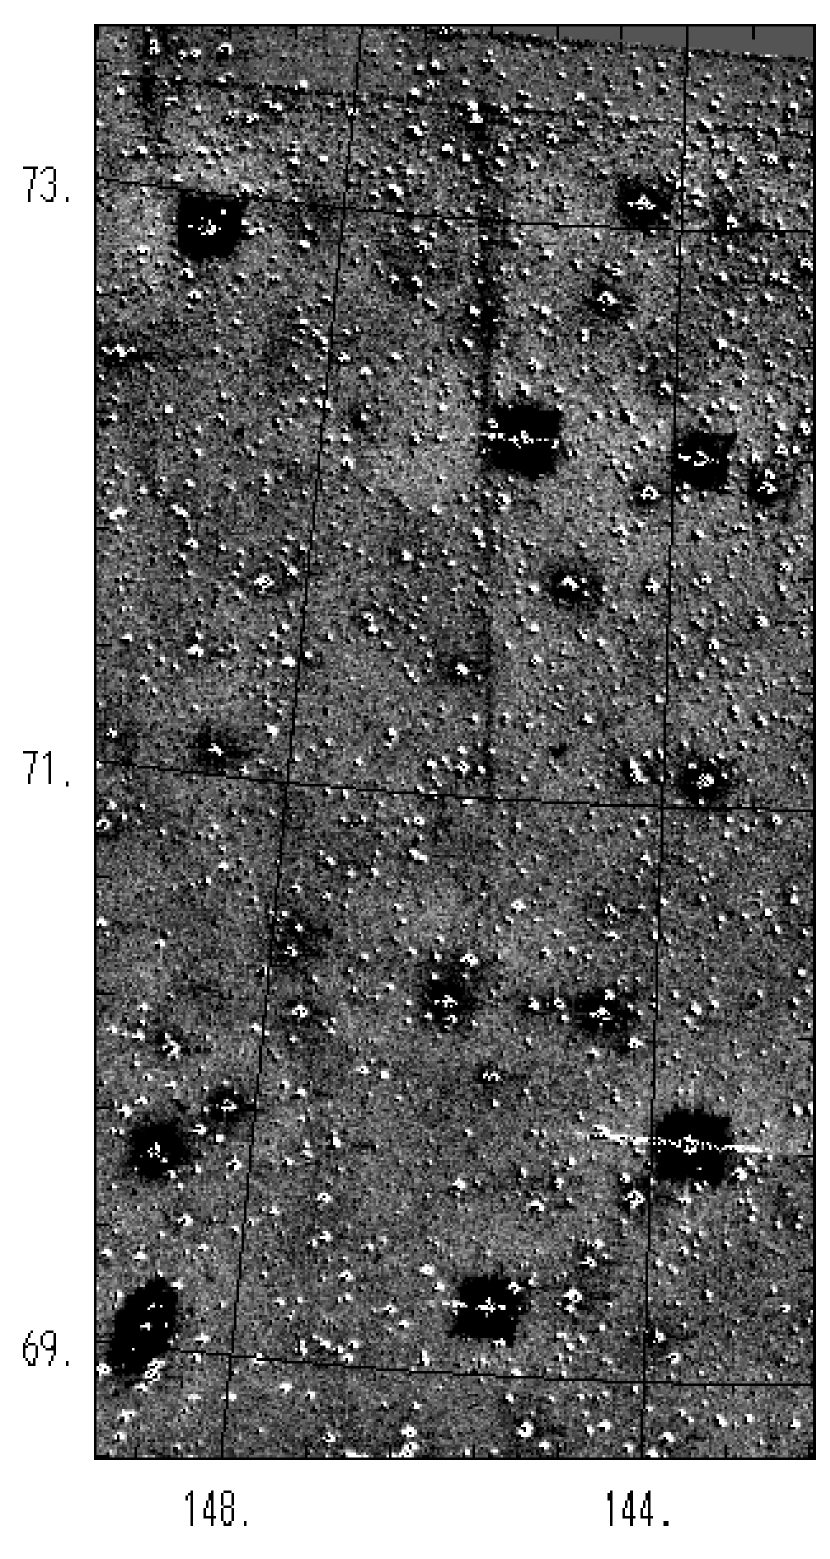
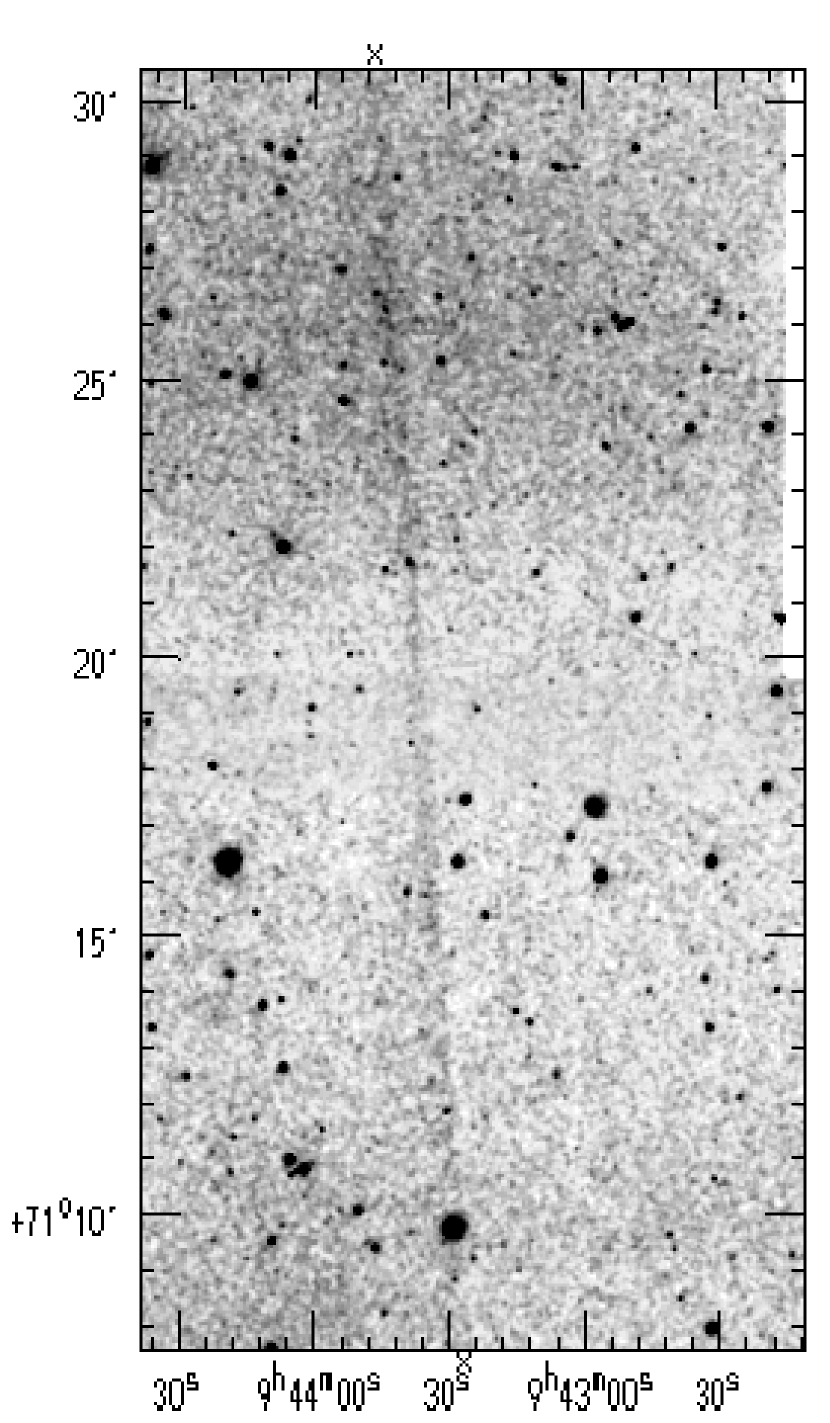
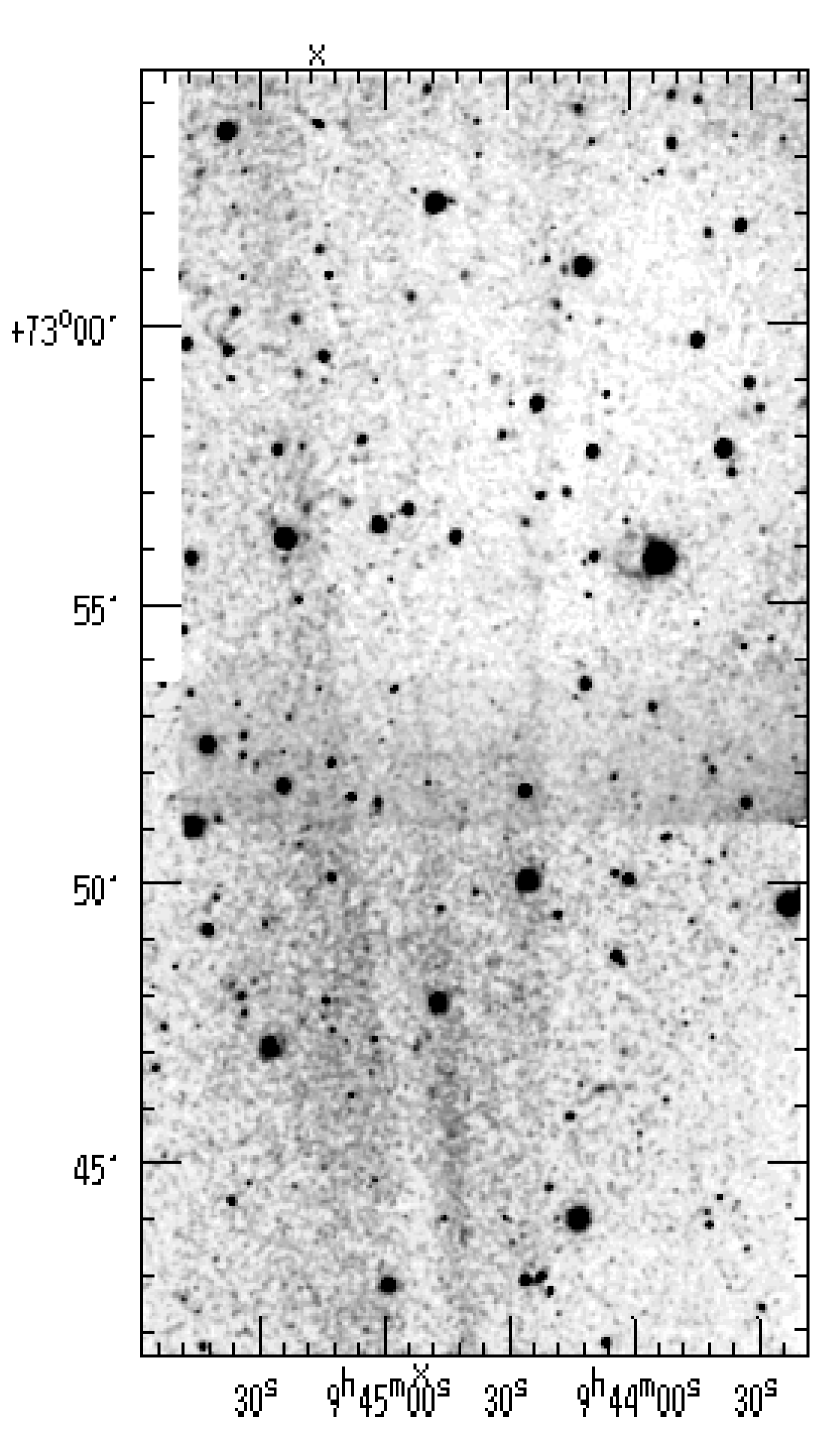
On two nights in January 1997, using a 200-mm f/1.8 lens and a 1.8-nm wide H filter, we obtained H images of the sky containing the galaxies M82 and M81 in order to search for diffuse H emission associated with those galaxies. While that search turned up negative, we did find a 2.5°-long, very narrow, faint, linear feature (Figures 1 and 2). Follow-up observations were obtained in April and May 1999 with the Mt. Laguna Observatory 1-m telescope and a different filter that confirmed that the object is not an artifact of the 200-mm lens or filter (Figure 3).
The filament is a 2.5° long, very linear feature with a H surface brightness above background of 0.5 rayleighs. (One rayleigh (1 R) is and at H corresponds to an emission measure (EM) of approximately 2 cm-6 pc.) The brightness scale was calibrated by comparing our observations of the Rosette nebula to those of Celnik (1983). Figures 1, 2, and especially 3 show that the filament flares at its northern end, forming a “Y” shape. At the southern end of the “Y”, at declination 71°, the filament is 20″ wide and at its northern end, at declination 73°, it breaks into three filaments. (So the object is not exactly like a “Y”; in addition to the two diagonal line segments of a “Y,” it also has a vertical line segment extending between those two line segments.) The full width of the “Y” at its northern end, is approximately 5′. The length-to-width ratio is thus very large (2.5°/20″= 450; 2.5°/5′= 30).
We have also detected the filament using the Wisconsin H Mapper (WHAM) in an imaging mode (Tufte 1997), but the image quality is poorer than that of Figure 1. Nevertheless, the WHAM imaging-mode data give a preliminary velocity of the filament of between and , and confirm that it is not an extragalactic source.
3 Possible Explanations
Using Skyview111http://skyview.gsfc.nasa.gov/skyview.html, (McGlynn, Scollick, & White (1996)), we searched for associated emission in other band passes. No corresponding structure was seen in the ROSAT All-Sky Survey (Snowden et al. (1997)), IRAS survey (Wheelock et al. (1994)), or 408 MHz synchrotron emission maps (Haslam et al. (1982)). The 408 MHz maps have much poorer angular resolution than the H image in Figure 1, so a lack of an association may not be compelling in that case. Sandage (1976) exposed a red-sensitive Schmidt plate for 2.5 hours to reach a surface brightness of 27 mag per square arcsecond. Although the surface brightness of the filament’s H emission alone is too faint to have been detected on Sandage’s plate, the plate shows reflection nebulosity from interstellar dust (cirrus) quite plainly throughout the region, and with finer angular resolution than IRAS data. However, no evidence of the filament is visible on Sandage’s plate.
What is the origin of this object? We consider four possibilities, in what we consider increasing order of likelihood. The choices are (1) an extremely low density, nearby jet; (2) an unusually linear filament associated with some large-scale nearby nebula, perhaps even the Local Bubble; (3) an ionized trail left by mechanical input from a star or compact object moving through the ISM; (4) an ionized trail left by photoionization from a stellar or compact ionizing source (an FST).
3.1 A low-density, nearby jet?
Stellar and extragalactic jets can be as straight and linear as the feature that we have detected (Hughes 1991). However, we consider it unlikely that the structure we have detected is a jet for three reasons. First, as we noted earlier, the filament is a Galactic source, but we see no clear association with any young star or molecular cloud. Second, we see no evidence for associated synchrotron emission in 408 MHz maps (Haslam et al. (1982)), although the narrow jet would be significantly beam-diluted in one dimension in the 0°.85 resolution 408 MHz maps. Third, the H surface brightnesses typical of stellar jets exceeds that observed for our filament by orders of magnitude, e.g., the jet associated with HH 111 has an H surface brightness of 500 rayleighs (Reipurth et al. 1997). The latter two reasons do not rule out the possibility that the object is a stellar jet, but if it is one, then it is much fainter than any other previously observed.
3.2 Filamentary nebula, straight-and-narrow by chance?
It is possible that the object is just a natural interstellar filament and has no stellar origin. Other large scale H filaments are seen (Haffner, Reynolds, & Tufte 1998). However, our filament is much straighter than nearly any other nebular structure. The “Southern Thread” near the Galactic center is as narrow and nearly as straight as our filament, but the “Southern Thread” is a nonthermal source with no detectable recombination radiation and therefore is a much different physical situation than our filament (Lang 1999). Our filament is at moderate galactic latitude, , and is not associated with a traditional HII region. Although WHAM has recently enabled the discovery of several large-scale high-latitude HII regions, we have inspected these maps (Haffner 2000) and find no clear association between any well-defined nebula and our filament. Another possibility is that it is associated with the Local Bubble. However, the fact that we have not seen any other similar features in any other part of the sky makes this possibility seem unlikely.
3.3 Shock-ionized Trail?
Several examples of interactions between moving stars and interstellar matter are now known, including bow shocks around O stars and neutron stars. The resulting emission structures have been assumed to arise in the zone of impact between the stellar or pulsar wind with the ISM. The O-type stars’ bow shocks tend to be shaped like arcs or comets and are not long, narrow filaments (Van Buren et al. 1990). Because of their large speed, pulsars can leave long, narrow trails. The clearest example of such is the “Guitar nebula”, a bow-shock and trail left behind the fast pulsar PSR 2224+65 (Cordes, Romani, & Lundgren 1993). However, there are no O or B stars in the vicinity of our object, nor are there any known radio pulsars. This does not preclude the possibility that a neutron star is responsible, since we may not be in the pulsar beam path. However, our filament is times fainter than the “Guitar nebula”, and times longer (2.5° vs. 1′). For the Guitar Nebula to appear 2.5° long, it would have to be 13 pc distant, i.e. 4 times closer than the nearest neutron star, RXJ1856.5-3754, which is 60 pc distant. RXJ1856.5-3754 has an associated H bow shock (van Kerkwijk & Kulkarni 2000); however, it is only wide and long, which is a much smaller size and different morphology than our filament.
3.4 Fossil Strömgren Trail?
Finally, we consider that our object might be an example of a “Fossil Strömgren Trail” (FST) left behind an ionizing source cruising through the local interstellar medium, as predicted by Dupree & Raymond (1983). Dupree & Raymond focused on the FST left behind a white dwarf, in an attempt to explain the detection of interstellar C IV absorption in white dwarf stars. In principle, any low luminosity ionizing source could leave such a trail; in this section we use the abreviation “WD” to refer to “white dwarf” but also, more generically, to any source of sufficiently low ionizing luminosity that its Strömgren radius is small compared to the distance it travels in a recombination time. No such FST has been observed in H.
We present here some fundamental considerations concerning the width, length and brightness of an FST. The principal parameters are the WD’s space velocity, , and its rate of production of H ionizing photons, . (We choose the normalization to match the ionizing luminosity of a hot (young) white dwarf (Dupree & Raymond 1983)). We define a factor to account for geometrical projection, , where is the WD’s radial velocity, and is the transverse velocity. The transverse velocity can be obtained using the distance, , and the proper motion, , of the WD: . Other parameters include the gas density, , the electron density, , and the gas temperature, . For a recombination coefficient, (Martin 1988), one can estimate a recombination time, .
For a stationary WD, the Strömgren radius is with a central intensity of . For a WD moving transverse to the line of sight, the parameters of the FST are as follows. The FST’s length is determined by the recombination time of the ionized gas and the WD’s velocity, . The FST’s width may be obtained by assuming that the Strömgren volume, in which the number of ionizations balances the number of recombinations, is a cylinder with a length given above. In that case the width (or diameter of the Strömgren cylinder) is , where is the hydrogen ionizing luminosity (photons ), and we will express velocity in units . The H intensity is , and the width is given in parsecs.
Putting the above equations into dimensional units, and including the projection factor , the FST’s angular length is
| (1) |
where the factor in brackets is proportional to the proper motion. The FST’s angular width is
| (2) |
and its H surface brightness is
| (3) |
These formulae do not take into account dynamical evolution of the ionized region; this is discussed further in Section 4.
If we define , then we can combine equations 1 and 2 to yield an equation that relates the luminosity and velocity of the ionizing source,
| (4) |
Note that the latter equation is independent of distance, but if we define , then we can combine equations 2 and 3 to estimate the distance of the source,
| (5) |
In this system of equations, we have three observables and six unknowns. The observable quantities are angular length , width and intensity . The six unknowns are the projection factor , the gas density and temperature , the source distance , ionizing luminosity , and transverse velocity . We may assume that for the FST to be easily detectable, , for solar metallicity photoionized nebulae, , and a typical density of diffuse neutral interstellar matter is 1 . We thus can constrain the combination of distance, velocity and luminosity of the source using these expressions with our observational results. Assuming a fixed length, , ranges from to , which yields a luminosity in the range and distance in the range .
For reasonable parameters, therefore, we expect that the source of the FST should be rather close, i.e. approximately 100 parsecs. If the source can be identified and studied, we can use the above equations (or a more complicated model based on these considerations) to better constrain the properties of the local interstellar medium.
3.5 A Search for the Ionizing Source
We have used the SIMBAD data base to search for associated point sources along the filament, in particular white dwarf stars, EUVE sources, ROSAT point sources, pulsars, and high proper motion stars. We have found only one potential ionizing source, noted both as a ROSAT bright point source, RX J094247.2+700238, and as a EUVE source, EUVE J0942+700 (Chistian et al 1999). The ROSAT source is located at , with a position uncertainty of (1 radius including systematic error). The EUVE source position has a much larger uncertainty , but is consistent with the X-ray source. This source is extremely close to the line traced out by the filament and is 1° south of the Y-shaped section that we have observed.
Two papers have identified this ionizing source as one of a pair of common proper motion M dwarfs: LHS 2176/LHS 2178 (also, GL 360/362) (Hunsch et al 1999; Marino, Micela, & Peres 2000). However, LHS 2178 is (2.4 ) away from the ROSAT point source position, while LHS 2176 is (4.9 ) away. This is a marginal association. If the M dwarf is in fact tht ionizing source, there are two lines of evidence that suggest that it is not resposible for the filament we have observed.
First, if one of the two M-dwarfs were the ionizing source, we can use the parallax, brightness, and a model of spectral emission to estimate the ionizing output, and compare this to the expectations given above. Measured (Hipparcos) parallaxes place these M-dwarfs 11.8 and 11.5 parsecs distant, respectively (Perryman et al 1997). The measured hardness ratio of the X-ray source, assuming a Raymond-Smith model of a thermal plasma, (Raymond & Smith 1977) may be used to estimate the temperature of the emitting plasma. Using the conversion factors in Figure 1 of Mariono et al. (2000), we find that the observed hardness ratio corresponds to a plasma temperature of assuming no intervening absorption. Using the distance to LHS 2178, the observed X-ray count rate, and this plasma temperature, we have calculated the resulting luminosity of ionizing photons: . In general it is not thought that the EUV flux of M dwarfs is enhanced relative to the X-ray (Audard et al 2000), and limits on the UV flux of this source have been obtained (Christian et al 1999). Thus, the distance of this source would be 10 times closer with an ionizing output six orders of magnitude lower than one would require given the considerations in Sec. 3.4.
Second, the proper motion measured for these stars yields a transverse velocity of (Odenkirchen et al. 1997), with a position angle of the proper motion is , while the filament has a position angle of . The proper motions of these two stars and many others near the southern end of the filament are shown in Figure 4. (Odenkirchen et al. measured 365 stars’ proper motions because they were near M81, which happens to be near the southern end of our filament.) We describe in the next paragraphs that these two position angles cannot be reconciled given what we know about the relative motions of the Sun, this binary system, and the local interstellar gas.
Imagine that the ISM is stationary with respect to the local standard of rest (LSR). If the Sun also was stationary with respect to the LSR, then the proper motion of the WD that made the FST would be aligned with the FST. Because the Sun moves with respect to the LSR, we should transform the WD’s heliocentric radial velocity and proper motion to the LSR frame before comparing the WD’s path to the H filament. Two determinations of the solar motion, or equivalently two definitions of the LSR, are that the Sun is moving at +20 km s-1 towards (Delhaye 1965) or that the Sun is moving at +13 km s-1 towards (Dehnen & Binney 1998).
In actuality, the solar motion, whatever its value and direction, is not a sufficient correction to the WD’s motion, because an interstellar wind blows with respect to the LSR. That is, the LSR is defined in terms of the motions of stars, and interstellar gases move with respect to that LSR.
As measured from a reference frame at rest with respect to the local wind, the proper motion of the WD will be aligned with the FST. (This assumes that the wind near the Sun is identical to the wind at the WD’s location.) Two determinations of the local ISM’s wind are that a wind is coming toward the heliocentric reference frame at 28 km s-1 from (Crutcher 1982), or 23 km s-1 from (Holzer 1989) Crutcher analyzed optical absorption lines and 21-cm emission lines over distances of approximately 100 pc. Holzer reviews results based upon backscattered light from the heliopause, at a distance of approximately 100 AU.
We have transformed the heliocentric velocity vectors of several candidate stars as described above in order to predict the locations of those stars in the past few hundred thousand years. Having performed this transformation for each of the four possible reference frames described above, we cannot match the filament’s location and position angle with either of the two candidates chosen based upon their location in line with and south of the filament: the double system LHS 2176/2178; or the brightest star in Figure 1 that lies along the filament, SAO 14966.
We are left, therefore, with one candidate ionizing source, but no convincing optical counterpart. We note, however, that a white dwarf with an ionizing luminosity of would have an absolute V magnitude of approximately 10, so that if the distance, pc, the blue-colored hot star would have an apparent visual magnitude . Such an object might have been overlooked.
3.6 Depolarization of Background Radio Emission
Recent observations of the polarization of the ISM between 325 MHz and 5 GHz reveal a class of relatively straight, filamentary structures seen in Faraday depolarization of synchrotron emission from the Galactic halo (c.f., Haverkorn, Katgert, & de Bruyn 2000; Wieringa et al. 1993). This presumably occurs when the Faraday rotation across the beam is large enough that the net polarization drops. We are not aware of any such observations specifically of our filament. Observations of Haverkorn et al. (2000) have an angular resolution of 4′, and their filaments (the Dutch authors call them “canals”) appear essentially unresolved. The angular lengths of those filaments are similar to our object. For reasonable interstellar parameters, the filament described in this paper could produce a Faraday depolarization. The angle of rotation (in radians) is given by , where is the observed wavelength in meters, and is the electron density in (Spitzer 1978). If we make the assumption that the density and magnetic field are uniform in the filament, then the rotation of the angle of polarization can be written as
| (6) |
In this equation, is measured in rayleighs. At 325 MHz, for a brightness of 0.5 rayleigh, an assumed magnetic field strength of 3 , and a temperature of 10,000 K, a rotation of 1 radian would occur for a density of 3 . If a connection between filaments seen in emission and polarization is established, a comparison of the two observations can constrain the ratio of magnetic field strength to gas density.
4 Future Observational Tests
Although the extreme linearity of the feature seems evidence for a point-source origin for this filament; it remains possible that is just an ordinary nebular filamentation that is unusually straight. Here, we discuss possible tests by which the nature of this filament might be ascertained.
There are several generic features that we expect to be associated with a FST that would not be present for a standard nebular filament. First, as the hydrogen recombines, there should be an intensity gradient in along the filament. Second, since different ions recombine at different rates, there should be a significant variation in line ratios along the filament. Third, since the gas has been impulsively heated by photoionization from the passing source, there should be a decrease in gas temperature along the filament. Fourth, the heating should also produce an thermally overpressured region that will expand along the filament (depending upon the ambient pressure structure). Finally, random motions in the surrounding medium should produce irregularities and distortion of the trail over time. All of these feature are amenable to observational tests. However, it may be difficult to sort out some of these effects. Complicating the issues is that fact that the luminosity and temperature of a WD can vary considerably along the trail. Here we present some of the more fundamental considerations. A detailed model is deferred to future work.
Intensity gradients: Probably the most compelling test would be to search for ionization and intensity gradients along the filament, using narrow band imaging or spectroscopy. If the filament were unusually straight by chance alone, we would expect that the intensity and ionization level should be roughly constant along the filament. On the other hand, if the filament were an example of a shocked or photoionized trail, one would expect to see a variation in the intensity and ionization level, and perhaps a characteristic velocity pattern as well.
If we define (measured in degrees) as the current position of the ionizing source, then the electron density is given by
| (7) |
This will result in a gradient in intensity along the length of the FST. In the actual interstellar medium, however, the absolute intensity along the FST will be affected by inhomegenities in the ambient density.
Ionization gradients: A method that would be insensitive to inhomogeneities would be to measure the ratio of intensities of different lines, such as the forbidden optical transitions of [S II] and [N II], as a function of position. If the ionization is impulsive, and the gas is recombining behind some source of shock ionization or photoionization, there will be a variation in the line ratios with position. The recombination time for N II is 58% of that of H II, while S II is 250% longer than H II (Raymond & Smith 1977; Raymond & Cox 1985) . The Case A recombination time of H II is years. Figure 5 shows the intensities of the [S II], [N II], and H transitions as functions of position along the FST . The intensities have all been normalized to unity at , and the initial state of the gas is assumed to be fully ionized, with nitrogen and sulfur all in the first ionization stage. This assumes the gas temperature is constant at K.
In addition to providing us with evidence that there is or is not an ionization gradient, additional observations may yield valuable information on the ionization mechanism. For example, the Guitar nebula emits a “nonradiative” shock spectrum of pure Balmer lines and no metal lines, so detecting S II from our object would prove it is not the same type of object as the Guitar nebula. If the spectrum looks like typical ISM spectra, e.g. with a S/H line intensity ratio of 0.4 (Reynolds 1985) independent of position, then it is probably just another faint filament in the interstellar medium that happens to be at moderate galactic latitude and is unusually thin, straight, and long. The intensity ratio of S II 6716 / H 6563 is 0.1 in Strömgren spheres, and 0.4 in the diffuse ISM (Reynolds 1985). The intensity ratio of N II 6584 / H 6563 is similar to S II 6716 / H 6563 in the diffuse ISM (Haffner, Reynolds, & Tufte 1999). Scaling from the 0.5 R H line, the expected intensity of the S II 6716 line will be 0.05 to 0.2 R, depending on the characteristics of the ionization source.
Temperature gradients: The cooling rate for solar metallicity plasma at K is (Osterbrock 1989). Assuming a constant pressure, the cooling time is years. Since this time scale is comparable to the timescale for recombination, collisionally excited optical line emission may be suppressed compared to the considerations presented above, which considered only the ionization balance at a constant temperature. A potential further complication is that adiabatic expansion as well as radiative cooling may contribute to the energy loss.
Nebular expansion: Given that the gas is heated by a source that is (probably) moving supersonically with respect to the neutral interstellar medium, the heating will be instantaneous compared to the subsequent cooling and dynamical readjustment. Clearly, the filament we have detected has this morphology, being wider at one end than the other. If we think of the Y-shape as a V-shape, then we can define an opening angle, , of the two line segments of the V. The observed value of 5′/2.5° = 0.033 radians. If we assume that the filament lies in the plane of the sky and expands transversely at approximately the sound speed, of the heated ( K) gas, then radians. This is rather large compared to the observed opening angle, unless the source velocity were extremely high. The assumption that the gas expands at the sound speed may be somewhat extreme, because other sources of interstellar pressure may dominate over the thermal pressure. Evidence for position dependent expansion velocities or velocity gradients would provide important constraints for more detailed ionization and dynamical modeling that are beyond the scope of this paper.
5 Summary
We report on the discovery of a narrow, 2.5° long, ionized filament in the ISM that looks much like the contrail behind an aircraft. While its origin may be no different than any other such filament in the ISM, and its straightness and its narrowness are simply a fluke, another possibility is that it is the trail left by a white dwarf or some other low-luminosity source moving quickly through a neutral medium and photoionizing it as it passes. We explore the implications of such a model, which may be called a “Strömgren cylinder” or a “Fossil Stromgren Trail.” We parameterize its length, width, and brightness in terms of the ionizing source’s luminosity and velocity, and the ambient gas density. Two other models, namely a stellar jet and a shock-ionized trail, are noted but found to be unlikely explanations because this filament’s properties are very different than other examples of those types of object.
Whatever the cause of the filament, it deserves further study based upon its unique appearance. Its large angular size suggests that it is nearby, and therefore it should be possible to identify what has created it. For example, if the culprit star can be identified, then this filament may be used to constrain interesting parameters of the local interstellar medium: in particular, the density of the ambient gas and its motion with respect to the LSR. A particularly interesting question is what determines the length of the trail. Is it dominated by local microphysics, i.e., the hydrogen recombination time, as we have assumed, or is it dissipation due to shear or turbulent motions in the ISM? The longevity of the trail therefore could be used to constrain the velocity dispersion in the local ISM. If filaments like this one can be shown to be “streak lines”222In hydrodynamics, a streakline is a line traced out by a dye continuously injected into the flow. in the flow of interstellar gas, then collectively and individually they would be a significant new probe of the dynamics of the interstellar medium anywhere that they are found.
References
- Celnik (1983) Celnik, W. E. 1983, A&AS, 53, 403
- Christian (1999) Christian, D.J., Craig, N., Cahill, W., Roberts, B., & Malina, R. F. 1999 AJ, 117, 2466
- Cordes, Romani & Lundgren (1993) Cordes, J. M., Romani, R. W. & Lundgren, S. C. 1993, Nature, 362, 133
- Dupree & Raymond (1983) Dupree, A. K. & Raymond, J.C. 1983, ApJ, 275, L71
- Elmergreen (1976) Elmergreen, B. G. 1976, ApJ, 205, 405
- Haffner (2000) Haffner, L. M. 2000, in Fourth Tetons Conference: Galactic Structure, Stars, and the Interstellar Medium, ASP Conference Series, eds. M.D. Bicay & C. E. Woodward
- Haffner, Reynolds & Tufte (1998) Haffner, L. M., Reynolds, R. J. & Tufte, S. L. 1998, ApJ, 501, L83
- Haffner, Reynolds & Tufte (1999) Haffner, L. M., Reynolds, R. J. & Tufte, S. L. 1999, ApJ, 523, 223
- Haslam et al. (1982) Haslam, C. G. T., Stoffel, H., Salter, C. J., & Wilson, W. E. 1982, A&AS 47, 1
- Haverkorn, Katgert, & de Bruyn (2000) Haverkorn, M., Katgert, P., & de Bruyn, A. G. 2000, A&A, 356, L13
- Hughes (1991) Hughes, P. A. 1991, Beams and jets in astrophysics Cambridge University Press (Cambridge Astrophysics Series, No. 19), 593 p.,
- Hünsch, Schmitt, Sterzik & Voges (1999) Hünsch, M., Schmitt, J. H. M. M., Sterzik, M. F. & Voges, W. 1999, A&AS, 135, 319
- Kerkwijk & Kulkarni (2000) Kerkwijk, M. & Kulkarni, S. 2000, ESO Press Release 11Sep2000, also http://antwrp.gsfc.nasa.gov/apod/ap001025.html.
- Lang, Morris & Echevarria (1999) Lang, C. C., Morris, M. & Echevarria, L. 1999, ApJ, 526, 727
- Marino, Micela & Peres (2000) Marino, A., Micela, G. & Peres, G. 2000, A&A, 353, 177
- Martin (1988) Martin, P. G. 1988, ApJS, 66, 125
- McGlynn, Scollick, & White (1996) McGlynn, T., Scollick, K., White, N. 1996, SkyView: The Multi-Wavelength Sky on the Internet, McLean, B.J. et al., New Horizons from Multi-Wavelength Sky Surveys, Kluwer Academic Publishers, IAU Symposium No. 179, p. 465.
- Odenkirchen et al. (1997) Odenkirchen, M., Brosche, P., Borngen, F., Meusinger, H. & Ziener, R. 1997, A&AS, 124, 189
- Perryman et al. (1997) Perryman, M. A. C. et al. 1997, A&A, 323, L49
- Raymond & Cox (1985) Raymond, J. C. & Cox, D. P. 1985, ApJ, 298, 651
- Raymond & Smith (1977) Raymond, J. C. & Smith, B. W. 1977, ApJS, 35, 419
- Reipurth et al. (1997) Reipurth, B., Hartigan, P., Heathcote, S., Morse, J. A. & Bally, J. 1997, AJ, 114, 757
- Reynolds (1985) Reynolds, R. J. 1985, ApJ, 294, 256
- Sandage (1976) Sandage, A. 1976, AJ, 81, 954
- Snowden et al. (1997) Snowden, S. L et al. 1997, ApJ, 485, 125
- Spitzer (1978) Spitzer, L. 1978, New York Wiley-Interscience, 1978. p. 66.
- Thuan (1975) Thuan, T. X. 1975, ApJ, 198, 307
- Tufte (1997) Tufte, S.L. 1997, PhD Thesis, University Wisconsin-Madison
- Van Buren et al. (1990) Van Buren, D., Mac Low, M., Wood, D. O. S., & Churchwell, E. 1990, ApJ, 353, 570
- Wheelock et al. (1994) Wheelock, S. L. et al. 1994, IRAS Sky Survey Atlas: Explanatory Supplement, STIN 95, 222539