Reconciliation of the Surface Brightness Fluctuations
and Type Ia Supernovae Distance Scales11affiliation: Based on observations with the NASA/ESA Hubble
Space Telescope, obtained at the Space Telescope Science Institute,
which is operated by the Association of Universities for Research in
Astronomy (AURA), Inc., under NASA contract NAS5-26555. These
observations are associated with proposal IDs 8212, 5990, and 6587.
Abstract
We present Hubble Space Telescope measurements of surface brightness fluctuations (SBF) distances to early-type galaxies that have hosted Type Ia supernovae (SNIa). The agreement in the relative SBF and SNIa multicolor light curve shape (MLCS) and delta- (dm15) distances is excellent. There is no systematic scale error with distance, and previous work has shown that SBF and SNIa give consistent ties to the Hubble flow. However, we confirm a systematic offset of 0.25 mag in the distance zero points of the two methods, and we trace this offset to their respective Cepheid calibrations. SBF has in the past been calibrated with Cepheid distances from the Key Project team, while SNIa have been calibrated with Cepheid distances from the team composed of Sandage, Saha, and collaborators. When the two methods are calibrated in a consistent way, their distances are in superb agreement. Until the conflict over the “long” and “short” extragalactic Cepheid distances among many galaxies is resolved, we cannot definitively constrain the Hubble constant to better than %, even leaving aside the additional uncertainty in the distance to the Large Magellanic Cloud, common to both Cepheid scales. However, recent theoretical SBF predictions from stellar population models favor the Key Project Cepheid scale, while the theoretical SNIa calibration lies between the long and short scales. In addition, while the current SBF distance to M31/M32 is in good agreement with the RR Lyrae and red giant branch distances, calibrating SBF with the longer Cepheid scale would introduce a 0.3 mag offset with respect to the RR Lyrae scale.
1 Introduction
The single most important parameter in an expanding universe model is the rate of expansion, that is, the Hubble constant . From the ages of the oldest stars, to the masses of galaxies and clusters, to the cosmic baryon density predicted by big-bang nucleosynthesis, underlies everything. Knowledge of is essential for relating physical scales within our Galaxy to extragalactic phenomena: it sets the age, distance, and mass scales for the universe.
The most straightforward way of determining is by measuring calibrated galaxy distances well out into the Hubble flow, where peculiar velocities become unimportant. Two of the highest precision methods for measuring extragalactic distances are Type Ia supernovae (SNIa) and surface brightness fluctuations (SBF). Both methods typically achieve distance accuracies of 10% or better. While SNIa have a long history as standard candles, only recently have the empirical calibration of their luminosities in terms of the decline rate (parametrized by “dm15,” the difference between the magnitudes at peak and fifteen days after peak) (Phillips, 1993) and the use of multicolor light curve shapes (MLCS) to constrain dust extinction (Riess et al., 1998) made them outstandingly accurate. Similarly, the SBF method showed great promise from its inception (Tonry & Schneider, 1988; Tonry, Ajhar & Luppino, 1990), but only recently has it been well-calibrated in terms of stellar population (Tonry et al. 1997, 2000, hereafter SBF-I and SBF-II; Ajhar et al. 1997) and extensively modeled from a theoretical perspective (Worthey, 1993a, b; Liu, Charlot & Graham, 2000; Blakeslee, Vazdekis & Ajhar, 2001).
Curiously, SBF and SNIa have often been associated with opposing camps in the traditional distance scale controversy. The SNIa method has seemed to favor the “long” distance scale with km sMpc-1 (Riess et al., 1998; Hamuy et al., 1996; Sandage et al., 1996; Saha et al., 1999), while SBF has seemed to favor the “short” distance scale with km sMpc-1 (SBF-I; Lauer et al. 1998). Several years ago, it was possible to discount from SBF because ground-based SBF distances only reached to km s-1, requiring a tie to the Hubble flow via some other distance estimator, but this extra step has not been a part of the more recent SBF determinations.
Over the past few years there has been considerable convergence on . For instance, Blakeslee et al. (1999, hereafter SBF-III) find by correcting the peculiar velocities of the SBF survey galaxies (Tonry et al., 2001, hereafter SBF-IV) according to the gravity field derived from the IRAS 1.2 Jy redshift survey (Fisher et al., 1995), and Jensen et al. (2001) find km sMpc-1 from -band Hubble Space Telescope (HST) NICMOS SBF distances to 6 galaxies beyond 7000 km s-1. Using the SNIa method, Gibson & Stetson (2001) find km sMpc-1 based on nine SNIa hosts with Cepheid distances. The Key Project group (hereafter KP) has reported final values of from SBF and from SNIa (Freedman et al., 2001). Moreover, the results of SBF-III and Riess et al. (1997) show that SBF and SNIa trace the same local velocity field, and therefore imply a consistent tie to the Hubble flow.
However, the Sandage-Saha group (hereafter S&S) find a significantly smaller km sMpc-1 (Parodi et al., 2000), based on what are essentially the same SNIa and Cepheid data. The disagreement over the value of from SNIa is due to a number of subtle differences in the data treatment, including the Cepheid measurements themselves, as discussed by Parodi et al. (2000) and Gibson et al. (2000).
Faced with this controversy over derived from SBF and SNIa, we undertook to obtain new SBF measurements in galaxies which have hosted SNIa. Because the early-type galaxies best suited for SBF are rare in comparison to late-tape galaxies and because well-measured SNIa are much rarer still, we were forced to distances beyond 2000 km s-1, which requires HST for high quality SBF distances. In this paper we present new SBF measurements with HST/WFPC2 for seven galaxies which have hosted SNIa, and we also report ground-based SBF distances for seven other SNIa hosts. These data allow us to evaluate the agreement between SBF and SNIa relative distances over an unprecedented distance range and with enough galaxies to provide solid statistics.
2 HST Observations
The primary data set comprises Hubble Space Telescope images of five galaxies observed from 1999 July through 2000 June with the Wide Field and Planetary Camera 2 (WFPC2) (Holtzman et al., 1995a, b) through our GO program 8212. In addition we report measurements of NGC 1316 taken from program 5990 and NGC 5061 taken from program 6587. We selected elliptical and lenticular galaxies hosting normal SNIa for which suitable SNIa data existed and which were near enough to allow good SBF measurements in relatively few HST orbits. Our candidate selection has allowed us to extend the distance modulus range of overlap between these two methods by 2.5 mag. The two methods now have a common distance range of 10–73 Mpc.
Table 1 lists each galaxy in column 1 with its corresponding supernova in column 2. Column 3 lists the velocity (km s-1) transformed to the CMB frame, while the WFPC2 exposure times (in seconds) are listed in column 4 and -band Galactic extinctions from Schlegel, Finkbeiner & Davis (1998, hereafter SFD) are in column 5. The exposure times were chosen for each galaxy to obtain sufficient signal-to-noise for good SBF measurements. The typical exposure sequence for a given galaxy consisted of several dithered exposures in the F814W () filter to provide cosmic ray rejection and better flattening. The galaxies were always centered in the Planetary Camera (PC) CCD. The SBF analysis was conducted on the PC images alone, while the sky levels and total galaxy magnitudes were estimated by constructing a mosaic of the PC and the three WF images—forming the usual chevron.
| Galaxy | SNIa | ||||||
|---|---|---|---|---|---|---|---|
| (1) | (2) | (3) | (4) | (5) | (6) | (7) | (8) |
| WFPC2 F814W Data | |||||||
| E352-057 | 1992bo | 5331 | 23,800 | 0.12 | 20.28 | ||
| N1316 | 1980N | 1657 | 1860 | 0.09 | 22.66 | ||
| N2258 | 1997E | 3961 | 16,200 | 1.13aaThe SFD extinction is 0.55, but the one adopted here is based on . See text. | 22.38 | ||
| N2962 | 1995D | 2450 | 6900 | 0.25 | 21.06 | ||
| N5061 | 1996X | 2353 | 1800 | 0.30 | 21.65 | ||
| N5308 | 1996bk | 2147 | 4000 | 0.08 | 20.73 | ||
| N6495 | 1998bp | 3144 | 9200 | 0.34 | 20.83 | ||
| Ground-based SBF Survey Data | |||||||
| N0524 | 2000cx | 2091 | 0.36 | 21.59 | |||
| N1316 | 1980N | 1657 | 0.09 | 22.66 | |||
| N1380 | 1992A | 1732 | 0.08 | 20.77 | |||
| N3368 | 1998bu | 1252 | 0.11 | 20.22 | |||
| N4374 | 1991bg | 1375 | 0.17 | 21.97 | |||
| N4526 | 1994D | 949 | 0.10 | 21.13 | |||
| N5128 | 1986G | 812 | 0.50 | 21.81 | |||
The SBF analysis was essentially routine, following descriptions discussed elsewhere (Ajhar et al., 1997, SBF-I). Briefly, for each exposure of each galaxy, we registered the standard pipeline-reduced CCD images, and then added them together while statistically eliminating cosmic rays. The total summed image for each galaxy was used in the analysis. We fit a smooth galaxy model; subtract it from the image; identify, characterize, and mask all background and foreground objects in the image; and measure the power spectrum of the galaxy surface brightness. We then scale the galaxy power spectrum to the power spectrum of a suitable point spread function (PSF), and after allowing for a contribution from undetected objects in the image, we obtain a value for the apparent fluctuation magnitude .
For our measurements we used three composite PSFs taken from images of Cen in the standard HST PSF program. We registered (by whole pixels) and added six to fourteen stars in images taken on three different dates: 1999/6/6, 1999/8/3, and 2000/3/10. We measured using each of these PSFs for each galaxy and took the mean for our final . The agreement among the PSFs was always excellent, 0.08 mag or better.
Using the chevron images from the HST observations, we used the program of B. Barris which fits a Sersic model to the curve of growth and produces a total magnitude for the galaxy. Combining this with our value for we obtain . This extinction independent measure of the absolute luminosity of a galaxy introduced in SBF-IV correlates well with a galaxy’s color and , and hence can be used with the observed color of a galaxy to estimate the extinction along its line of sight.
3 Ground-Based Data
Obtaining an SBF distance measurement of a galaxy requires knowledge of its underlying stellar population. A galaxy’s color has been the preferred method for estimating its absolute fluctuation magnitude . We obtained colors for our program galaxies from the SBF survey data and from images taken on photometric nights at the UH 2.2-m telescope during 2000 July and December by B. Barris and P. Capak. These data were reduced in the usual way, following SBF-I, and tied to the existing photometry from the SBF survey. None of the program galaxies showed a significant color gradient, and we maintained a good overlap with the regions covered by the PC. We found agreement to better than 0.02 mag between this ground-based photometry and the WFPC2 F814W photometry as well. These colors are given in column 6, and and are listed in columns 7 and 8, respectively, of Table 1, while the final SBF distance moduli are presented in § 6.
There are a handful of galaxies in the SBF Survey which have hosted supernovae, and we reproduce the data for these galaxies from SBF-IV in Table 1. Two supernovae, SN1986G and SN1991bg, were subluminous SNIa, and although they do not contribute to the SBF-SNIa comparison, we include them here for completeness and for future studies of SNIa luminosities.
4 SBF Distances
It is a curious fact that the very small set of early-type galaxies between 2000 and 5000 km s-1 which have hosted SNIa have a rather large extinction on average—the median SFD for our sample is 0.065 which corresponds to mag. We therefore undertook to calculate the quantity discussed in SBF-IV, which is an extinction independent measure of a galaxy’s color (accurate to about 0.03 mag for ) and absolute luminosity. The agreement between the values of that we obtained from ground-based photometry and SFD extinctions and the values of that we infer from were in superb agreement in four cases. However, for NGC 2258 we found gross disagreement between the SFD corrected ground-based color of and the -estimated color of , and for NGC 5061 we found a three-sigma disagreement between the SFD corrected ground-based color of and the color of .
NGC 2258 has an estimated mag from SFD but is in a region of highly variable extinction in the SFD maps; the -estimated color suggests that the actual extinction along the line of sight to the galaxy is mag. The SNIa analyses described below also call for a larger extinction than SFD (but some could be intrinsic to NGC 2258, of course): the MLCS fit wants mag and the dm15 fit wants mag. As the IRAS pixels were 6′, it is certainly possible that NGC 2258 is sitting on a local spike of extinction. In fact, Arce & Goodman (1999) have found that the SFD map does tend to underestimate the Galactic extinction in regions with steep extinction gradients. Because is far redder than any elliptical galaxy that we have encountered, we have chosen to adopt the -estimated reddening, color, and SBF distance.
NGC 5061 is a less clear-cut case, both because the difference between SFD and is only three sigma, and because both the SFD and colors are plausibly correct for this galaxy. The velocity dispersion and Mg2 index are consistent with both colors. The SFD extinction for NGC 5061 is mag, and the extinction is mag. Both our MLCS and dm15 analyses of SN1996X and that of Salvo et al. (2001) find mag to the supernova, and Salvo et al. (2001) find interstellar Na at the galaxy redshift which would be appropriate for mag, but as always, it is possible that the extinction is local to the supernova. We have chosen to use the SFD extinction in this case. However, we note that if we were to use the color, our SBF distance modulus would drop by 0.33 mag, into better agreement with the SNIa distance (after shifting the two sets of distances to a consistent zero point).
Table 2 lists the SBF distance moduli for the program galaxies on the SBF-II zero point, based on the Cepheid distances tabulated by Ferrarese et al. (2000, hereafter F00). This allows for easy comparison between these SBF distances and those from the SBF survey, tabulated in SBF-IV. However, note that the SNIa distances also appearing in Table 2 are not tied to the F00 Cepheid distances, and therefore cannot yet be compared directly with the SBF distances. The following section discusses the SNIa distances in detail, and then §6 directly compares the SBF and SNIa distances after shifting their respective zero points to a common calibration.
| Galaxy | SNIa | |||
|---|---|---|---|---|
| WFPC2 F814W Data | ||||
| E352-057 | 1992bo | |||
| N1316 | 1980N | |||
| N2258 | 1997E | |||
| N2962 | 1995D | |||
| N5061 | 1996X | |||
| N5308 | 1996bk | |||
| N6495 | 1998bp | |||
| Ground-based SBF Survey Data | ||||
| N0524 | 2000cx | aaThis supernova is a very poor fit (W. Li et al., in preparation), and these distances are untrustworthy. See text. | aaThis supernova is a very poor fit (W. Li et al., in preparation), and these distances are untrustworthy. See text. | |
| N1316 | 1980N | |||
| N1380 | 1992A | |||
| N3368 | 1998bu | |||
| N4374 | 1991bg | |||
| N4526 | 1994D | |||
| N5128 | 1986G | |||
5 Supernova Distances
There are a variety of methods for measuring distances to SNIa, most of which use the shape of the SN light curve for estimating the intrinsic brightnesses of the objects. We use the MLCS and dm15 methods as prescribed by Riess et al. (1998) and Germany (2001), respectively. The MLCS fits the data of SNIa with a multicolor empirical model that has a single parameter, luminosity. This model is matched to the photometry of a SNIa, fitting for the SN luminosity (which is largely a function of the shape of the light curve, but also its color evolution), time of maximum light, and reddening. The empirical model used here was trained on a large set of well observed SNIa in the Hubble flow, using these objects’ Hubble velocities as independent measures of their relative distances and using a quadratic relation between light curve shape and luminosity (Riess et al., 1998).
An alternate way of measuring SNIa distances is through the dm15 method (Phillips, 1993; Hamuy et al., 1996; Phillips et al., 1999; Germany, 2001). Here we use the implementation of Germany (2001) because of the availability of programs, but we would expect similar results if we were to use the recent work of Phillips et al. (1999). Our implementation of dm15 uses well observed SNIa (15 objects) to define a series of multicolor template light curves. These templates are labeled by their dm15, the amount that the light curves fall in in the 15 days after maximum light. Applying each of these templates to more than 60 objects residing beyond 3000 km s-1, we find all template light curves that give (per degree of freedom) with a probability , while fitting for extinction and time of maximum. We then use the range of labeled dm15 values and the Hubble distance to create a diagram as per Phillips (1993), which plots dm15 versus absolute magnitude. In making this diagram, we keep only those objects that are consistent with no reddening, and find a similar set of relations for , , , and as Phillips et al. (1999). To measure the distance to a SN, we then apply a fitting procedure as above, finding the best fitting SN template and reddening, and estimating errors by marginalizing over all SN templates, reddenings, and times of maximum, that provide a fit with a for confidence.
With these two methods, an arbitrary Hubble constant was chosen to train the methods using the Hubble Flow, and therefore the distances provided are not absolutely calibrated. To change to an absolute scale, we calculate a offset for each method by comparing the SNIa distances with their host galaxy Cepheid counterparts. The respective offsets are then applied to the SN distances for each method, providing a set of distances which are tied to the Cepheid distance scale.
The MLCS and dm15 distances are listed in Table 2 on the usual SNIa zero point calibration. For MLCS, the SNIa zero point was calculated from distances based on the S&S (Parodi et al., 2000) Cepheid distance compilation; however, for dm15, Germany (2001) used the tabulation of Suntzeff et al. (1999). This results in a 10% difference in the Hubble constant— (MLCS) and (dm15)—but does not reflect a discrepancy in the methods but, rather, the different Cepheid distance tabulations. This issue is treated in much more detail in §6.2. For Table 2, we have shifted the dm15 moduli from Germany (2001) to use the S&S zero point in order to make comparison between dm15 and MLCS distances straightforward. (Once again, we emphasize that the SBF and SNIa distances in Table 2 are tied to disparate sets of Cepheid distances and have not yet been homogenized.)
Direct comparison of the dm15 and MLCS distances shows an rms scatter of 0.23 mag, indicating that the rms scatter of either method (0.16 mag if taken in equal quadrature) is similar to the rms scatter measured from the scatter in the Hubble flow and of either method with SBF. If we discard SN2000cx which gives a very poor fit by either method and is nearly a outlier in the comparison, we find an rms of 0.18 mag between the methods, implying a dispersion of 0.18 to 0.13 mag by either method depending on their degree of correlation. The SNIa distance methods may benefit from further refinement, but this will require a larger data set to separate out true empirical correlations from the underlying noise.
6 SBF Versus SNIa Distances
In this section we look first at the direct galaxy-to-galaxy comparison of SBF and SNIa relative distances and discuss several of the measurements in detail. Then, we discuss the absolute calibration of SBF and SNIa distances and quantify how the past calibrations have led to different values of . Moreover, we address some of the implications of the different choices that one has in calibrating these methods.
6.1 Direct Galaxy-to-Galaxy Comparison
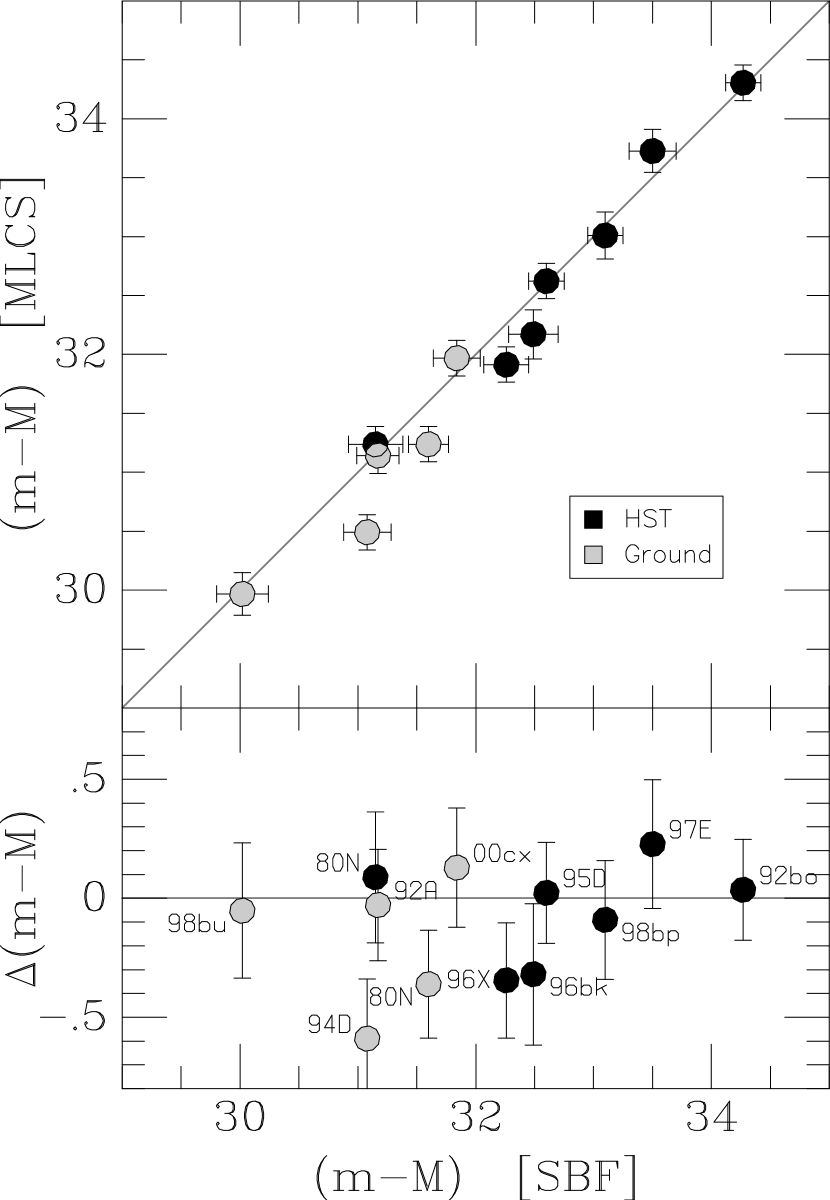
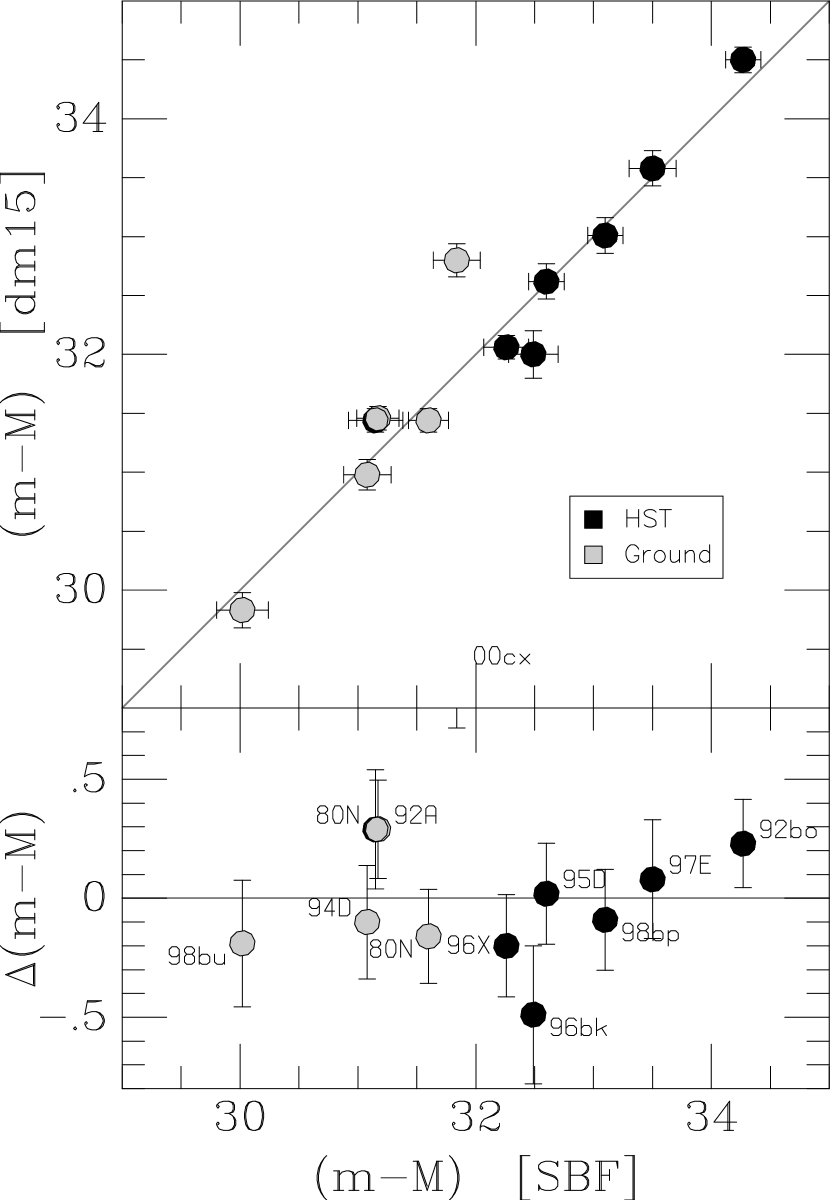
In order to compare the relative distances from SBF and SNIa, it is convenient to move to a common calibration, either by tying directly to the Hubble flow and representing the distances in km s-1, or by tying to a homogeneous set of distance calibrators. Figures 1 and 2 show the comparison between the distance moduli obtained from the SBF and SNIa methods as calibrated by the Cepheid distances of Freedman et al. (2001) for the simplicity of our discussion. The distance moduli on this calibration are collected in Table 3. The HST and ground-based SBF distances are denoted in the figures by black and gray symbols, respectively. It is clear that there is no systematic offset between the HST and ground distances; and any offset between SBF and SNIa distances is quite small (certainly much less than the offset of mag that occurs when changing the MLCS zero point from the Cepheid distances of S&S to those of Freedman et al. 2001, as discussed in § 6.2 below).
Although the scatter in these figures is pretty much consistent with that expected from the error estimates, it is interesting to comment on outliers. There is a discrepancy between the ground-based and HST distances for NGC 1316/SN1980N in Fornax. The SNIa data suggest that the HST distance may be more accurate. The mean modulus for Fornax in SBF-IV is 31.49, which is closer to the SNIa modulus than either of the two individual measurements here.
We attempted many times to measure an SBF distance to NGC 2962/SN1995D from the ground and were never successful, having found power spectra which did not look sufficiently like that of the PSF. Examination of the HST data reveals that much of NGC 2962 is covered by a patchy veil of dust which was not visible at ground-based resolution.
As noted in §4, we are not completely happy with the SBF distance and extinction for NGC 5061 because of the inconsistency between the measured color and that inferred from .
SN2000cx in NGC 524 is problematic because it does not have a light curve that follows any template in the dm15 method, nor does it fit the empirical model of MLCS. Specifically, the SN rises slowly, and then after a long time around peak, falls quickly. The color evolution is also unusual. Because this object lies well outside the behavior of the SNIa that form the basis of each method, the distances to this object are highly suspect, and probably should be disregarded. (See W. Li et al., in preparation, for details on SN2000cx.)
SN1996bk in NGC 5308 was discovered approximately one week after maximum, and it did not have any coverage in the following month which could constrain the maximum from changes in slope of the light curve. So, the possibility of systematic error in the SNIa distances is particularly high.
SN1994D in NGC 4526 is an interesting case. It was observed with exquisite thoroughness, and is used as a prototypical “Branch-normal” (Branch, Fisher & Nugent, 1993) spectrum. It had a light curve which declined rapidly enough that the MLCS fit types it as rather underluminous. However, it is also one of the bluest SNIa ever observed, particularly in the band. This suggests that it may have been a peculiar supernova with less opacity or more explosion energy than normal. Pinto & Eastman (2000a, b) show that this leads to a light curve which peaks earlier and brighter than a standard supernova, and then falls more rapidly. If this is the case, the normal MLCS analysis would place it at an erroneously small distance, which could explain the 0.6 mag difference between the MLCS and SBF distances. Interestingly, the dm15 method gives an SNIa distance in good agreement with the SBF distance.
Overall, the relative accuracy of these SBF and SNIa distances appears to be outstanding, and the error bars reported by each are generally accurate. The discordant points appear to be understandable from systematic effects in the extinction estimates and light-curve template mismatch.
| Galaxy | SNIa | |||
|---|---|---|---|---|
| WFPC2 F814W Data | ||||
| E352-057 | 1992bo | |||
| N1316 | 1980N | |||
| N2258 | 1997E | |||
| N2962 | 1995D | |||
| N5061 | 1996X | |||
| N5308 | 1996bk | |||
| N6495 | 1998bp | |||
| Ground-based SBF Survey Data | ||||
| N0524 | 2000cx | aaThis supernova is a very poor fit (W. Li et al., in preparation), and these distances are untrustworthy. See text. | aaThis supernova is a very poor fit (W. Li et al., in preparation), and these distances are untrustworthy. See text. | |
| N1316 | 1980N | |||
| N1380 | 1992A | |||
| N3368 | 1998bu | |||
| N4374 | 1991bg | |||
| N4526 | 1994D | |||
| N5128 | 1986G | |||
6.2 Absolute Distance Calibration from Cepheids
Presently, absolute distances from SBF and SNIa are tied to one or another set of HST Cepheid distances. Although it is possible to calibrate either distance estimator directly from theory, neither stellar population nor white dwarf explosion models have matured sufficiently to allow us to abandon Cepheid calibration. (We briefly discuss the status of theoretical calibrations in the following section.)
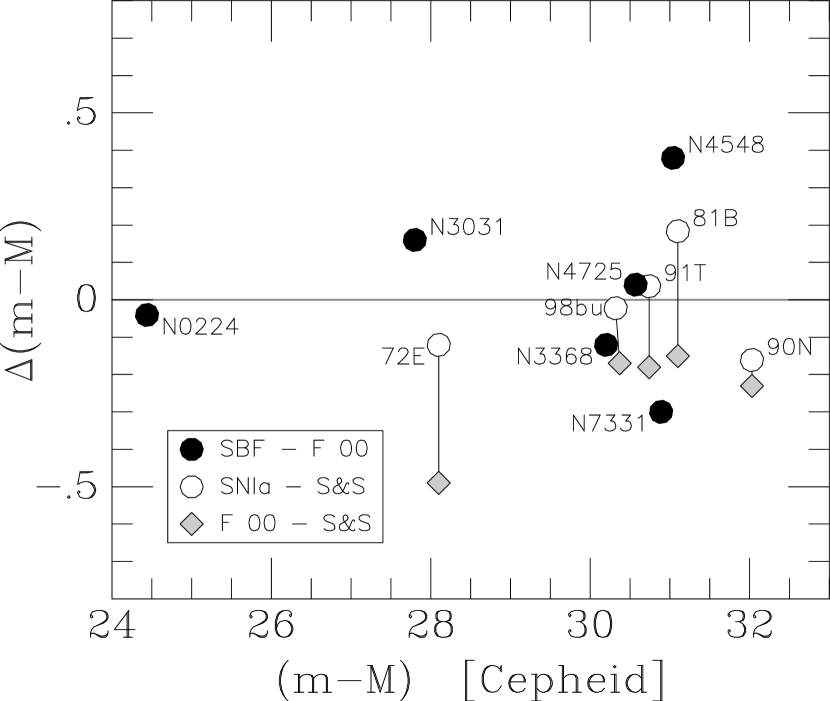
Table 4 lists the Cepheid galaxies chosen to calibrate SBF and SNIa and their distance moduli from the collections discussed above. Figure 3 illustrates how the differences between SBF and SNIa distances originated in the Cepheid calibrations. The SBF distances are all tied to the KP Cepheid distances from F00 according to the SBF-II calibration. This calibration uses only direct galaxy-to-galaxy distance matches, from SBF measurements in the bulges of spirals with Cepheid distances, rather than a potentially troublesome galaxy-to-group fit. The SBF calibrators are represented by the black circles in the diagram. The SNIa calibrators, using the S&S Cepheid distances, are represented by the open circles in the diagram. Finally, the gray diamonds show the KP Cepheid distances from F00 plotted against the S&S Cepheid distances; connecting lines emphasize the difference in the two sets of Cepheid distances. The result is that the mean offset between the “long” (S&S) and “short” (KP) Cepheid distances to these SN calibrators is the source of past differences between values derived from the SBF and SNIa methods. As the recent work by the KP group (F00; Gibson et al., 2000; Freedman et al., 2001) has found consistent values of from SBF and SNIa when homogeneously calibrated, a different result would have been surprising.
As listed in Table 2, the median difference for 12 galaxies between SNIa and SBF distance moduli on the original zero points is 0.23 mag for both the SBF-MLCS and SBF-dm15 comparisons. The rms scatter in the differences, judged from the 1/6 and 5/6 points in the distributions, are 0.22 mag and 0.24 mag respectively. This offset would increase to 0.48 magnitude if we compared to the SNIa calibration of Parodi et al. (2000), but we do not use photographic SNIa light curves which we consider to be of questionable value in setting the SNIa zero point, nor do we apply some of the corrections advocated by Parodi et al. (2000).
If we recalculate our SBF and SNIa zero points using consistent sets of Cepheid distances, we find that Freedman et al. (2001) implies a change of mag in SBF moduli with respect to Table 2 (i.e., closer), mag for MLCS, and mag for dm15. Use of F00 implies offsets of mag for SBF, mag for MLCS, and mag for dm15, and use of Gibson & Stetson (2001) causes offsets of mag for SBF, mag for MLCS, and mag for dm15. Therefore, using the distances given in Freedman et al. (2001) (as we have in § 6.1 above and in Table 3), the median difference between SNIa and SBF distance moduli for the same galaxies becomes mag for MLCS and mag for dm15. Alternatively, using F00 Cepheid distances yields differences of mag for MLCS and mag for dm15. In summary, any large disagreement in the zero point for either SBF or SNIa distances originates from a disjoint set of Cepheids, each reduced by a completely separate group.
While this explanation seems simple, we should not understate the complexity of all the issues involved here. Although describing the S&S and KP Cepheid collections as respectively providing “long” and “short” scales was useful for describing our observations, the details suggest that some of this may have been good fortune. First, the choices of Cepheid host galaxies used to calibrate the MLCS and dm15 SNIa methods will undoubtedly remain in debate among all the practitioners in the field, and these choices directly affect how well matched is any particular SBF calibration to a particular SNIa calibration. We note that while we found a 0.23 mag median difference between S&S and KP Cepheid distances for the subset of galaxies chosen, this differs considerably from the mean offset, and other subsets of common galaxies can produce smaller offsets of around 0.04 mag, especially when each galaxy’s distance is based only on the same set of Cepheids for both techniques (Parodi et al., 2000). In fact, Parodi et al. (2000) have disputed the claim that the KP Cepheid distances for the SNIa calibrators form an internally homogeneous set with the other KP Cepheid galaxies. However, detailed discussion of the techniques used by the different groups for measuring Cepheid distances is beyond the scope of this paper.
Unquestionably, the SNIa and SBF absolute calibrations are in need of further refinement, and work is underway to obtain a better direct Cepheid calibration of SBF with HST. In the end, we may find that the best calibrations of SBF and SNIa absolute distances will require something different from either of the ones we have adopted here.
6.3 Implications for
Table 5 presents various values of which one could obtain from SBF and SNIa distances depending on the set of calibrators chosen. This table emphasizes that the SBF and SNIa techniques give consistent values for when the a consistent set of calibrators is used.
Given that both SBF and SNIa take their zero points from Cepheids, which are themselves the main source of disagreement on , it might appear that we cannot contribute much to resolving the controversy. We note, however, that were we to put SBF on the “long” Cepheid scale which has been used for the SNIa zero point in the past, the resulting mean SBF distance modulus for M31/M32 would change from mag (SBF-IV) to mag. This conflicts with other recent Cepheid-independent measures of the M31 distance. For instance, HST observations of the horizontal branch (HB) magnitudes of M31 globular clusters (Ajhar et al., 1996; Fusi Pecci et al., 1996), calibrated from Hipparcos subdwarf parallaxes (e.g., Carretta et al., 2000), give mag. Recent results on red clump HB stars (Stanek & Garnavich, 1998), globular cluster red giant branch (RGB) fitting (Holland, 1998), and the RGB tip for halo stars (Durrell, Harris & Pritchet, 2001) all give mag with formal errors of 0.1 mag. The mean magnitude of the M31 globular cluster population (Barmby, Huchra & Brodie, 2001), when compared to that of the Milky Way globular clusters (Secker, 1992, revised brighter by 0.21 mag according to the Hipparcos RR Lyrae zero point) implies . Adopting the brighter Sandage & Tammann (1995) Milky Way calibration would give . Thus, combined with these “Pop II” distance estimators, the SBF data for M31/M32 favor the current SBF calibration from the Key Project Cepheid collections.
In addition, both SBF and SNIa can be calibrated theoretically to obtain independent of the Cepheids. Blakeslee et al. (2001) and Liu et al. (2000) have published SBF calibrations from stellar population modeling. The latter calibration is close to the SBF-II “direct” (spiral bulge) calibration, while the former is similar to the group-based SBF calibration. These model zero points are in principle tied to the solar model, although they depend heavily on the Galactic Pop II distance scale for their stellar evolution prescriptions. From SBF-III, Lauer et al. (1998, transformed to the SBF-II “direct” zero point), and Jensen et al. (2001), we adopt km s-1 as the current best SBF value, internal errors only. Transforming to the Blakeslee et al. (2001) theoretical calibration then gives , while the Liu et al. (2000) calibration gives ; a crude average “theoretical from SBF” is then km sMpc-1 ( errors). Clearly, the theoretical SBF calibration favors the KP Cepheid distance collection over the S&S one. The theoretical calibration for SNIa (Hoeflich & Khokhlov, 1996) gives km sMpc-1, which essentially splits the difference between the two Cepheid collections.
Ultimately, the conflict over the Cepheid distances must be resolved before a definitive result on can be achieved from either SBF or SNIa. Reassuringly, our results clearly indicate that the two methods will converge on a single definitive once this happens.
| Method | S&S | Gibson & Stetson | F00 | Freedman et al. |
|---|---|---|---|---|
| SBF | 77 | 73 | 75 | |
| MLCS | 65 | 77 | 73 | 76 |
| dm15 | 64 | 77 | 72 | 75 |
7 Conclusions
We have presented the first direct galaxy-by-galaxy comparison of a statistically significant sample of SBF and SNIa distances, where the latter have been estimated from both the MLCS and dm15 methods. The relative agreement between the SBF and SNIa distances is excellent. Not only is there no evidence for any scaling error between the two methods, but there is evidence that the small errors predicted by each method are generally accurate, although with occasional outliers likely due to peculiar SNIa whose light curves do not conform to the standard templates.
A systematic offset of 0.23 mag between the absolute SBF and SNIa distance moduli has been traced to the discordant sets of Cepheid distances that have been used for calibrating the methods. In the past, SNIa distances were tied to the Cepheid distances from the S&S collaboration, while the SBF distances were tied to the KP Cepheid distances. When a consistent set of Cepheid calibrating galaxies is used, the distance offset between the two methods vanishes. SBF and SNIa distances therefore give a common tie to the distant Hubble flow, and if placed on the same Cepheid distance scale, the two methods yield the same . At the same time, we note that the details of Cepheid distance determination are complex and that our adopted calibrations of SBF, MLCS, and dm15 may all need to be refined in the future as the Cepheid observations are better understood.
Our results alone cannot resolve the problem between the “long” (S&S) and “short” (KP) Cepheid distances used to calibrate SNIa. However, we have noted that using the “short” Cepheid scale allows SBF distances to M31/M32 to agree with most other distance estimates while using the “long” Cepheid scale would put the SBF distances uncomfortably at odds with them. This favors the KP Cepheid scale (if it is a homogeneous scale), or a value km sMpc-1. In addition, theoretical work on SBF distances also favors the shorter Cepheid scale, while the theoretical SNIa scale falls between the long and short Cepheid scales.
It seems clear that any claims of conflicting values for from SBF and SNIa, or indeed from any two reliable secondary distance estimators, most likely result from a failure to reconcile the calibrators of the two methods rather than from a fundamental problem with either method. The Cepheid distance scale remains uncertain at the mag level. Future work must address the problems presented by the Cepheid calibrators in order to eliminate the remaining disagreement on . Using SBF and SNIa, we can now place our neighbors M31/M32 with an accuracy of 5% in units of the Hubble flow, km s-1, but until we know their distance in units of Mpc we will not be able to place the Hubble flow on a physical scale.
References
- Ajhar et al. (1996) Ajhar, E. A., Grillmair, C. J., Lauer, T. R., Baum, W. A., Faber, S. M., Holtzman, J. A., Lynds, C. R. & O’Neil, E. J. 1996, AJ, 111, 1110
- Ajhar et al. (1997) Ajhar, E. A., Lauer, T. R., Tonry, J. L., Blakeslee, J. P., Dressler, A., Holtzman, J. A. & Postman, M. 1997, AJ, 114, 626
- Arce & Goodman (1999) Arce, H. G. & Goodman, A. A. 1999, ApJ, 512, L135
- Barmby et al. (2001) Barmby, P., Huchra, J. P., & Brodie, J. P. 2001, AJ, in press (astro-ph/0011522)
- Blakeslee et al. (1999) Blakeslee, J. P., Davis, M., Tonry, J. L., Dressler, A., & Ajhar, E. A. 1999, ApJ, 527, L73 (SBF-III)
- Blakeslee et al. (2001) Blakeslee, J. P., Vazdekis, A., & Ajhar, E. A. 2001, MNRAS, 320, 193
- Branch et al. (1993) Branch, D., Fisher, A., & Nugent, P. 1993, AJ, 106, 2383
- Burstein & Heiles (1984) Burstein, D. & Heiles, C. 1984, ApJS, 54, 33
- Carretta et al. (2000) Carretta, E., Gratton, R. G., Clementini, G. & Fusi Pecci, F. 2000, ApJ, 533, 215
- Durrell et al. (2001) Durrell, P. R., Harris, W. E., & Pritchet, C. J. 2001, AJ, in press (astro-ph/0101436)
- Ferrarese et al. (2000) Ferrarese, L. et al. 2000, ApJ, 529, 745
- Fisher et al. (1995) Fisher, K. B., Huchra, J. P., Strauss, M. A., Davis, M., Yahil, A. & Schlegel, D. 1995, ApJS, 100, 69
- Freedman et al. (2001) Freedman, W. L., et al. 2001, ApJ, in press (astro-ph/0012376)
- Fusi Pecci et al. (1996) Fusi Pecci, F., Buonanno, R., Cacciari, C., Corsi, C. E., Djorgovski, S. G., Federici, L., Ferraro, F. R., Parmeggiani, G., & Rich, R. M. 1996, AJ, 112, 1461
- Germany (2001) Germany, L. M. 2001, PhD thesis, Australian National University
- Gibson & Stetson (2001) Gibson, B. K., & Stetson, P. B. 2001, ApJ, in press (astro-ph/0011478)
- Gibson et al. (2000) Gibson, B. K. et al. 2000, ApJ, 529, 723
- Hamuy et al. (1996) Hamuy, M., Phillips, M. M., Suntzeff, N. B., Schommer, R. A., Maza, J. & Aviles, R. 1996, AJ, 112, 2398
- Hoeflich & Khokhlov (1996) Hoeflich, P. & Khokhlov, A. 1996, ApJ, 457, 500
- Holland (1998) Holland, S. 1998, AJ, 115, 1916
- Holtzman et al. (1995a) Holtzman, J. A., Burrows, C. J., Casertano, S., Hester, J. J., Trauger, J. T., Watson, A. M., & Worthey, G. 1995a, PASP, 107, 1065
- Holtzman et al. (1995b) Holtzman, J. A. et al. 1995b, PASP, 107, 156
- Jensen et al. (2001) Jensen, J. B. Tonry, J. L., Thompson, R. I., Ajhar, E. A., Lauer, T. R., Rieke, M. J., Postman, M., & Liu, M. C. 2001, ApJ, in press (astro-ph/0011288)
- Lauer et al. (1998) Lauer, T. R., Tonry, J. L., Postman, M., Ajhar, E. A., & Holtzman, J. A. 1998, ApJ, 499, 577
- Liu et al. (2000) Liu, M. C., Charlot, S., & Graham, J. R. 2000, ApJ, 543, 644
- Parodi et al. (2000) Parodi, B. R., Saha, A., Sandage, A., & Tammann, G. A. 2000, ApJ, 540, 634
- Phillips (1993) Phillips, M. M. 1993, ApJ, 413, L105
- Phillips et al. (1999) Phillips, M. M., Lira, P., Suntzeff, N. B., Schommer, R. A., Hamuy, M., & Maza, J. ; 1999, AJ, 118, 1766
- Pinto & Eastman (2000a) Pinto, P. A. & Eastman, R. G. 2000a, ApJ, 530, 744
- Pinto & Eastman (2000b) Pinto, P. A. & Eastman, R. G. 2000b, ApJ, 530, 757
- Riess et al. (1997) Riess, A. G., Davis, M., Baker, J., & Kirshner, R. P. 1997, ApJ, 488, L1
- Riess et al. (1998) Riess, A. G. et al. 1998, AJ, 116, 1009
- Saha et al. (1999) Saha, A., Sandage, A., Tammann, G. A., Labhardt, L., Macchetto, F. D., & Panagia, N. 1999, ApJ, 522, 802
- Salvo et al. (2001) Salvo, M. E., Cappellaro, E., Mazzali, P. A., Benetti, S., Danziger, I. J., Patat, F., & Turatto, M. 2001, MNRAS, in press (astro-ph/0009065)
- Sandage et al. (1996) Sandage, A., Saha, A., Tammann, G. A., Labhardt, L., Panagia, N., & Macchetto, F. D. 1996, ApJ, 460, L15
- Sandage & Tammann (1995) Sandage, A. & Tammann, G. A. 1995, ApJ, 446, 1
- Schlegel et al. (1998) Schlegel, D. J., Finkbeiner, D. P., & Davis, M. 1998, ApJ, 500, 525 (SFD)
- Secker (1992) Secker, J. 1992, AJ, 104, 1472
- Stanek & Garnavich (1998) Stanek, K. Z. & Garnavich, P. M. 1998, ApJ, 503, L131
- Suntzeff et al. (1999) Suntzeff, N. B. et al. 1999, AJ, 117, 1175
- Tonry et al. (1990) Tonry, J. L., Ajhar, E. A., & Luppino, G. A. 1990, AJ, 100, 1416
- Tonry et al. (1997) Tonry, J. L., Blakeslee, J. P., Ajhar, E. A., & Dressler, A. 1997, ApJ, 475, 399 (SBF-I)
- Tonry et al. (2000) Tonry, J. L., Blakeslee, J. P., Ajhar, E. A., & Dressler, A. 2000, ApJ, 530, 625 (SBF-II)
- Tonry et al. (2001) Tonry, J. L., Dressler, A., Blakeslee, J. P., Ajhar, E. A., Fletcher, A., Luppino, G. A., Metzger, M. R. & Moore, C. B. 2001, ApJ, 546, 681 (SBF-IV)
- Tonry & Schneider (1988) Tonry, J. & Schneider, D. P. 1988, AJ, 96, 807
- Worthey (1993a) Worthey, G. 1993a, ApJ, 409, 530
- Worthey (1993b) Worthey, G. 1993b, ApJ, 418, 947