System parameters of the long-period polar V1309 Ori††thanks: Based partially on observations with the NASA/ESA Hubble Space Telescope obtained at the Space Telescope Science Institute, which is operated by the Association of Universities for Research in Astronomy, Inc., under contract NAS 5-26555
Based on high-resolution optical spectroscopy in the blue and the near infra-red spectral range, we derived velocity images (Doppler tomograms) of the mass-donating secondary star and the accretion stream of the long-period eclipsing polar V1309 Ori (RX J0515.41+0104.6). Combined with HST-spectroscopy of high time resolution and optical photometry we were able to derive the main system parameters and to determine the accretion geometry of the binary. The length of the eclipse of the white dwarf is s, the mass ratio , and the orbital inclination . The surface of the secondary star could be resolved in the Doppler image of NaI absorption lines, where it shows a marked depletion on the X-ray irradiated side. The accretion geometry proposed by us with a nearly aligned rotator, co-latitude , tilted away from the ballistic stream, azimuth , explains the shape of the emission-line Doppler tomograms and the shape of optical/UV eclipse light curves.
Key Words.:
accretion, stars: binaries: eclipsing, stars: individual: V1309 Ori, stars: magnetic fields, stars: novae, cataclysmic variables1 Introduction
| Date | Telescope | Filter | duration of observation | time resolution |
|---|---|---|---|---|
| 1992/10/30 | MLO 1m | V photometry | 4:43 h | 30 s |
| 1992/12/23 | MLO 1m | V photometry | 3:20 h | 31 s |
| 1995/11/24 | DSAZ 3.5m | spectroscopy | 4:56 h | 300 s |
| 1995/11/26 | DSAZ 3.5m | spectroscopy | 3:05 h | 300 s |
| 1995/11/27 | DSAZ 3.5m | spectroscopy | 7:44 h | 300 s |
| 1996/08/11 to 1996/10/26 | HST/FOS | UV spectroscopy | 13 x 12 min | 0.8 s |
| 1999/11/04 | AIP 0.7m | V photometry | 2:21 h | 30 s |
| 1999/11/16 | AIP 0.7m | V photometry | 3:41 h | 30 s |
Polars are cataclysmic variables (CVs), in which both stars rotate synchronized with the orbital period. The strong magnetic field of the white dwarf prevents the formation of an accretion disk. Instead it forces the accreted matter - when the magnetic pressure exceeds the hydrodynamic pressure – to move along the magnetic field lines to one or both magnetic poles (see e.g. Cropper 1990).
V1309 Ori (RX J0515.41+0104.6) was discovered in the ROSAT all-sky survey (Beuermann & Thomas 1993) and optically identified as magnetic cataclysmic variable by Garnavich et al. (1994) and Walter et al. (1995). It is one of the rare systems among the polars, which show a total eclipse of the white dwarf. This gives restrictions which make it much more easy to derive the system parameters from observational data than for most of the other systems.
V1309 Ori has an orbital period of 7.98 h, by far the longest among all known polars. The spectral type of the secondary star is between M0 and M1 (Shafter et al. 1995). A main sequence star of this type has a much smaller radius than the size of the Roche lobe at the given orbital period, i.e. V 1309 Ori is the only known polar with a significantly oversized or possibly evolved secondary.
The magnetic field of the white dwarf could be infered from cyclotron harmonic emission to be 61 MG (Shafter et al. 1995). There was some discussion in the literature, whether with the given field strength of the white dwarf and the long orbital period the system could rotate synchronously. Frank et al. (1995) showed that V1309 Ori can be understood in terms of the standard evolutionary model, if the system either was in an extended low state to bring the white dwarf into synchronism or that the magnetic field of the secondary is strong enough to maintain synchronism.
In the ROSAT light curves large short-term variations of the X-ray flux are seen attributed to the impact of individual blobs of matter on the accretion region (Walter et al. 1995).
Due to its exceptionally long period, V1309 Ori is highly suited for a detailed spectroscopic study involving Doppler tomography. The long orbital period allows phase-resolved spectroscopy with high spectral resolution.
In this paper we present high resolution spectroscopy of V1309 Ori, obtained with the two channel spectrograph TWIN at the 3.5–m telescope of the German–Spanish Astronomical Centre on the Calar Alto in Spain from 1995/11/24 to 1995/11/28. Furthermore we present photometry taken with the 70–cm telescope at the AIP site. We also use V-band photometry published by Shafter et al. (1995) and archived HST UV spectroscopy, which was recently used by Schmidt & Stockman (2001).
From these data we derive the eclipse ephemeris, system parameters – inclination, mass ratio and the primary mass – and investigate the accretion geometry.
2 Observations and reduction
V1309 Ori was observed in 1995 at the 3.5–m telescope at Calar Alto with the double–beam spectrograph TWIN, covering wavelength ranges from approx. 4200 Å to 5050 Å and from 7550 Å to 8700 Å. The spectral resolution of this data is 2.3 Å ( 84 km s-1 at 8183 Å) in the red channel and 1.8 Å ( 115 km s-1 at 4686 Å) in the blue one.
Flat fields, comparison lamp spectra and bias frames were taken regularly.
For photometric calibration we took spectra of spectrophotometric standard stars. Seeing and transparency were variable during our observations, the photometric calibration of the spectra is supposed to have an uncertainty of up to a factor 2.
To avoid the long readout times of the CCDs, we put six – in slit direction shifted – single spectra onto the chips before reading out. This caused the night sky lines to be very bright in each spectrum, producing large errors at the corresponding wavelengths.
By taking the data of all three nights, full phase coverage is achieved with a phase resolution of 0.0125 (80 phase bins per orbital cycle). V1309 Ori could be observed for 6.5 hours subsequently from Calar Alto. At the epoch of our observation, eclipses happened just before and just after the phase of visibility, hence, eclipse phase is poorly covered by our spectroscopic observations.
Photometric data in the V-band were obtained by observations at the 70–cm telescope at the AIP in November 1999. The observations with a time resolution of 30 s cover two eclipses. These data were calibrated with bias, flat field and photometric standard star exposures.
In addition we used an archived HST/FOS observation, which was previously published by Schmidt & Stockman (2001). This is time resolved spectroscopy in the UV with a time resolution of 0.8 s. V1309 Ori was observed 13 times for approx. 12 min., including one ingress and four egresses of the eclipse. By phase–folding the data it is possible to create a composite eclipse light curve, covering the phase interval from approx. -0.1 to 0.1.
All observations used in this paper are listed in Table 1.
3 Results and analysis
3.1 Determination of the ephemeris from photometric data (optical & UV)
The knowledge of an accurate value of the binary period and of the inferior conjunction of the secondary star is a necessary prerequisite for any further modeling of the system.
The long-term baseline for the determination of the period comes from the combination of our own photometry with published photometry from Shafter et al. (1995) and an archival HST observation.
The times of mid-eclipse of the new data were determined using the same approach as Shafter et al. (1995). Straight lines were fitted to the ingress and egress parts of the light curves. The time of mid-eclipse was taken as the centre of the line drawn at half-ingress intensity between the two fitted lines.
| Date | Cycle | time of mid-eclipse | Error | Filter |
|---|---|---|---|---|
| 1992/10/30 | 2448925.8348 | 30 s | V | |
| 1992/12/23 | 2448979.7193 | 30 s | V | |
| 1996/09/13 | 0 | 2450339.43652 | 15 s | UV |
| 1999/11/04 | 3449 | 2451486.6147 | 30 s | V |
| 1999/11/16 | 3485 | 2451498.5890 | 30 s | V |
By fitting a straight line to these times as a function of cycle number, the new photometric ephemeris was derived as
| (1) |
The numbers in brackets are the errors of the last digits.
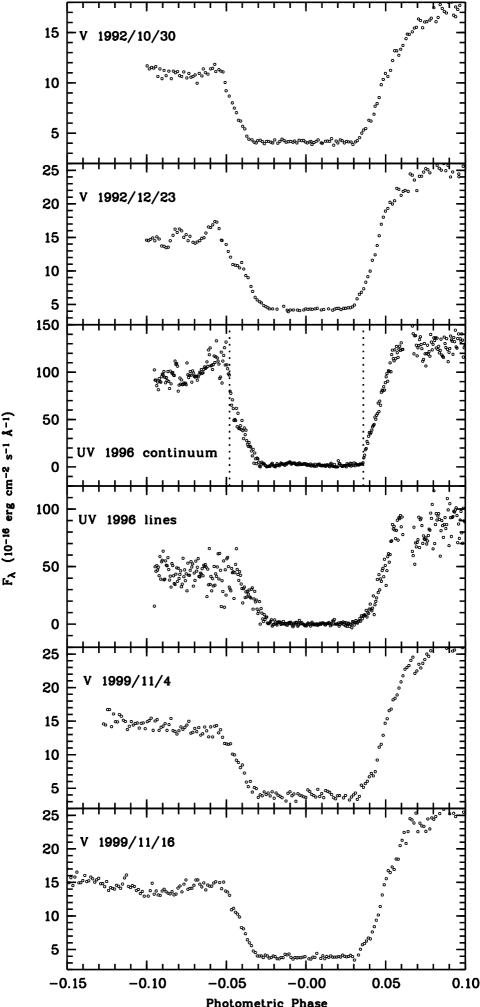
The eclipse data used is shown in Fig. 1. The phase for all data was calculated according to the ephemeris of Eq. (1). The UV continuum light curve was achieved by averaging the wavelength intervals Å, Å, Å, and Å. For comparison purposes the UV line light curve, obtained by summing up the intervals Å, Å, and Å and subtracting the interpolated continuum flux, is also shown.
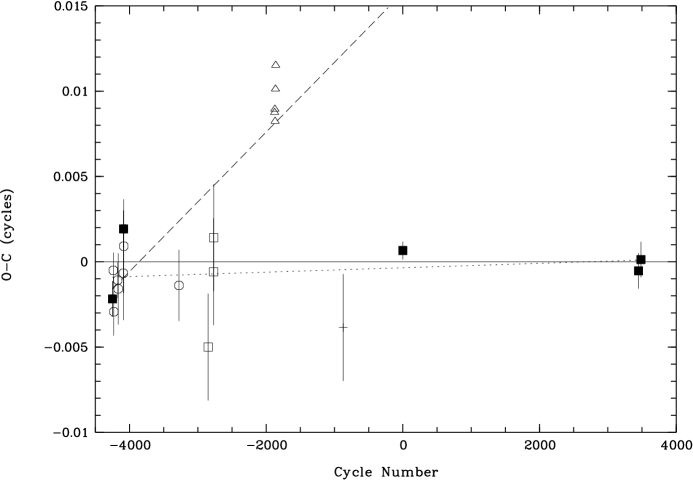
The deviations of the observed eclipse times from the calculated ones are shown in Fig. 2.
As one can see, the orbital period from Eq. (1) is quite similar to the one of Shafter et al. (1995). Our time base, however, is much larger than the one used there, making our period determination much more accurate.
The ephemeris from Buckley & Shafter (1995) (indicated by the dashed line in Fig. 2) predicts incorrect eclipse times for observations after 1995.
Our spectroscopic observations allow us to determine a single value for the inferior conjunction from the radial velocity of photospheric absorption lines. It is marked with a cross in Fig. 2 and is consistent with the determined period.
The photometry presented by Shafter et al. (1995) showed the eclipse length to be highly variable, which means that not the white dwarf itself but the accretion stream contributes most to the observed flux.
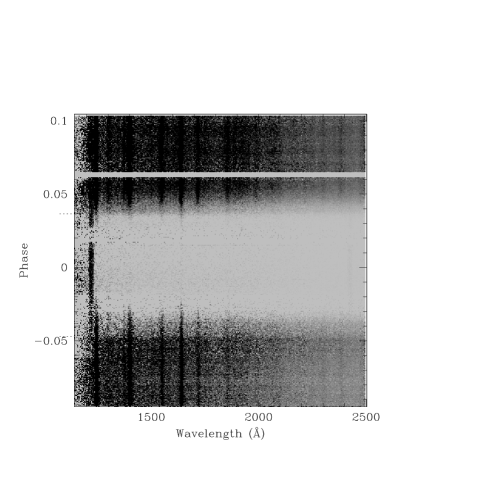
The only data set, which allows us to identify the eclipse of the white dwarf, is the HST observation, which we show as a trailed spectrogram in Fig. 3. A UV continuum light curve based on these observations is shown in Fig. 1 (time resolution: 15 s). The data suggest that (1) the initial steep decline at phase –0.048 is caused by the eclipse of the white dwarf, and (2) that the eclipse egress of the white dwarf marks the end of the phase of totality (phase 0.036).
The analysis by Schmidt & Stockman (2001) confirms this conclusion, but they claim the detection of a steep decline of length s, which they attribute to the eclipse of a small hot ( K) spot. Our analysis does not reproduce their results, we see the decline not only in the far UV but also in the near UV. We, therefore, attribute the decline to the eclipse of the whole white dwarf and consequently derive a much lower temperature for the structure which is eclipsed. Remaining line and continuum emission seen while the white dwarf is in eclipse, , indicates that the accretion stream is not completely obscured during this phase interval.
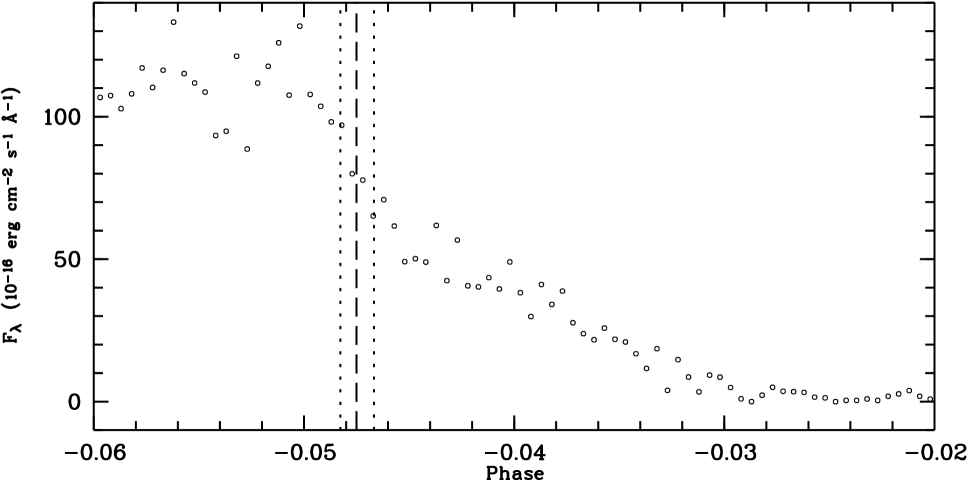
The ingress of the white dwarf eclipse lasts s (see Fig. 4), which is near the expected value of 71 s, if we calculate it with the system parameters derived in chapter 3.3 and the mass-radius-relation for white dwarfs from Nauenberg (1972).
An eclipse duration of the white dwarf of 2418 60 s was determined ( 0.084 phase units). Figs. 3 and 1 show, that there is already some line emission 0.005 phases ( 2 min) before the egress of the continuum light source.
Eclipse ingress and egress of the white dwarf cannot be resolved in broad band optical photometry. This is due to the relative faintness of the white dwarf in that band – in Sect. 3.5 we estimate its contribution to only about 10% of the eclipse flux – and the rather poor time resolution of these observations of only 30 sec.
As one can see in the UV continuum light curve in Fig. 1, the center of the eclipse of the white dwarf is not at phase zero, but approx. 0.006 phase units earlier. For conversion from photometric ephemeris to mid-eclipse of the white dwarf one has to subtract 172 ( 20) s from the time of mid-eclipse, so that the ephemeris of the white dwarf’s superior conjunction is
| (2) |
3.2 High resolution spectroscopy

A phase-binned trailed spectrum of the blue channel is reproduced in Fig. 5. It is clearly seen that the emission lines have different line shapes and intensities at different phases. It is possible to identify several components in the emission line. One can see that in the emission lines (e.g. He ii 4686 and H in Fig. 9) a narrow emission line component (NEL), nearly following a sine curve, and some more diffuse emission is existent. The NEL is supposed to originate from the irradiated hemisphere of the secondary star (see e.g. Schwope et al. 1997), while the other emission is likely to be originating in the accretion stream.
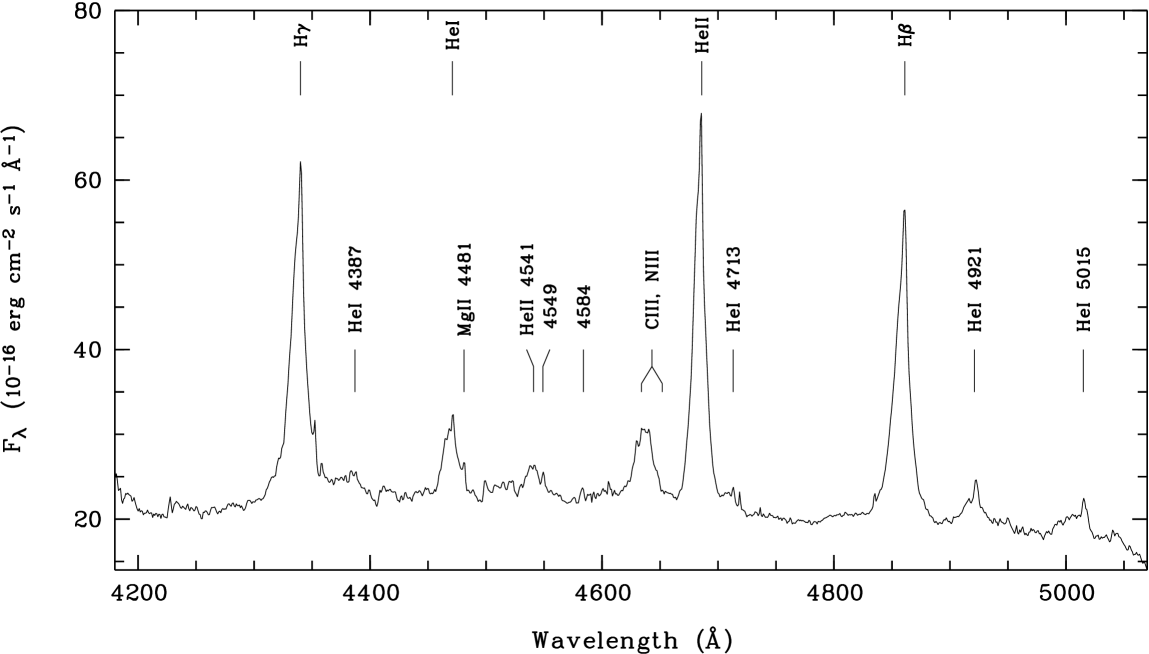
In Fig. 6 we show the mean-orbital radial-velocity-corrected spectrum of V1309 Ori in the blue channel of the TWIN. For radial velocity correction we used a sine-fit to the NEL of He ii 4686.
In this spectrum several lines could be identified: the Balmer lines H and H, the lines of neutral (4387, 4471, 4713, 4921 and 5015 Å) and ionized (4541 and 4686 Å) helium, the line of Mg ii 4481, the CIII/NIII-complex at 4635-4650 Å and two unidentified lines at 4549 and 4584 Å. These unidentified lines are interesting, because in the trailed spectrogram (Fig. 5) they show only the NEL component.
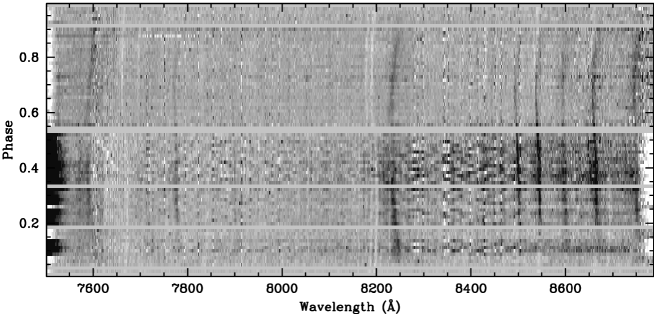
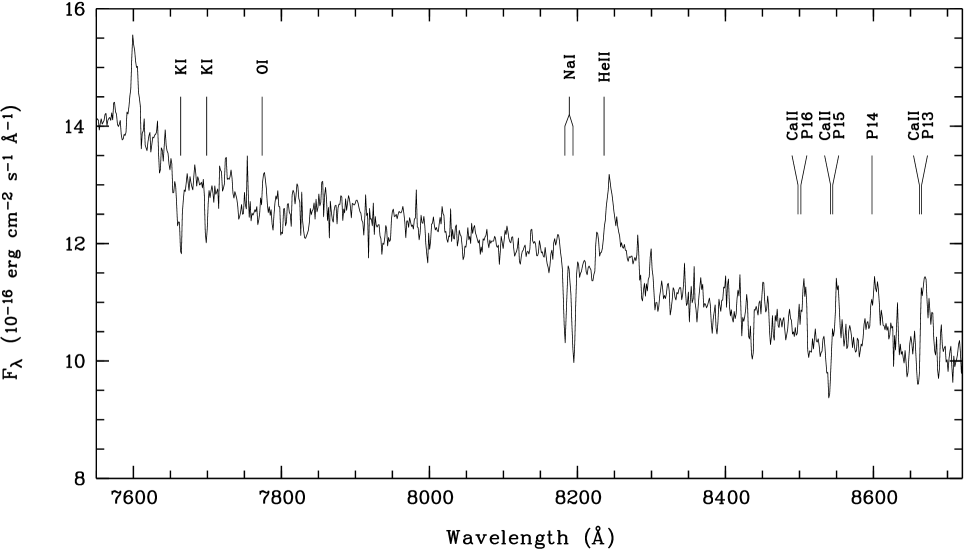
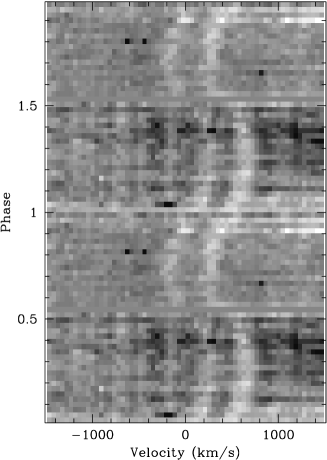
Fig. 7 shows the phase-binned trailed spectrogram in the red channel. Some absorption and emission lines are evident while moving back and forth in wavelength. The area around the NaI doublet at 8183/94 Å is magnified in Fig. 9.
The spectrum shown in Fig. 8 was achieved by averaging the velocity-corrected (with a sine-fit to the NaI-lines) red spectra in the phase interval from 0.7 to 1.0.
Several absorption lines (Na i 8183/8194, K i 7664 and K i 7699) and emission lines (He ii 8236, O i 7775 and the blend of CaII and Paschen lines above 8400 Å) could be identified.

For further analysis it was necessary to determine the system velocity and to remove it from the radial velocity curves and trailed spectra. This was done by fitting two gaussians with fixed separation and same intensity to the NaI lines in each of 40 phase-binned spectra.
By fitting a sine-curve to the centres of the gaussians as a function of the orbital phase, a system velocity of 8(6) km s-1 was determined. With the baryocentric velocity correction of another 8 km s-1 the (low) system velocity with respect to Earth of km s-1 follows. The value of 8 km s-1 was used to correct the observed spectrograms before tomographic analysis.
3.3 The system parameters of V1309 Ori
In this section we make use of the HST eclipse observation and radial velocity measurements of the secondary star in order to determine the orbital inclination , the mass ratio , and the mass of the white dwarf .
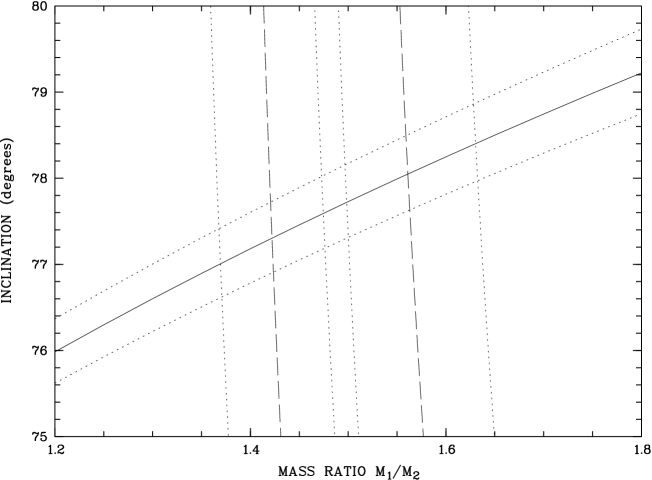
As described in Sect. 3.1, the observed eclipse length of the white dwarf in the ultraviolet spectral range is sec. For further analysis we assume, that the secondary star fills its Roche volume and that the white dwarf may be approximated as a point source. Then, according to Chanan et al. (1976), a purely geometrically determined relation between , , and exists, which is shown in Fig. 10.
The parameters and can further be constrained, if the orbital velocity of the secondary star is known. Our spectroscopic data allow an indirect measurement of this quantity by observations of emission and absorption lines originating on the secondary star. According to their phasing and their photometric variation, the prominent narrow emission lines (NEL) must originate on the X-ray irradiated side of the secondary star. In principle, its radial velocity variation gives clues to the orbital velocity of the secondary. The determination of the radial velocity amplitude is, due to severe line blending with components originating from the accretion stream, not done straight forwardedly. Recent experience gained from a study of another long-period polar, QQ Vul (Schwope et al. 2000), revealed Doppler tomography as appropriate tool to determine the NEL radial velocity.
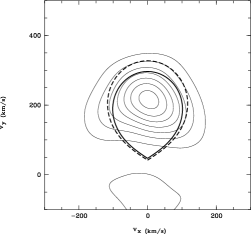
Doppler maps using Spruit’s (1998) MEM code were computed for the principal emission lines H, H, and He ii 4686. The Doppler map of He ii 4686 is reproduced as contour plot in Fig. 11. The radial velocity was determined from Gaussian fits to an average profile along the -axis. All NEL-velocities agreed within km s-1, suggesting a common location of emission. The velocity amplitude used for further analysis is km s-1.
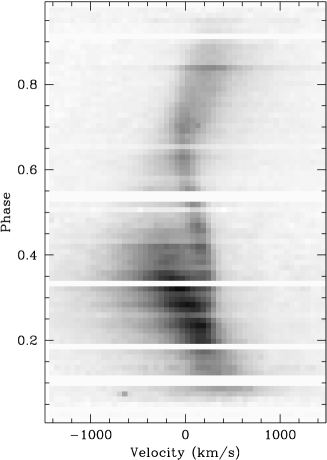
Also, the radial velocity variation of the Na-absorption lines can be used to constrain the orbital velocity of the secondary star. The trailed spectrogram of Fig. 9 immediately shows that the Na-lines have a much larger radial velocity amplitude than the narrow emission lines, that the radial velocity curve deviates from a sinusoid, and that the lines almost disappear at phase , when the irradiated side of that star is best visible. Altogether this means that the line formation and the radial velocity curve is strongly influenced by irradiation from the accretion region on the white dwarf. This becomes obvious from a Doppler map of the line doublet also shown in Fig. 11. The region near the inner Lagrangian point is completely devoid of Na-line absorption.
Radial velocities of Na-lines in individual spectra were measured by fitting a double Gaussian. The radial velocity amplitude of the lines were determined by fitting circular and elliptical orbit equations to the measured phase-dependent velocities, we consistently arrived at km s-1.
Using the measurements of the radial velocity amplitudes of the photocenters and of the irradiated and non-irradiated hemispheres of the secondary, the orbital velocity can be calculated with an irradiation model. The details of the model were described just recently by Schwope et al. (2000) and need not be repeated here. It assumes that emission lines are formed at the irradiated part of the secondary’s Roche surface and absorption lines only on the complementary region. For given period, inclination, mass ratio and mass of the secondary factors for correction from centre of mass to centre of light result.
The correction factor for the velocities of the photocenters of the non-irradiated hemisphere to the center of mass, , is only slightly dependent on the mass ratio. It ranges from 1.13 for to 1.18 for . Hence, with the observed radial velocity amplitude of the Na-lines and the maximum correction factor the lowest orbital velocity of the secondary star is km s-1. The resolution of the Doppler map of the Na-lines is not sufficiently high in order to decide whether the irradiated part of the secondary is at least partially visible in the Na-lines. We, therefore, allow also for a smaller correction factor . Our accepted range for the orbital velocity thus becomes km s-1.
In order to determine the mass of the secondary star in polars, one usually assumes that it is a main-sequence star. The size of the Roche-lobe is fixed for a given binary period. The mass of the secondary star can then be determined with the aid of a mass-radius relation for main-sequence stars. As pointed out by Garnavich et al. (1994) and Shafter et al. (1995), the secondary is of spectral type M0–M1 and, hence, much less massive then a main-sequence star which fits in a Roche lobe at 8 hours orbital period (which would have about 1 M⊙). The secondary star must have a mass as low as 0.6 M⊙ or less. Assuming M⊙, Kepler’s third law gives , and M⊙ for the allowed range of . If we assume M⊙, we get , and M⊙.
We also computed a grid of models for the NEL originating on the irradiated hemisphere of the secondary star as a function of , , and . The results are shown as iso-velocity lines for km s-1 for M⊙ and 0.6 M⊙, respectively, in Fig. 10. These lines cross the lines defined by the eclipse length almost orthogonally and give narrow constraints to the mass ratio and inclination. The accepted ranges are , , M⊙, and M⊙. The outlines of the Roche lobes for two combinations (the ones defined by the intersections of the dashed lines with the solid one in Fig. 10) are plotted over the tomograms of sodium and He ii 4686. The areas of origin of the spectral lines lie well within the Roche lobes. In principle, the size of the Roche lobe (i.e. ) is determined by the ratio . A corresponding graph for vs. is shown in Schwope et al. (2000, Fig. 10). Our measured ratio predicts a mass ratio , at the edge of the range given above. We, therefore, tend to accept a solution with a larger mass ratio and a smaller secondary mass. For further modelling the combination , M⊙ was used.
3.4 Distance estimation
The observed V-band flux of V1309 Ori during the eclipse is 1745(10) (AIP, 1999/11/16) (in full agreement with in Shafter et al. 1995). We use YY Gem (A) as reference M0.5-star for an estimation of the distance. In Chabrier & Baraffe (1995) the absolute V-band brightness, the distance and the radius of this star are listed (, R⊙, pc).
Warner (1995) gives a formula for the Roche lobe equatorial radius (in the orbital plane) as a function of the mass ratio and the binary separtion . For the most likely values in our parameter determination, and m (for ), we calculate m. This radius is 12% larger than the one of YY Gem (A) (m), which supports the supposition of a larger radius of the secondary in V1309 Ori than of a main sequence star with the same mass. Both stars have the same spectral type, i.e. same surface brightness. Scaling the flux of YY Gem (A) to the larger area of V1309 Ori, one gets an absolute brightness of . The distance modulus then gives a reasonably good estimate of the true distance of pc. The error includes the uncertainties of the mass ratio and of the secondary mass.
Our distance determination has to be compared to those in the literature. Shafter et al. (1995), by using the same method, arrive at the same distance ( pc) as we do. They claimed their distance to be a lower limit due to a possible contamination by the white dwarf and the accretion stream during eclipse. The HST-spectroscopy shows, that the eclipse of stream and white dwarf are total so that the distance of 550 pc can be regarded as an exact value.
Harrop-Allin et al. (1997) derive a much larger distance of pc from K-band spectroscopy. This estimate is based on the non-detection of certain M-star features in a single spectrum which they interpret as due to the faintness of the secondary. However, their spectrum was taken during orbital phase 0.43 to 0.56, i.e. at phases where irradiation fundamentally changes the spectrum of the secondary as is evident from our phase-resolved NaI-spectroscopy. Hence, their estimate is not reliable.
A value of pc, derived from the TiO-band strength, is given by Beuermann (1999). We cannot comment on the likely reason for the discrepant distance determinations, a possible cause might be non-solar abundances in the secondary’s atmosphere. For further analysis we use pc.
3.5 Temperature of the white dwarf
Based on our determinations of the mass and the distance we can estimate the temperature of the white dwarf from HST-spectroscopy. Due to low signal-to-noise in the individual HST-spectra it is difficult to extract a meaningful spectrum of the white dwarf from the data at ingress and egress phase. Instead we used the average flux in the line-free spectral interval between 1430 Å and 1500 Å and compare it with model atmosphere spectra for pure hydrogen atmospheres kindly provided by B. Gänsicke (Göttingen). The brightness steps at ingress and egress are not equal, that at eclipse egress is smaller. Whether the combined emission from the undisturbed white dwarf and a hotter accretion spot or an accretion flare right at eclipse ingress are responsible for this difference cannot be answered with the present data due to the limited number of photons and due to the fact that this binary phase was covered only once with HST. In order to arrive at an upper limit for the white dwarfs temperature we take the flux difference at eclipse egress, which is erg cm-2 s-1 Å-1. Using cm for an 0.8 M⊙ white dwarf, which corresponds to the white dwarf with the smallest surface within the derived mass range, and pc we estimate K.
Schmidt & Stockman (2001) derived a lower limit of the white dwarf’s temperature of 30,000 K. However, they made not clear how their value was derived. The reason for the differing results therefore cannot be identified.
With our parameters the contribution of the white dwarf to the V-band is less than erg cm-2 s-1 Å-1, which is less than 10% of the eclipse flux.
3.6 The accretion geometry
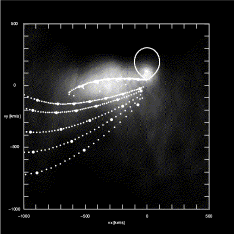
Clues to the accretion geometry can be derived from both photometric and spectroscopic data. In particular we make use of Doppler images of the main emission lines and the contact phases of certain features in emission line and continuum light curves.
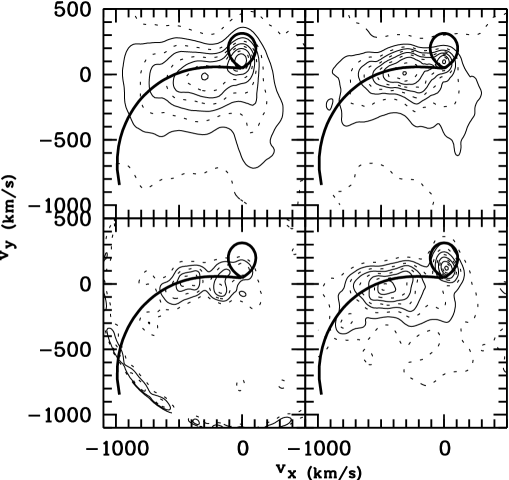
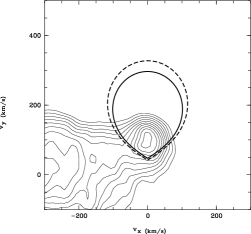
In Fig. 12 we show Doppler images of H, He ii 8236, He ii 4686 and He i 4471. The velocity resolution of the maps is of order 120 km s-1 within a radius of 500 km s-1around the origin. That the features in the tomogram of H appear broader than the ones in the case of He ii 4686 could be caused by blending with He ii 4339. All lines, except He ii 8236, clearly show the NEL from the irradiated hemisphere of the secondary. Beside the NEL, emission from the accretion stream can be recognized in the left and lower quadrants of the Doppler maps. The overlays show the size of the Roche lobe for our favourite parameter combination (Sect. 3.3) and the expected location of the ballistic accretion stream.
In all of our maps emission near the ballistic trajectory is visible. In He ii 8236 we find emission only in the vicinity of the ballistic stream. It is possible that the deviation of this tomogram from that of He ii 4686 is caused by the smaller signal-to-noise ratio. But in each of the other tomograms there is emission off the ballistic trajectory, which can only be due to emission from the magnetic stream. However, ballistic and magnetic stream do not appear as separate structures in the map. It is, therefore, not easy to determine a terminal velocity of the ballistic stream. We regard the spot of enhanced emission at km s-1 as the likely region where most of the matter couples onto magnetic field lines.
Our tomograms are very similar to the ones of H and He ii 4686 presented by Hoard (1999), where strong emission from the ballistic stream is seen. The only major difference is the claimed absence of the NEL in He ii 4686, which is clearly present in our data. Possible explanations are the higher resolution of our data or a higher accretion state of the system during our observations, which caused a stronger irradiation of the secondary’s surface.
Although not identified as separate structure in the maps, some constraints on emission from the magnetic stream can be set. Firstly, emission is spread over a very extended region in Doppler coordinates indicating some kind of accretion curtain to be existent. Secondly, the bulk of emission is concentrated above a line km s-1, which constrains the orientation of the velocity vectors along the accretion curtain. The maps differ in this respect clearly from those of e.g. HU Aqr, UZ For, and QQ Vul, which all show the magnetic stream to be bright in the lower left quadrant (Schwope 2001). These three rather well studied systems all have a ’standard’ orientation of the magnetic field, i.e. the magnetic axis is inclined towards the ballistic stream. The discrepant appearance of the Doppler maps of V1309 Ori indicates a non-standard orientation of the magnetic axis.
The HST-based emission line light curve shows stream emission up to phase , i.e. phase units after the white dwarf is eclipsed by the secondary. Also, egress of the emission lines is observed prior to egress of the white dwarf by phase units. Any model of the stream geometry has to account for this extended visibility.
The optical and band light (see Shafter et al. 1995) curves did not resolve eclipse ingress and egress of the white dwarf. Outside eclipse they are double humped with a primary maximum at binary phase 0.25. Around eclipse they show extended ingress and egress phases due to the eclipse of the accretion stream (or accretion streams). The start phase of totality varies between . The stellar photospheres of the white dwarf primary and the red secondary make small contributions to the light curves only, i.e. these bandpasses are completely dominated by the accretion stream. At the given inclination and the extent of the ballistic stream, eclipse egress of the ballistic stream starts only at phase , when about 75% of the total light from the stream is visible again after eclipse. We conclude, that the fraction of light originating from the magnetic stream/accretion curtain is about 75%, that from the ballistic stream only about 25%. The pronounced orbital variability finds an explanation in projection of an optically thick accretion stream/accretion curtain along the line of sight. Different height of the primary and secondary maxima in the broad-band light curves (e.g. at phase and at phase on December 22nd, 1992) are explained by strong irradiation from the white dwarf. Obviously, the maximum projected area of the irradiated part of the stream/curtain is seen around phase 0.25.
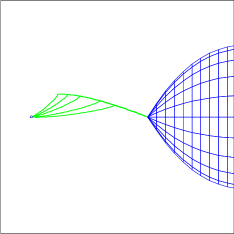
We developed a 3D model of the binary which predicts for a given set of binary parameters (), for an assumed accretion geometry and for an assumed magnetic field strength the location of ballistic trajectories in spatial and Doppler coordinates, schematic Doppler tomograms, and light curves. For the generation of the light curves we assumed constant emissivity along the stream between and the white dwarf. Hence, we cannot expect a proper fit to oberved data, but reproduce observed contact phases.
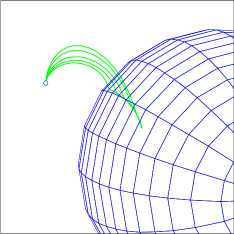
With this model we interactively explored almost the whole parameter space within the limits on () derived above. We assumed a dipolar magnetic field, it’s orientation is described by the colatitude with respect to the rotation axis and the azimuth (or longitude) with respect to the line joining both stars. The quadrant between and contains the ballistic stream. A satisfactory qualitative fit to the spectroscopic and photometric features described above was reached for , , i.e. with a nearly aligned dipole tilted away from the ballistic stream. Such a geometry in spatial and Doppler coordinates is reproduced in Fig. 13.
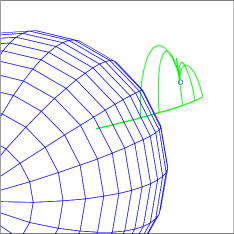
Using these parameters we reach qualitative agreement between the observed contact phases in broad-band and emission line light curves, of the phasing of maxima in broad-band light curves, of the location of the stagnation region at the terminal end of the ballistic stream in spatial and Doppler coordinates and of the close vicinity of the magnetic and ballistic stream in Doppler coordinates.
The predicted location of the accretion spot, which is offset from the magnetic axis, is at stellar colatitude 17° and at azimuth of °. With this location of the spot we predict a maximum in the soft X-ray light curve (which is not yet observed) at binary phase . In the case of a pointlike accretion spot, a self-eclipse would be observed around phase . If the accretion region is significantly extended on the surface of the white dwarf or in height, it will only be partially eclipsed.
4 Discussion and conclusions
The main results of our photometric and spectroscopic study with full phase coverage, paying particular attention to the eclipse properties is a re-determination of the system parameters of the binary. These are listed in Table 3.
| Parameter | Value |
|---|---|
| d | |
| s | |
| M⊙ | |
| M⊙ | |
| km s-1 | |
| km s-1 | |
| K | |
| pc | |
| ° | |
| ° |
The orbital period derived here from broad band photometry has much higher accuracy than previously, since a larger time base could be used by us compared to others. We found no evidence for an asynchronous rotation of the white dwarf. The time difference between the centre of eclipse of the white dwarf and of the accretion stream could be determined for one epoch by making use of an archival HST-observation to be 172 ( 20) s.
A more accurate determination of the eclipse timings and of the eclipse duration of the accretion spot can probably obtained from upcoming XMM-observations. Based on our geometrical model we predict no self-eclipse of the accretion region. We found no evidence of a second accretion region to be present but cannot certainly exclude its presence.
Based on the measured velocities of the irradiated front- and non-irradiated back-side of the secondary star, we could narrow the possible range of masses of the secondary to M⊙. This is the first dynamic mass determination of the secondary in V1309 Ori and confirms or even lowers previous mass estimates based on the spectral type. The secondary could be resolved in the Doppler image of Na absorption lines, where it shows a marked depletion on the irradiated side.
Doppler maps of the emission lines are clearly different to those found in the literature for other eclipsing polars (HU Aqr, UZ For). We could explain these differences with an extreme orientation of the magnetic axis pointing away from the ballistic stream.
Acknowledgements.
We thank B. Gänsicke (Göttingen) for his grid of white dwarf model atmospheric spectra. Furthermore, we thank our referee, P. Szkody, for useful comments which helped to improve the paper. This work was supported by the DLR under grant 50 OR 9706 8 and the DFG under grant Schw 536/6–1.References
- (1) Beuermann, K. 2000, NewAR, 44, 93
- (2) Beuermann, K., Thomas, H.-C. 1993, Adv. Sp. Res. 13, (12)115
- (3) Buckley, D. A. H., Shafter, A. W. 1995, MNRAS, 275, L61
- (4) Catalán, M. S., Schwope, A. D., Smith, R. D. 1998, MNRAS 310, 123
- (5) Chabrier, G., Baraffe, I. 1995, ApJ, 451, L29
- (6) Chanan, G. A., Middleditch, J., Nelson, J. E. 1976, ApJ 208, 512
- (7) Cropper, M. 1990, Space Science Reviews, 54, 195
- (8) de Martino, D., Barcaroli, R., Matt, G., et al.: 1998, A&A, 332, 904
- (9) Garnavich, P. M., Szkody, P., Robb, R. M., Zurek, D. R., Hoard, D. W. 1994, ApJ, 435, L141
- (10) Harrop-Allin, M. K., Cropper, M., Potter, S.B., Dhillon, V. S., Howell, S. B. 1997, MNRAS 288, 1033
- (11) Hoard, D. W. 1999, In: “Annapolis workshop on magnetic cataclysmic binaries”, eds. C. Hellier & K. Mukai, ASP Conf. Ser. 157, p71
- (12) Nauenberg, M. 1972, ApJ, 443, 319
- (13) Schmidt, G. D., Stockman, H. S. 2001, ApJ 548, 410
- (14) Schwarz, R., Schwope, A. D., Beuermann, K., et al.: 1998, A&A 338, 465
- (15) Schwope, A. D., 2001, Lecture Notes in Physics, in press
- (16) Schwope, A. D., Mantel, K.-H., Horne, K. 1997, A&A 319, 894
- (17) Schwope, A. D., Schwarz, R., Staude, A., et al. 1999, In: “Annapolis workshop on magnetic cataclysmic binaries”, eds. C. Hellier & K. Mukai, ASP Conf. Ser. 157, p71
- (18) Schwope, A. D., Catalán, M.S., Beuermann, K., 2000, MNRAS 313, 533
- (19) Shafter, A. W., Reinsch, K., Beuermann, 1995, ApJ, 443, 319
- (20) Spruit, H.C., 1998, astro-ph/9806141
- (21) Walter, F. M., Wolk, S. J., Adams, N. R. 1995, ApJ, 440, 834
- (22) Warner, B. 1995, “Cataclysmic Variable Stars”, Cambridge University Press