High Resolution Spectra of Quasar AALs: 3C 191
Abstract
We discuss new high-resolution (6.7 km/s) spectra of the associated absorption lines (AALs) in the radio-loud quasar 3C 191. The measured AALs have ionizations ranging from Mg I to N V, and multi-component profiles that are blueshifted by 400 to 1400 km/s relative to the quasar’s broad emission lines. Excited-state absorption lines of Si II∗ and C II∗ imply volume densities of 300 cm-3 and a nominal distance from the quasar of 28 kpc (assuming photoionization). The total column density is cm-2. Surprisingly, the absorber only partially covers the quasar emission source along our line of sight. We propose a model for the absorber in which pockets of dense neutral gas are surrounded by bigger clouds of generally lower density and higher ionization. This outflowing material might be leftover from a blowout associated with a nuclear starburst, the onset of quasar activity, or a past broad absorption line (BAL) wind phase.
Department of Astronomy, University of Florida, 211 Bryant Space Science Center, Gainesville, FL 32611-2055
Infrared Processing and Analysis Center, California Institute of Technology, MS 100-22, 770 South Wilson Ave., Pasadena, CA 91125
California Association for Research in Astronomy, W.H. Keck Observatory, 65-1120 Mamalahoa Highway, Kamuela, HI 96734
MMT Observatory, University of Arizona, 933 North Cherry Ave., Tucson, AZ 85721-0065
Observatories of the Carnegie Institution of Washington, 813 Santa Barbara Street, Pasadena, CA 91101-1292
1. Introduction
Associated absorption lines (AALs) are important diagnostics of the gaseous environments of quasars and active galactic nuclei (AGNs). In particular, the lines can trace a variety of phenomena — from energetic outflows like the BALs to relatively quiescent gas at large galactic or inter-galactic distances (Weymann et al. 1979, Hamann & Brandt 2001). We are involved in a multi-wavelength program to locate individual AAL absorbers, determine their elemental abundances, quantify their kinematic and physical properties, and understand the role of the AGNs and/or host galaxies in providing the source of material and kinetic energy to the absorbing gas.
One interesting property is that, among radio-loud quasars, AALs appear more frequently and with greater strength in sources with “steep” radio spectra and/or lobe-dominated radio morphologies (Wills et al. 1995, Richards 2001, Brotherton et al. 1998). 3C 191 (Q0802+103, emission-line redshift ) is a radio-loud quasar having both strong AALs and a bipolar, lobe-dominated radio structure. It provides a rare opportunity to define the distance between the quasar and the absorbing gas because its AALs include excited-state lines, e.g. C II∗ 1336 and Si II∗ 1265,1533, which constrain the volume density and therefore the quasar–absorber distance (assuming photoionization, Bahcall et al. 1967).


2. Observations and Results
We observed 3C 191 on three occasions between 1997 and 1998 using the High Resolution Echelle Spectrograph (HIRES) on the Keck I telescope on Mauna Kea, Hawaii. On each occasion, a 0.86′′ slit provided spectral resolution or 6.7 km s-1, corresponding to 3 pixels on the 20482 Tektronix CCD. We reduced the data with standard techniques using the MAKEE software package. The spectra cover the observed wavelengths 3850 – 5975 Å and 6474 – 8927 Å.
The measured AALs have ionizations ranging from Mg I to N V, and multi-component profiles that are blueshifted by 400 to 1400 km/s relative to the quasar’s broad emission lines (see Figures 1–3). These data yield the following new results. (1) The strengths of excited-state Si II∗ AALs indicate a density of 300 cm-3 in the Si+ gas. (2) If the gas is photoionized, this density implies a distance of 28 kpc from the quasar. Several arguments suggest that all of the lines form at approximately this distance, with a range of densities determining the range of ionizations. (3) Strong Mg I AALs identify neutral gas with very low ionization parameter and high density. We estimate cm-3 in this region, compared to only 15 cm-3 where the N V lines form. (4) The total column density is cm-2 in the neutral gas and cm-2 in the moderately ionized regions (up to Al III, Si IV, etc.). There may be larger column densities in more highly ionized gas, however, the total column of cm-2 is consistent with 3C 191’s strong soft X-ray flux and the implied absence of soft X-ray absorption. (5) The total mass in the AAL outflow is M⊙, assuming a global covering factor (as viewed from the quasar) of 10% . (6) The absorbing gas only partially covers the background light source(s) along our line(s) of sight, requiring absorption in small clouds or filaments 0.01 pc across. The ratio implies that the clouds have radial (line-of-sight) thicknesses 0.2 pc. (7) The characteristic flow time of the absorbing gas away from the quasar is yr.
3. Discussion
The physical connection between the quasar 3C 191 and its AALs is established by the excited-state lines (Si II∗). However, the absorber–quasar distance is very large, 28 kpc. Other quasar AALs are known to form much closer to the central engines, possibly within a few pc in outflows similar to the BALs (Hamann et al. 1997, Barlow & Sargent 1997, Barlow, Hamann & Sargent 1997). 3C 191 might contain a different class of absorber (e.g. much farther from the active nucleus) than the majority of AGNs discussed at this meeting. In particular, 3C 191 does not follow the trend identified by Brandt et al (2000) for small X-ray to UV continuum flux ratios () accompanying large C IV absorption equivalent widths. The outflowing material in 3C 191 might be leftover from a blowout associated with a nuclear starburst, the onset of quasar activity, or a past broad absorption line (BAL) wind phase. The flow time of yr might therefore represent the time elapsed since the formation of the quasar and/or an accompanying starburst episode.
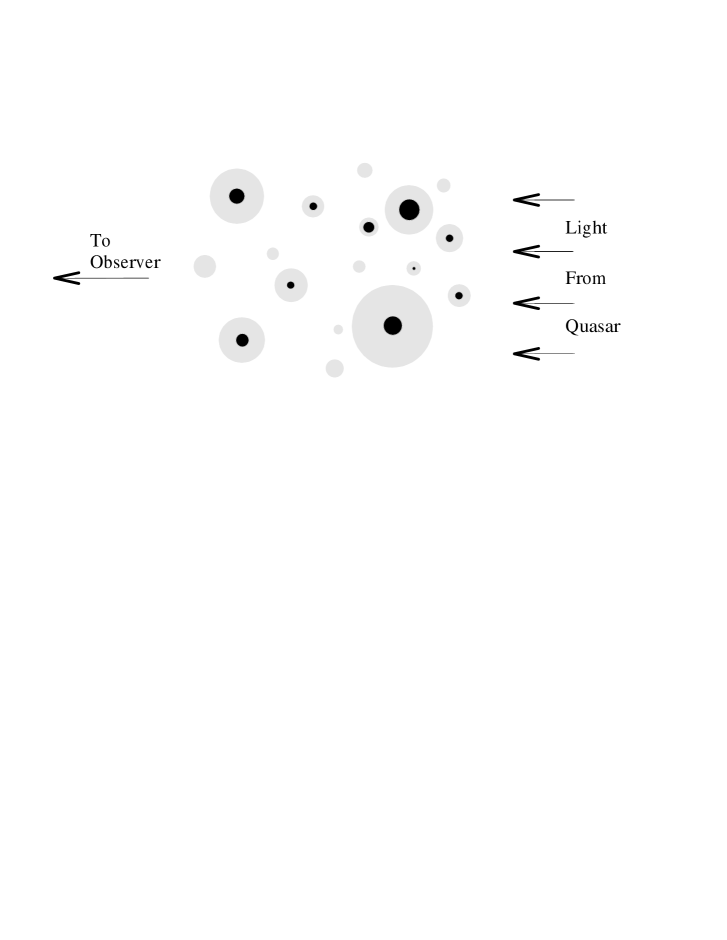
We propose a model for the 3C 191 absorber (Figure 4) in which pockets of dense neutral gas (represented by Mg I 2853) are surrounded by a diffuse, spatially extended medium of generally higher ionization (e.g. C IV and NV). The diffuse clouds contain most of the total column density; their greater size and/or greater numbers lead to more complete coverage in both velocity and projected area. More work is needed to characterize fully this class of distant AAL absorbers (see also Hamann & Brandt 2001, Barlow et al. 1997, Tripp et al. 1996, Morris et al. 1986), and understand its relationship (if any) to other absorption phenomena in quasars/AGNs.
We are grateful to the staff of the Keck Observatory for their willing assistance. FH thanks Bassem Sabra for useful discussions and acknowledges support from NSF grant AST 99-84040. CBF acknowldges NSF grant AST 98-03072.
References
Akujor, C.E., et al. 1994, A&A Supp., 105, 247
Bahcall, J.N., et al. 1967, ApJ, 149, L11
Barlow, T. A., Hamann, F., & Sargent, W. L. W. 1997, in ASP Conf. Series, 128, Mass Ejection From AGN, ed. R. Weymann, I. Shlosman, & N. Arav (San Francisco: ASP), 13
Barlow, T. A., & Sargent, W. L. W. 1997, AJ, 113, 136
Brandt, W.N., Laor, A., & Wills, B.J. 2000, ApJ, 528, 637
Brotherton, M.S., et al. 1998, ApJ, 501, 110
Burbidge, E.M., et al. 1966, ApJ, 144, 447
Hamann, F., & Brandt, W.N. 2001, PASP review, in prep.
Hamann, F., et al. 1997, ApJ, 478, 80
Morris, S.L., et al. 1986, ApJ, 310, 40
Richards, G.T. 2000, ApJS, 133, 53
Tripp, T.M., Lu, L., & Savage, B.D. 1996, ApJS, 102, 239
Weymann, R.J., Williams, R.E., Peterson, B.M., & Turnshek, D.A. 1979, ApJ, 234, 33
Williams, R.E., Strittmatter, P.A., Carswell, R.F., & Craine, E.R. 1975, ApJ, 202, 296
Wills, B.J., et al. 1995, ApJ, 447, 139