The Onsala blind 6.7 GHz survey of the galactic plane: new methanol masers in the northern hemisphere.
Abstract
We review the state of the Onsala blind survey of the galactic plane, searching for new 6.7 GHz methanol masers. We also describe preliminary results of millimeter follow-up observations of the new detections and high resolution observations using the EVN. We conclude that blind surveys are important to complement targeted searches done until now and give the possibility to detect new classes of objects.
1 Onsala Space Observatory, S-439 92 Onsala, Sweden
1. Introduction
Methanol masers are often detected in regions with typical signposts of massive star formation, such as H2O and OH masers, and some of them are detected towards IRAS sources satisfying the Wood & Churchwell (1989) criterium for UCHII regions. Nevertheless high resolution VLBI observations show that such masers are not necessarily cospatial with IRAS UCHII regions (Minier, Conway, & Booth 2001), which leads us to suppose that the maser activity can appear at a very early stage in the formation of a star, before the formation of a UCHII region. This fact increase the importance of blind surveys for 6.7 GHz masers of the whole galactic plane.
We are using the Onsala 25m telescope to conduct such a survey (, ), searching for the powerful 6.7 GHz maser line of methanol. Since late 1998 we have surveyed about 45 deg2, and have made 11 detections (see Table 1). An important aspect of this survey lies in the fact that methanol maser is the only maser emission which has been searched for in this way in the northern hemisphere. Our unbiased survey should be regarded as complementary to the work carried out towards the Galactic center from Australia (Caswell 1996a+b, Ellingsen 1996).
The newly upgraded Onsala 25m telescope is equipped with a three stage cryogenically cooled High Electron Mobility Transistor (HEMT) amplifier mounted at the secondary focus. The backend consists of a 1600 channel autocorrelator fed with a 6.4 MHz bandwidth, which guarantees a complete coverage of the velocity distribution in the Galaxy ( 150 km/s). Each square degree of the galactic plane is surveyed following an equilateral triangular grid, integrating 10 minutes per position. The system temperature lies between 1200 and 1500 Jy. Our sensitivity is about 6 Jy/channel at 5 rms. The positions of 10 of the 11 detections were accurately determined using the 100m Effelsberg telescope (September 2000, 10 arcsec accuracy) and those positions were used for the follow-up VLBI and millimeter observations.
2. Results from the blind survey
Among the 11 detections, some masers have already been detected during other surveys; this allows us to test our system sensitivity. 5 detections have apparently been missed by previous pointed surveys. This allows us to make some conclusions about the selection criteria. For instance, most of the pointed surveys conducted until now made use of color filtering of the IRAS Point Source Catalogue (PSC). The reason for that is that class II methanol masers (such as that at 6.7 GHz) are supposed to appear in the neighbourhood of a strong infrared source which guarantees the pumping of the non thermal maser emission. A cross check of the detection rate in previous pointed surveys shows a relatively low efficiency in terms of number of detections of all those selection criteria: except for the surveys by Menten et al. (1991) and Caswell et al. (1995), the average detection rate is about 20% (see Table 2).
| Source name | RA (J2000) | Dec (J2000) | Speak | Reference | ||
|---|---|---|---|---|---|---|
| G 35.88-0.20 | 18:57:30.7 | 02:31:45 | 3.0 | 60 | 55, 65 | new det |
| G 40.25-0.19 | 19:05:32.6 | 06:25:38 | 12 | 70 | 69, 71 | 1 |
| G 40.61-0.09 | 19:05:50.2 | 06:47:18 | 4.5 | 27 | 26, 28 | 2 |
| G 41.34-0.14 | 19:07:22.1 | 07:25:12 | 51 | 14 | 13, 16 | new det |
| G 42.07+0.24 | 19:07:20.8 | 08:14:13 | 11 | 12 | 10, 14 | new det |
| G 43.17+0.01 | 19:10:14.3 | 09:06:14 | 15 | 2 | -2, 16 | 2 (W49) |
| G 43.80-0.13 | 19:11:54.3 | 09:35:53 | 30 | 37 | 34, 41 | 2 |
| G 44.05+0.00 | 19:11:54.3 | 09:53:02 | 4.5 | 40 | 38, 42 | new det |
| G 45.07+0.13 | 19:13:22.4 | 10:50:58 | 31 | 57 | 56, 58 | 2 |
| G 45.53+0.13 | 19:14:14.8 | 11:15:16 | 5.5 | 63 | 53, 65 | 3 |
| G 85.40-0.07 | 20:54:15.3 | 44:53:54 | 45 | -30 | -32, -28 | new det |
| Biased surveys | ||
| Menten (1991) | 80 / 123 | UCHII, H2O, OH maser sites |
| Schutte et al. (1993) | 35 / 235 | IRAS, color selected |
| Caswell et al. (1995) | 245 | OH (208), star formation regions |
| van der Walt et al. (1995) | 31 / 520 | IRAS (color selected UCHII) |
| Walsh et al. (1997) | 201 / 535 | IRAS (color selected) |
| Slysh et al. (1999) | 42 / 429 | IRAS (color selected UCHII) |
| Szymczak et al. (2000) | 182 / 1399 | IRAS (color selected) |
| Detection rate towards IRAS sources: 20 % | ||
| Blind surveys | ||
| Caswell (1996a,b) | 80 masers in 11 deg2 | 7.2 masers / deg2 |
| Ellingsen (1996) | 107 masers in 33 deg2 | 3.2 masers / deg2 |
| Onsala (1999-2001) | 11 masers in 45 deg2 | 0.25 masers / deg2 |
A comparison between IRAS-targeted and blind surveying in the regions observed at Onsala shows that, if we had applied a targeted search, we would have missed between 5 and 7 methanol maser sources, depending on the filtering applied to the IRAS catalogue (we considered three possiblities, Szymczak et al. 2000, Wood & Churchwell 1989, Schutte et al. 1993, ordered by decreasing number of IRAS sources included). This fact strongly justifies the worth of a blind survey.
Where no IRAS counterpart was found, we searched for Mid-IR sources around the methanol maser positions listed in the MSX catalogue (Midcourse Space Experiment). The fact is that for some sources not even a Mid-IR counterpart is found indicating that the methanol masers must arise in very compact and deeply embedded sources where only longer wavelengths () can pass through the optically thick dust cocoon. Further observations at 450 and 850 m will be hopefully performed in order to clarify the origin of these sources.
3. Follow-up observations
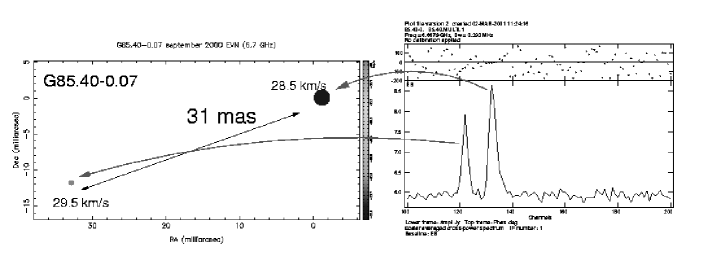
The follow-up program of the Onsala survey consists of both a searching for and mapping of traditional high density tracers (13CO, C18O, CS, HCO+, HCN, thermal CH3OH, HC3CN) in the millimeter band (85-110 GHz) using the Onsala 20m telescope, and high resolution observations using the EVN. Because of the spectral simplicity of the new methanol masers (see e.g. Figure 1 and for comparison Minier et al. in this volume) it is difficult to make conclusions about the shape of the emitting region. The maps in the millimeter range suggest, on the other hand, that the methanol masers could be offset from the highest density gas, as shown in Figure 2.

References
Wood D.O.S., Churchwell E. 1989, ApJS, 69, 831
Caswell J.L. 1996a, MNRAS, 279, 79
Caswell J.L. 1996b, MNRAS, 283, 606
Ellingsen S.P. 1996, PhD Thesis, University of Tasmania
Menten K.M. 1991, ApJ, 380, 75
Schutte A.J., van der Walt D.J., Gaylard M.J., MacLeod G.C. 1993, MNRAS, 1993, 261, 783
Caswell J.L., Vaile R.A., Ellingsen S.P., Whiteoak J.B., Norris R.P. 1995, MNRAS 1995, 272, 96
van der Walt D.J., Gaylard M.J., MacLeod G.C. 1995, A&AS, 110, 81
Walsh A.J., Hayland A.R., Robinson G., Burton M.G. 1997, MNRAS, 291, 261
Slysh V.I., Val’tts I.E., Kalenskii S.V., Voronkov, M.A., Palagi F., Tofani G., Catarzi M. 1999, A&AS, 134, 115
Szymczak M., Hrynek G., Kus, A.J. 2000, A&AS, 134, 269
Minier V., Conway J.E., & Booth R.S. 2001, A&A, 369, 278