The X-ray spectrum of LSI+61303
It had been proposed earlier that the hard X-ray and gamma-ray radiation of the Be/X-ray system LSI +61303 could be due to inverse Compton scattering of optical photons from the Be star by the same electron population which also produces the radio emission. Recently, Apparao (2001) has calculated this inverse Compton emission in more detail, and predicted that the X-ray spectrum should show a break at around 20 keV. We investigated archival RXTE data, but do not find such a break in the 2–25 keV range. The implications of this finding are shortly discussed.
Key Words.:
X-ray: stars – binaries: close – Stars: individual: LSI +61303 V615 Cas1 Introduction
LSI +61303 V615 Cas is a Be binary system which exhibits radio outbursts at regular 26.5 day intervals which is believed to be the orbital period (Gregory & Taylor 1978, Taylor & Gregory 1982). This source has created particular excitement because of the possible association with the strong, 100 MeV gamma-ray source 2CG 135+01 (Bignami & Hermsen 1983). In fact, LSI +61303 was discovered in X-rays while searching for the counterpart of 2CG 135+01 (Bignami et al. 1981). Confusion was initially introduced by the presence of the quasar QSO 0241+622 which is less than 15 away from LSI +61303 and which contributes to the (blended) emission as measured by OSSE and COMPTEL. In the past years, ROSAT, ASCA and RXTE observations have resolved the emission from the Be star and the quasar. Moreover, the latest EGRET analysis has reduced the error circle of 2CG 135+01 2EG J0241+6119 3EG J0241+6103 to 11′, thus excluding the quasar as a counterpart candidate as well as making the association with LSI +61303 (which is 13′ apart) quite uncertain (Kniffen et al. 1997, Hartman et al. 1999)!
Nevertheless, the X-ray emission mechanism of LSI +61303 has inspired both, theoreticians as well as observers. While there is general agreement that the radio outbursts are produced by synchrotron radiation, it has been argued that it is unlikely that the X-ray emission stems from the same electron population, but rather could originate by inverse Compton emission (Taylor et al. 1996, Harrison et al. 2000). This picture is supported by extensive multi-wavelength observations which are reported in Strickman et al. (1998) and Harrison et al. (2000).
Very recently, Apparao (2001) has modelled this inverse Compton emission in more detail. Based on the assumption that the electron population is rather steady (that is, ignoring the 0.5 phase shift between X-ray and radio peak), he derived the properties of this electron population (such as spectral index, magnetic field and drift velocity) from the observed radio peak flux, and from that calculates the 10–200 keV spectrum. While Apparao (2001) finds general agreement of his model with the data, he also predicts a clear spectral break caused by the peak of the optical photon field (from the Be star) around eV and boosted by the Lorentz factor
| (1) |
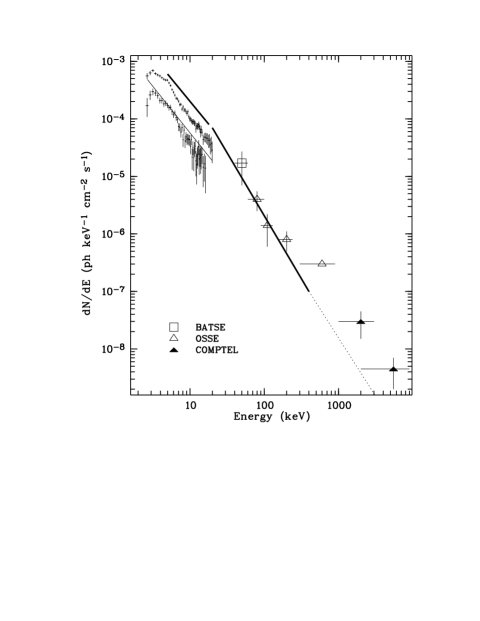
For the values he used, Apparao (2001) derives , and thus a break at keV. The inverse Compton photon spectrum is therefore given by (see thick line is Fig. 3)
and
In this short note we have investigated pointed Rossi X-ray Timing Explorer (RXTE; Swank 1998) data to test this clear prediction for the spectral shape of the X-ray emission. Note that while Harrison et al. (2000) give a complete description of these same RXTE data with respect to photon flux and temporal variability, no clear statement is made about the spectral slope.
| ID | Date | photon | Norm | PCA count | Flux (2–10 keV) | / dof | |
|---|---|---|---|---|---|---|---|
| (10172-) | (UTC, 1996-) | (1022 cm-2) | index | (10-3 ph keV-1 cm-2s-1) | rate (cts/s) | (10-12 erg cm-2 s-1) | |
| 01-01-00 | 03-01 13:41-19:36 | 3.4 | -2.1 | 7.4 | 7.4 | 12.2 | 45/61 |
| 02-01-00 | 03-04 21:24-01:47 | 5.2 | -2.1 | 9.2 | 8.7 | 13.5 | 39/61 |
| 03-01-01 | 03-08 00:01-03:59 | 5.2 | -2.3 | 7.9 | 5.3 | 8.5 | 38/61 |
| 04-01-00 | 03-10 00:55-05:25 | 6.5 | -2.4 | 9.1 | 5.2 | 8.2 | 28/61 |
| 05-01-00 | 03-13 03:51-08:56 | 3.8 | -2.0 | 5.7 | 7.7 | 11.7 | 48/61 |
| 06-01-00 | 03-16 00:24-03:08 | 4.8 | -2.1 | 9.7 | 9.7 | 15.2 | 25/61 |
| 06-01-01 | 03-16 03:39-06:21 | 3.4 | -2.0 | 7.0 | 9.7 | 14.9 | 47/61 |
| 07-01-00 | 03-18 10:28-15:54 | 5.0 | -2.1 | 14.0 | 13.5 | 21.0 | 61/61 |
| 09-01-00 | 03-24 23:07-04:35 | 2.1 | -2.3 | 8.0 | 6.5 | 11.6 | 30/55 |
| 10-01-00 | 03-26 00:52-07:26 | 0.0 | -1.6 | 2.4 | 11 | 11.0 | 43/55 |
| 11-01-00 | 03-30 03:59-10:41 | 3.4 | -2.1 | 5.2 | 4.8 | 8.4 | 30/55 |
2 Observations
We have analyzed 11 pointed RXTE observations of LSI +61303 taken between March 1 and March 30, 1996 (see Tab. 1 for a log of all observations). All data have been retrieved from the HEASARC archive. Similar to Harrison et al. (2000) we have used “Standard 2” mode spectra of the Proportional Counter Array (PCA; Jahoda et al. 1996) which have full energy resolution and 16-sec accumulation time. The only major difference in our treatment as compared to that of Harrison et al. (2000) is that we do not only use data from layer 1 of the PCA units (PCUs). Instead, we use all layers, since it is predominantly in the lower layers where the harder (10 keV) photons are detected.
Unfortunately, the observations were effected by several instrumental problems, and the PCA gain had to be changed (see Harrison et al. 2000 for a complete description). Therefore, two different sets of background models (faintl7_e01v03 and faint240_e01v03 for data from epoch 1 (until March 20) and faintl7_e2v19990824 and faint240_e2v19990909 for data from epoch 2 (from March 21 on)) had to be used. All 5 PCUs were used except for March 24, when only 3 PCUs of the PCA were available. We combined all 16-sec spectra into one X-ray spectrum per observation. For spectral analysis within the XSPEC package (Arnaud 1996), we used a model consisting of cold absorption and a power law model. The fit is acceptable in all cases, and the detailed fit results are shown in Table 1.

As an example, the spectrum of March 18, without any further binning, is shown in Fig. 1. As clearly visible, the spectrum gets noisy above 25 keV at which point the steeper source spectrum approaches the intensity of the background. Therefore, we limited our spectral fitting to the 2.3–25 keV range. The positive residuals around 35 keV suggest that the flux above 30 keV is mostly background, and therefore the intrinsic spectrum of LSI +61303 is steeper at these energies. Note that no useful data are accumulated in the HEXTE clusters (as mentioned already by Harrison et al. 2000).
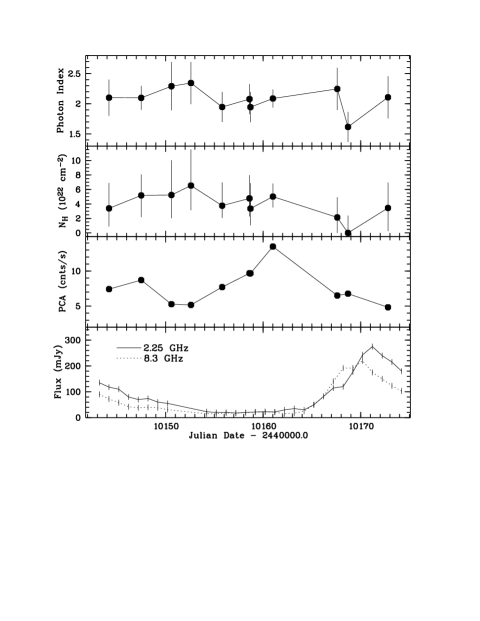
We find that the spectral photon index and the absorbing column are roughly constant throughout all 11 observations. This is obvious from Fig. 2 which also shows the relevant errors for a two parameter fit (full, correlated errors where the error in the absorbing column adds to that in the power law slope and vice versa). A notable exception, at first glance, is the spectrum of March 26, 1996 which shows a unique, flat power law photon index of 1.6 (see also Tab. 1). However, the best-fit absorbing column for this spectrum is as low as 1018 cm-2 (practically zero), by far less than the foreground absorbing column towards LSI +61303 of 8.41021 cm-2 as deduced from HI measurements (Frail & Hjellming 1991) or 61021 cm-2 as deduced from ASCA spectral fitting (Leahy et al. 1997). This implies that the spectrum of this date is probably affected by unknown systematic uncertainties (note that epoch 2 starts already 3 days earlier), and therefore has to be considered with great care.
This concern is supported by the sequence of ROSAT observations through an outburst in 1992 which show that the spectrum does not change (Taylor et al. 1996). In particular, the hardness ratio (their Fig. 3) is constant except one observation at the radio maximum where it is marginally harder, suggesting higher absorption (if it were varying absorption). This is in contrast to the zero-absorption in the single RXTE observation of March 26 which is nearly exactly at the same radio phase as the ROSAT outlyer. Assuming that the X-ray/radio outburst behaviour is repeatable from outburst to outburst, e.g. in 1992 and 1996, then this also suggests that the RXTE spectrum of March 26 may be unreliable.
Thus, ignoring for the moment the spectrum of March 26, 1996, the other 10 spectra are consistent with being constant over a time interval of 30 days, at mean fit values of -2.1 and cm-2, and therefore matching the extension of the high-energy spectrum up to 10 MeV. Fig. 3 shows the spectrum of March 10 and 18, respectively, on top of the OSSE, BATSE and COMPTEL measurements as compiled by Apparao (2001). The factor 2 and 4, respectively, in normalization difference could be due to (i) the fact that Apparao (2001) selected observations made around periastron, i.e. near the X-ray peak flux, though our selected spectrum of March 18 also corresponds to the X-ray peak, (ii) the different dates and exposure/integration times of RXTE vs. OSSE/BATSE, or (iii) additional flux by QSO 0241+622 contributing to the OSSE/BATSE flux. We note that our fluxes are about 25% larger than those derived by Harrison et al. (2000), most probably because they only included layer 1 data. The 2–10 keV ASCA fluxes (Leahy et al. 1997, Harrison et al. 2000) are 5.810-12 erg cm-2 s-1 and 4.310-12 erg cm-2 s-1, and thus substantially lower than the RXTE fluxes, thus indicating that there is nothing wrong with the RXTE fluxes being smaller than the OSSE/BATSE fluxes.
As a side-product of our spectral fitting, we noticed that some RXTE spectra show a strong residual feature at around 5 keV (see Fig. lower panel of 1). The centroid energy of this feature is near to the Xe L edge, causing some worries about being a LSI +61303 intrinsic feature. However, the fact that the feature is not present in Crab data taken on March 8, 1996 and analyzed with the same response matrix created with HEAsoft 5.0.4, suggest that this feature is neither due to a failure of the response or background, but related to some source parameter. This residual seems to be strongest around the X-ray peak, but this effect could be due to statistics, e.g. better signal-to-noise. It may be possible that the feature exists at all times, but is only detected during times of higher X-ray count rate. At present, its origin remains unexplained, though. We note that if it were Fe K emission, it would correspond to a (receding) velocity of 0.2 c, much faster than the orbital velocity of any of the two binary components, or the Be stellar wind.
3 Conclusion
Our result of the analysis of the 2–25 keV X-ray spectrum of LSI +61303 is twofold: (i) we find that the spectral shape and intensity (normalization) above around 20 keV is about 2.0-2.3, consistent with the prediction of Apparao (2001); (ii) We do not find a spectral break in the spectrum around 20 keV, but the spectrum continues to lower energies, in fact down to the lowest energies as measurable by RXTE/PCA, as a straight single power law. This is in contrast to the calculation of Apparao (2001) who predicted a break in the spectrum around 20 keV.
Though the RXTE data do not extend far beyond 20 keV, the surprising match in slope to the high-energy spectrum as derived from BATSE, OSSE and COMPTEL implies that variations due to different observing times and integration times are marginal, unless the spectrum above 25 keV is not related to LSI +61303, but a different source. The good match also implies that the predicted break is unlikely to be at energies above the RXTE range. Thus, if one wants to maintain the general concept of Apparao (2001), based on our result (i), the only remaining possibility for a spectral break would be below 1 keV.
One may therefore ask whether the parameters for the inverse Compton scenario (entering Eq. 1) can be tuned such that is compatible with a break below 1 keV. The energy of the optical photons of the Be star ( eV) cannot be changed by more than 20%. Thus, the factor of 20 which is needed to shift the break from 20 keV to below 1 keV must come through the Lorentz factor (Eq. 1), i.e. the product of radial velocity drift of the electron bubble and the distance between bubble and Be star would have to be a factor 4.5 smaller (since the break energy depends on ). Apparao (2001) used = 31012 cm (the periastron distance) and = 1000 km/s. While the drift velocity is largely unknown, the reduction of the value of would require that the electron bubble moves towards the Be star without loosing energy and/or expanding. Thus, under the assumptions as made by Apparao (2001) it seems unlikely that the break can occur below 1 keV.
However, as a more general note we mention that Apparao (2001) apparently uses the peak radio intensity to calculate the intensity of the relativistic electrons which then produce the X-ray spectrum by inverse Compton scattering. However, the peak radio intensity occurs 10 days after the X-ray peak (Fig. 2)! Since the electrons are probably accelerated near periastron, they would not only have to survive these 10 days (40% of the orbital period), but also must not change their energy to fulfil the above assumption. Thus, the calculations of Apparao (2001) use just a crude approximation, and a time-dependent treatment of the electron population and the corresponding X-ray emission along the orbital phase seems warranted. It then remains to be seen whether a break 1 keV would be predicted (which in any case would be difficult to verify), or whether the idea of inverse Compton emission has to be abolished at all.
Acknowledgements.
We are extremely grateful to Keith Jahoda (GSFC/USA) for help in the response matrix generation and for double checking the residual 5 keV feature. This research has made use of data obtained through the HEASARC, provided by the NASA/Goddard Space Flight Center.References
- (1) Apparao K.M.V., 2001, A&A 366, 865
- (2) Arnaud K.A., 1996, Astronomical Data Analysis, Software and Systems V, eds. Jacoby G. and Barnes J., ASP Conf. Ser. 101, p. 17
- (3) Bignami G.F.B., Caraveo P.A., Lamb R.C., Markert T.H., Paul J.A., 1981, ApJ 247, L85
- (4) Bignami G.F.B., Hermsen W., 1983, ARA&A 21, 67
- (5) Frail D., Hjellming R.M., 1991, AJ 101, 2126
- (6) Gregory P.C., Taylor A.R., 1978, Nat. 272, 704
- (7) Harrison F.A., Ray P.S., Leahy D.A., Waltman E.B., Pooley G.G., 2000, ApJ 528, 454
- (8) Hartman R.C., Bertsch D.L., Bloom S.D., et al. 1999, ApJ Suppl. 123, 79
- (9) Jahoda K., Swank J.H., Giles A.B., Stark M.J., Strohmayer T., et al. 1996, SPIE 2808, 59
- (10) Kniffen D.A., Alberts W.C.K., Bertsch D.L. et al. 1997, ApJ 486, 126
- (11) Leahy D.A., Harrison F.A., Yoshida A., 1997, ApJ 475, 823
- (12) Strickman M.S., Tavani M., Coe M.J., Steele I.A., Fabregat J., Marti J., Paredes J.M., Ray P.S., 1998, ApJ 497, 419
- (13) Swank J.H., 1998, in The Active X-ray Sky: Results from BeppoSAX and RXTE, Eds. L. Scarsi et al., Nuclear Physics B, (Proc. Suppl.), vol. 69, p. 12
- (14) Taylor A.R., Gregory P.C., 1982, ApJ 255, 210
- (15) Taylor A.R., Young G., Peracaula M., Kenney H.T., Gregory P.C., 1996, ApJ 305, 817