On the gas temperature in circumstellar disks around A stars
In circumstellar disks or shells it is often assumed that gas and dust temperatures are equal where the latter is determined by radiative equilibrium. This paper deals with the question whether this assumption is applicable for tenous circumstellar disks around young A stars. In this paper the thin hydrostatic equilibrium models described by Kamp & Bertoldi (Kamp (2000)) are combined with a detailed heating/cooling balance for the gas. The most important heating and cooling processes are heating through infrared pumping, heating due to the drift velocity of dust grains, and fine structure and molecular line cooling. Throughout the whole disk gas and dust are not efficiently coupled by collisions and hence their temperatures are quite different. Most of the gas in the disk models considered here stays well below 300 K. In the temperature range below K the gas chemistry is not much affected by and therefore the simplifying approximation can be used for calculating the chemical structure of the disk. Nevertheless the gas temperature is important for the quantitative interpretation of observations, like fine structure and molecular lines.
Key Words.:
Molecular processes – circumstellar matter – Stars: early-type – Stars: individual: Vega – Stars: individual: Pictoris – planetary systems1 Introduction
In the literature the expression “Vega-type” stars is widely used to characterize main-sequence stars of any spectral type which show an infrared excess. In order to deal with a more homogeneous subgroup this paper concentrates on nearby A dwarfs which are surrounded by dust disks including the most prominent and well studied stars Pictoris and Vega.
The literature presents a large variety of models for these stars ranging from simple spherical shells with constant density (Chini et al. Chini1 (1990)) to detailed disk models with power law density distributions and several dust components (Pantin et al. Pantin (1997)). These models are used to derive constraints on the properties of the dust components like grain sizes, composition and dust mass in these disks.
Several attempts to detect CO or other molecules at radio wavelength in the disks around A stars failed (Yamashita et al. Yamashita (1993); Dent et al. Dent (1995); Liseau Liseau (1999)). On the other hand circumstellar gas is observed in the visible spectra of several A-type dwarfs (e.g. Holweger & Rentzsch-Holm Holweger1 (1995); Jolly et al. Jolly (1998); Welsh et al. Welsh (1998); Holweger et al. Holweger2 (1999); Roberge et al. Roberge (2000)) proving without doubt the existence of atomic and molecular gas ( Pictoris: CO) in their surrounding.
In order to study the nature of the circumstellar surroundings and the ongoing physical processes in more detail Kamp & Bertoldi (Kamp (2000)) developed disk models comprising the two components gas and dust. These models include a realistic treatment of the UV radiation field and the chemistry by the use of a chemical reaction network. As a first approximation gas and dust are assumed to be effectively coupled by collisions and their temperature is derived from the radiation equilibrium of the dust. The basic result of that work is an explanation of the non-detection of CO radio lines without assuming a general gas depletion in the disk. The recent detection of H2 in the disk around Pictoris (Thi et al. Thi (2001)) can be explained in the context of the above described chemical disk models.
This paper aims at a more realistic determination of the gas temperature in the above cited disk models by the use of a detailed heating/cooling balance. The assumption of will be evaluated. The gas temperature is important for the interpretation of observational data via modelling of the line emission from the gas phase, e.g. CO radio lines, [C ii] and [O i] fine structure lines, and narrow circumstellar absorption lines on top of the broadened stellar profile like the ones seen in the Ca ii K line.
2 The circumstellar disk model
The disk model and the chemical network is described in detail by Kamp & Bertoldi (Kamp (2000)). We restrict ourselves here to a short summary.
The density distribution in the disk follows from a thin hydrostatic equilibrium model
| (1) |
Here the dimensionless scaleheight is assumed to be 0.15. The inner radius of the disk is fixed to 40 AU, the outer radius to 500 AU. The dust temperature follows from radiative equilibrium assuming large spherical black body grains of size
| (2) |
with the stellar luminosity in units of the solar one . Such a disk model leads to a surface density which follows a power law in reasonable agreement with the “literature exponents” of brightness profiles (Hayashi et al. Hayashi (1985); Dutrey et al. Dutrey (1996); Augereau et al. Augereau (2001)) ranging from to . The radiation field is described by an ATLAS9 photospheric model (Kurucz Kurucz (1992)) for the appropriate stellar parameters.
We derive a stationary solution for the chemistry using a chemical network, which consists of 47 atomic, ionic and molecular species that are related through 260 gas-phase chemical and photoreactions. A number of reactions is treated in more detail like H2 and CO photodissociation, and C ionisation. The only surface reactions incorporated are H2 formation and freezing out of CO on cold dust grain surfaces (see Kamp & Bertoldi Kamp (2000) for further details).
2.1 The gas temperature
Kamp & Bertoldi (Kamp (2000)) assumed that gas and dust are effectively coupled by collisions and hence both have equal temperatures, determined by the radiative equilibrium of the dust. This assumption will be critically evaluated by implementing a detailed heating-cooling balance for the gas phase. The particle densities depend on the gas temperature and vice versa. Hence the energy balance of the gas and the chemical network have to be solved simultaneously. The gas temperature is determined by a detailed energy balance , where and are the sum of all relevant heating and cooling rates respectively. To find the solution to , we use Ridder’s method, a root bracketing algorithm (Press et al. Press (1997)), in a slightly modified way: as starting values for the gas temperature, we use twice and half the value at the previous radial point. Each change of temperature due to the root bracketing is immediately followed by a solution of the chemical network. If the root bracketing algorithm gets stuck, the routine starts to subsequently extend again the bracketing interval. In smooth areas convergence is normally achieved after 5 iterations.
2.1.1 Heating processes
In the following we give a short description of the heating processes taken into account for the determination of the gas temperature.
Photoelectric heating.
The photoelectric emission from grain surfaces is a major heating source for the gas (Watson Watson (1972); Draine Draine1 (1978)). Dust particles in the circumstellar disks considered here have typical sizes of a few microns; hence the properties of these large grains — large compared to the wavelength of UV radiation — are well described by those of bulk material. This approach differs from the one of Draine (Draine1 (1978)) in that we deal in this paper with micron sized dust instead of small interstellar dust particles. Two different grain compositions are studied: graphite and silicate.
The work functions of these materials are taken from the experimental work of Feuerbacher & Fitton (Feuerbacher (1972)), eV for graphite and eV for silicate. Analytical fits to their data describe the photoelectric yields as functions of the energy of the incoming UV photon
| (3) |
The kinetic energy spectrum of the emitted photoelectron is crudely approximated by Eq.(3) of Draine (Draine1 (1978))
| (4) |
Here denotes the kinetic energy of the escaping photoelectron.
The photoelectric heating rate depends on the energy of the impinging UV photon and on the grain potential . The currents that determine the grain potential are impinging electrons and UV photons. The contribution of impinging ions, mainly protons, is negligible, because hydrogen is mostly neutral or even molecular in these disks. The incident electron current is (Draine Draine1 (1978))
| (5) |
with , the electron mass and the electron density. The sticking probability of electrons to grains is assumed to be 0.5 following the argumentation of Draine (Draine1 (1978)).
Photoelectrons will be emitted from the grains at a rate per grain surface area given by (Draine Draine1 (1978))
| (6) |
with for , for and . The absorption efficiency of the dust grains is assumed to be 1 independent of wavelength in the UV. The frequency denotes that of impinging UV photons at the threshold . The equilibrium grain potential can be derived from equating (5) and (6).
Given the grain potential and the stellar UV radiation field, the photoelectric heating rate can be determined from
| (7) | |||||
where and denote the particle density of hydrogen and the grain geometric cross section per H nucleus.
In order to make the calculation of the photoelectric heating rate efficient enough for the inclusion into the heating/cooling balance, the rate is approximated using a function similar to Bakes & Tielens (Bakes (1994))
| (8) |
for electron particle densities cm-3, gas temperatures K, and FUV photon fluxes , where the flux is measured in units of the Habing (Habing (1968)) field between 912–1110 Å ( cm-2 s-1).


The photoelectric efficiency for graphite is approximated by
| (9) |
where depends on the so-called grain charge parameter
| (10) |
This formula yields photoelectric heating rates accurate to within 10-25%.
The photoelectric heating rate for silicate grains is slightly different from the one for graphite and reads as follows
| (11) |
with
| (12) |
and
| (13) |
Fig. 1 compares the photoelectric heating rate derived in this paper for large graphite grains with that derived by Bakes & Tielens (Bakes (1994)) for ISM graphite
| (14) |
where the photoelectric efficiency is approximated by
| (15) |
The difference is due to the larger photoelectric yield of small grains. Photoemission is mostly a “volume process”. In large grains the escape probability of photoelectrons is reduced, because they are created far below the surface. There scattering becomes important and they can easily be retrapped in the grain. Fig. 2 reveals the same effect for the large silicate grains.
Heating by collisional de-excitation of H2.
H2 molecules excited by Lyman and Werner band absorption decay to vib-rotationally excited levels of the ground electronic state and heat the gas via collisional de-excitation. We approximate the complex process using the formula of Tielens & Hollenbach (Tielens2 (1985)) for a single excited pseudovibrational level
| (16) | |||||
denotes the fixed fraction of vibrationally excited molecular hydrogen and erg is the effective energy of the pseudolevel. We assume in this paper .
Heating by photodissociation of H2.
Photodissociation of H2 occurs via line transitions to excited levels followed by spontaneous radiative dissociation into two hydrogen atoms. The kinetic energy of each H-atom is typically 0.4 eV (Stephens & Dalgarno Stephens (1973)), leading to an approximate heating rate
| (17) |
s-1 denotes the H2 photodissociation rate, which depends on the strength of the UV radiation field and on the amount of H2 self-shielding (Kamp & Bertoldi Kamp (2000)).
Heating by H2 formation on dust.
The formation of an H2 molecule on the surface of a dust grain releases the binding energy of 4.48 eV. Due to the lack of laboratory data, we follow the approach of Black & Dalgarno (Black2 (1976)) and assume that this energy goes into translation, vibration and rotation in equal parts. Hence about 1.5 eV will go into kinetic energy and therefore heat the gas
| (18) |
is the temperature dependent H2 formation rate (Kamp & Bertoldi Kamp (2000)).
Gas-grain collisions.
Gas-grain collisions will act as a gas heating source for dust temperatures larger than the gas temperature (Burke & Hollenbach Burke (1983)),
| (19) | |||||
where and denote the particle density of dust grains and the thermal accomodation coefficient respectively. A typical value for silicate and graphite dust is (Burke & Hollenbach Burke (1983)). If the gas temperature exceeds that of the dust, this rate becomes negative and therefore acts as a cooling rate ().
Heating due to C ionisation.
In the presence of strong UV radiation neutral carbon can be photoionized with an average yield of approximately 1 eV per photoelectron (Black Black1 (1987))
| (20) | |||||
where is the strength of the UV radiation field attenuated by dust. The carbon self-shielding factor
| (21) |
depends on the C column density and on the average carbon ionization cross section . The attenuation by H2 can be approximated (Kamp & Bertoldi Kamp (2000)) by
| (22) |
Drift velocity of the dust grains.
Assuming typical physical conditions for these circumstellar disks, gas and dust are momentum coupled (Gilman Gilman (1972)) and we assume that all the momentum gained by the grains from the radiation field is transferred to the gas by collisions. Dust grains of micron-size are usually removed by radiation pressure from the disk on timescales short compared to the lifetime of the disk (Artymowicz & Clampin Artymowicz2 (1997); van der Bliek et al. vanderBliek (1994); Backman & Paresce Backman (1993); Artymowicz Artymowicz1 (1988)). Since observations nevertheless reveal the presence of micron-sized dust grains, there must be a process of continous replenishment for these small grains, for example destructive collisions between much larger dust particles.
Gas and dust in the disk rotate with slightly subkeplerian speeds due to the gas pressure (gas component) and due to the drag force between dust and gas (dust component). Hence stellar gravity is largely balanced by centrifugal forces. The evaluation of the drift velocities in both directions leads to a coupled system of two-fluid two-dimensional hydrodynamical equations and is beyond the scope of this paper. Hence we restrict ourselves here to the case of maximum drift velocity, that is assuming keplerian rotation, and bracket the “true” solution by and . The maximum drift velocity can then be derived from the balance of radiation pressure on the grains and drag force due to the grains motion through the gas (Tielens Tielens1 (1983))
| (23) |
with the thermal velocity of the gas
| (24) |
and
| (25) |
Here and are the geometrical cross section and the mass of the dust grains, and are the luminosity and mass of the central star, is the total mass density of the gas, and is the flux-weighted mean of the radiation pressure efficiency
| (26) |
The rate of viscous gas heating is approximated (Tielens Tielens1 (1983)) by
| (27) |
Cosmic ray heating.
Following Clavel et al. (Clavel (1978)) The cosmic ray heating rate for a mixture of H, H2 and He is
| (28) | |||||
where s-1 is the primary cosmic ray ionisation rate of hydrogen and and are the abundances of He and molecular hydrogen relative to atomic hydrogen.
2.1.2 Cooling processes
In the following we give a short description of the cooling processes taken into account for the determination of the gas temperature.
O i cooling.
At densities larger than cm-3, LTE is a good approximation for the oxygen level occupation numbers. However the densities in the outer parts of these disks will be below that critical value. Therefore we have to calculate the statistical equilibrium (SE) of oxygen in detail. More importantly thermal emission of 50 K dust peaks at 60 m, where we also find the [O i] 63.2 m fine-structure line. Since typical dust temperatures in our disks range from 20 to 150 K, this can lead to a strong pumping of the fine-structure levels of neutral oxygen. An additional component to the infrared radiation field is the cosmic microwave background, which is more important for low rotational levels of molecules like CO.
We use an oxygen model atom consisting of the lowest three fine-structure levels and we take into account the three fine-structure lines at 63.2, 145.6, and 44.0 m, and collisions with H2, H, and electrons (Jaquet et al. Jaquet (1992); Launay & Roueff Launay (1977); Bell et al. Bell (1998)). We include spontaneous emission as well as absorption and stimulated emission due to the IR radiation field. The importance of the latter two processes for the statistical equilibrium calculations is stressed by Kamp & van Zadelhoff (Kamp2 (2000)). Table 1 gives a short overview of the atomic data. The last column gives fits to the critical densities above which collisional de-excitation becomes important
| (29) |
where denotes the sum of all collisional transitions from level to all other levels . The critical densities tabulated refer to a neutral molecular gas with , , and .


The total cooling rate is the sum over all three fine-structure transitions
| (30) | |||||
where is the Einstein probability for spontaneous emission, is the Einstein probability for stimulated emission, and the Einstein coefficient for absorption. The level population numbers and refer to the lower and upper fine-structure level respectively, and is the energy absorbed from the total infrared radiation field or radiated away per emission. turns into a heating rate as soon as is becomes negative.
| u | l | gu | gl | desig | [m] | Aul [s-1] | [cm-3] |
|---|---|---|---|---|---|---|---|
| 1 | 0 | 3 | 5 | 3P1-3P2 | 63.2 | ||
| 2 | 1 | 1 | 3 | 3P0-3P1 | 145.5 | ||
| 2 | 0 | 1 | 5 | 3P0-3P2 | 44.1 |
Fig. 3 illustrates as an example the influence of an 80 K IR radiation field on the cooling rate. Assuming black body dust emission, is a net heating rate at low temperatures. Using a more “realistic” radiation field of , which includes the dilution of radiation due to the low densities in the disk, the heating rate approaches the statistical equilibrium value at particle densities of cm-3. For higher gas temperatures () the dust infrared emission is no longer able to heat the gas and LTE is a good approximation for particle densities larger than cm-3. Spontaneous emission dominates the energy balance of O i and hence the resulting cooling rate is only marginally dependent on the background radiation field.
The optical depth of the strongest [O i] line at 63.2 m can be calculated assuming that all oxygen is in the ground level, and using a typical line width of km s-1
| (31) |
An optical depth is reached for column densities of cm-2. Assuming that all oxygen is in atomic form and is neutral throughout the whole disk (), this converts into a total column density of cm-2. Using Eq.(4) from Kamp & Bertoldi (Kamp (2000)), disks up to a total mass of 2 M⊕ are optically thin for [O i] 63.2 m radiation. Fig. 4 illustrates the optical depth of this line in a 2 M⊕ Pictoris disk model for photons emitted from the stellar surface (left) and from the disk-midplane (right).
C ii cooling.
We take the two level approximation of Hollenbach & McKee (Hollenbach2 (1989)) for the ground state of single ionized carbon; the energies and statistical weights are erg, erg and , respectively. The 157.7 m line, corresponding to a transition from the first excited level 2P3/2 to the ground level 2P1/2, has a cooling rate of
| (32) |
where the fraction of C ii in the upper level is calculated under the assumption of LTE
| (33) |
The critical density for LTE cm-3 is always lower than the minimum density of 104 cm-3 in our disk models. The Einstein probability for spontaneous emission is s-1.
H2 rotational/vibrational line cooling.
We use the H2 cooling function derived by Le Bourlot, Pineau des Forêts & Flower (Bourlot (1999)), which can be applied for gas temperatures between 100 and K and gas densities ranging from 1 to cm-3. Due to the wide energy spacing of the levels, rotational excitation of H2 is negligible below 100 K. Le Bourlot, Pineau des Forêts & Flower take into account 51 rovibrational energy levels and their collisional excitation by H, He and H2 using recent quantum mechanical calculations of the cross sections. Following their results the cooling depends only weakly on the ortho-to-para ratio. We take , the equilibrium value at 100 K, to be representative for the low gas temperatures in our models (see their Fig. 9).
O i (6300 m) cooling.
Line emission from the metastable 1D level of neutral oxygen efficiently cools the gas at very high temperatures. We take the cooling rate from Sternberg & Dalgarno (Sternberg (1989))
| (34) |
where and denote the density of neutral oxygen and electrons respectively.
Ly cooling.
The cooling by Ly emission becomes efficient at very high temperatures (Sternberg & Dalgarno Sternberg (1989))
| (35) |
and denote the density of neutral hydrogen and electrons respectively.
CH cooling.
Rotational cooling by CH is calculated using the optically thin approximation of Hollenbach & McKee (Hollenbach1 (1979))
| (36) |
where , and are cm-3, s-1 and erg respectively for the CH radical. is the thermal velocity of colliding hydrogen atoms. The cooling rate is then
| (37) |
where denotes the particle density of the CH molecule.
CO cooling
For the CO molecule the occupation numbers of the rotational lines in the ground-vibrational state differ significantly from LTE for densities below cm-3. Therefore we use a CO model molecule to calculate the statistical equilibrium of carbon monoxide. It consists of 26 levels up to J=25 and has 351 CO-H2 collisional rate coefficients (Schinke et al. Schinke (1985)). The pumping of CO levels by IR radiation is included in the same way as for O i (see respective paragraph). The molecular line data is summarized in Table 2. The last column of this table gives the best fits to the critical densities for the CO rotational lines using the same assumptions as made for the critical densities of O i.

| J | E [cm-1] | [mm] | Aij [s-1] | [cm-3] |
|---|---|---|---|---|
| 1 | 3.85 | 2.601 | ||
| 2 | 11.54 | 1.300 | ||
| 3 | 23.07 | 0.867 | ||
| 4 | 38.45 | 0.650 | ||
| 5 | 57.67 | 0.520 | ||
| 6 | 80.74 | 0.434 | ||
| 7 | 107.64 | 0.372 | ||
| 8 | 138.39 | 0.325 | ||
| 9 | 172.98 | 0.289 | ||
| 10 | 211.40 | 0.260 | ||
| 11 | 253.67 | 0.237 | ||
| 12 | 299.77 | 0.217 | ||
| 13 | 349.70 | 0.200 | ||
| 14 | 403.46 | 0.186 | ||
| 15 | 461.05 | 0.174 | ||
| 16 | 522.48 | 0.163 | ||
| 17 | 587.72 | 0.153 | ||
| 18 | 656.79 | 0.145 | ||
| 19 | 729.68 | 0.137 | ||
| 20 | 806.38 | 0.130 | ||
| 21 | 886.90 | 0.124 | ||
| 22 | 971.23 | 0.119 | ||
| 23 | 1059.37 | 0.113 | ||
| 24 | 1151.32 | 0.109 | ||
| 25 | 1247.06 | 0.104 |
CO rotational cooling is calculated in the optically thin limit by summing over all 25 rotational line transitions
| (38) | |||||
with . denotes the occupation number for the level J and is the spontaneous emission probability for the rotational transition JJ-1. and are the Einstein coefficients for stimulated emission and absorption respectively and is the released or absorbed energy. For photons travelling along the disk midplane, some of the CO lines will become optically thick. Nevertheless this does not influence the cooling rate, as the energy is radiated isotropically in all directions and most of it can therefore escape the flat disk without any reabsorption.

McKee et al. (McKee (1982)) determined numerical fits for the CO cooling rate for gas temperature larger than 150 K. These cooling rates are derived under the following assumptions: 1. optically thin lines, 2. infrared pumping by dust emission is negligible, 3. only the ground vibrational state contains a significant population. Assumptions 1 and 3 hold also for our calculations, but contrary to them, we included pumping by the infrared radiation field. Our calculations show that pumping due to thermal dust emission of the disk and the cosmic microwave background can be important for the CO population numbers (Kamp & van Zadelhoff Kamp2 (2000)). Comparing our cooling rates with IR pumping by the cosmic microwave background (Fig. 5 dashed lines) to the numerical fits of McKee et al. (McKee (1982)) (Fig. 5 dash-dotted lines), they agree reasonable well within a factor 2.5/3 for K/20 K. This is within the error which the authors claim for their fits.
Besides this good agreement between our calculations and those of McKee et al. (McKee (1982)), Fig. 5 shows the effect of the IR radiation field (solid line: with , dashed line: with , long-dashed line: ). At low particle densities the cooling rate turns into a heating rate for the two cases and . Only at low temperatures and with a much stronger radiation field we find a net heating of the gas over the whole range of densities considered here. For the optically thin disk models presented here, Fig. 5 and 6 reveal that the pumping of the CO molecule by thermal dust emission is negligible for densities larger than cm-3 and that LTE can overestimate the cooling rates by a factor 3 to 10 even at high densities.
[C i] fine structure line cooling.
Considering the chemical structure of the Pictoris disks (Kamp & Bertoldi Kamp (2000)) [C i] fine structure line cooling may become important due to the presence of neutral carbon. The calculation of the cooling rates makes use of the three level atom approximation from Hollenbach & McKee (Hollenbach2 (1989)) C i(3P0, 3P1, 3P2). The respective cooling rates for the three lines at , , and m are
| (39) |
The spontaneous transitions rates are , , and . For the level population numbers we can assume LTE, because the gas densities in these disks are well above cm-3, the critical density for LTE (see Table 8 of Hollenbach & McKee Hollenbach2 (1989)).
3 The infrared radiation field
We stressed already in Sect. 2.1 the importance of the infrared radiation field for the determination of the statistical equilibrium of oxygen and carbon monoxide. This radiation field consists of two components: one is the thermal emission of the large dust grains and the other is the 2.7 K cosmic microwave background.
Since the disks are optically thin, we can calculate the mean radiation field from the dust grains at any point (r,z) in the disk straight forwardly by integrating over the whole disk volume
| (40) | |||||
where , and define the outer boundary of the disk model. The distance from to any other point in the disk is given by
| (41) |
and the dust particle density can be derived from the gas density
| (42) |
where is the dust-to-gas mass ratio and is the material density of the dust grains. The total infrared radiation field is then the sum of the two components
| (43) |
The dust particle density is too low to ensure a total coverage even in the innermost regions of the disk. For an oxygen atom sitting in the disk plane the surrounding medium is more or less a dark background with a lot of bright spots, the dust grains. Hence the local approximation completely fails. Fig. 6 reveals the difference beween these two approaches for four different points in the disk. While in the inner regions of the disk the IR radiation field has at least the same temperature as the local gas, this is clearly not the case in the cool outer parts (Fig. 6). Moreover the radiation field cannot be represented by some kind of mean temperature scaled according to the solid angle of dust grains.
Black body grains with a size of 3 m have at m an absorption efficiency of . The assumption of a black body radiation field is no longer valid when the dust temperature changes by more than 5% over an optical depth of 1, which means a total column density of cm-2. For the disk model described here, the assumption of a black body radiation field is valid at 50 AU for total disk masses (between 40 and 500 AU) larger than M⊕ and at 100 AU for masses larger than M⊕. These values are well above the disk masses considered here.
The infrared radiation field depends only on the density structure of the disk and on the dust temperature. Since the latter is fixed by the assumption of radiative equilibrium, it can be calculated in advance and does not change during the numerical calculation of the gas chemistry and gas temperature.
4 The gas temperature: numerical models
The input parameters listed in Table 3 remain the same during the calculations presented here; we assume that the grains are composed of silicates. The only parameters changed are the disk mass and stellar radiation field. The models are calculated for two different disk masses, namely 2 M⊕ and M⊕ and for the radiation fields of two prototype stars Pictoris and Vega, which represent the cool and the hot end in the range of A stars.
| Parameter | Name | Standard value |
|---|---|---|
| grain size | 3 m | |
| grain density | 3 g cm-3 (silicates) | |
| inner radius | 40 AU | |
| outer radius | 500 AU | |
| dust-to-gas mass ratio | 0.01 | |
| disk scale height | 0.15 | |
| fraction of H | ||
| UV dust ext. cross section | cm2 (H)-1 | |
| carbon abundance | ||
| oxygen abundance |
The radiation field of Pictoris is strong enough to blow out 3 m silicate grains, since these disks rotate with slightly subkeplerian velocity around the star. The motion of the dust particles will be much more complicated than described in Eq.(23) and the velocities will probably be somewhat smaller. But in order to bracket reality, we have carried out the calculations for two extreme cases: 1. “maximum drift velocity”, 2. . We will first discuss the numerical results including and afterwards the results without drift velocity heating.
4.1 Pictoris:
Drift velocity heating dominates throughout the whole disk independent of the disk mass in the Pictoris models. The most important cooling processes for the 2 M⊕ model are illustrated in Fig. 7. Since the stellar radiation field is too weak to efficiently dissociate carbon monoxide (Kamp & Bertoldi Kamp (2000)), the CO rotational lines are the most efficient coolant in the inner parts of the disk. Using the laboratory data for freezing out of CO on water ice surfaces (Sandford & Allamandola 1990), at K all CO is incorporated in ice mantles around cold dust grains (Kamp & Bertoldi Kamp (2000)); hence [O i] fine structure cooling dominates in those parts. In the uppermost layers of the disk from inside to outside [O i], [C ii] and then H2 line cooling are the most important cooling processes. By lowering the disk mass by a factor ten (see Fig. 8) the dominant processes become very similar to those found in the upper layers of the more massive disk model. The global picture does not change much, except that now [C ii] and H2 line cooling become more important compared to [O i] cooling.
The resulting temperature structure of both disk models is shown in Figs. 9 and 10. Due to the strong drift velocity heating, the gas temperature of the disk is always larger than the dust temperature, except for a small core, which is below 10 K at 100 AU in the 2 M⊕ model. In both models we find a small hot surface layer in the inner parts of the disk. We will show later in Sect. 6 that the total mass contained in this hot layer is less than 1% of the total disk mass.
4.2 Pictoris:
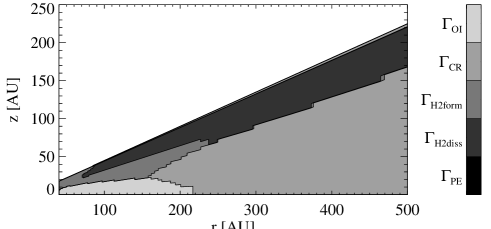
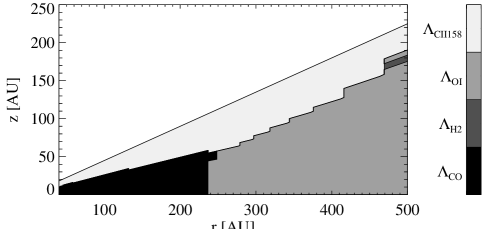
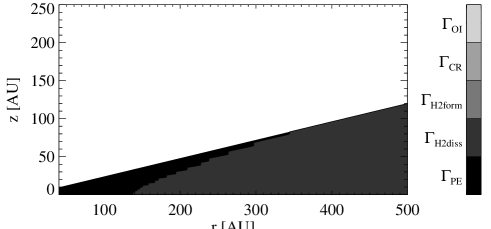
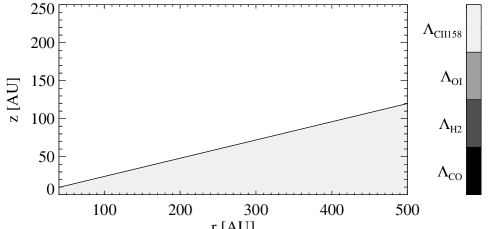
If we neglect the drift velocity heating in the Pictoris disk, cosmic ray heating becomes important in large parts of the disk (see Fig. 11). In the inner regions of the disk plane, the gas is heated by pumping of the O i levels. Looking at the upper layers, we find that in the inner regions heating by H2 formation dominates, while outwards H2 dissociation is more important. On the other hand Fig 12 shows, that [C ii] fine-structure cooling dominates in the upper disk layers, where carbon is not bound in CO. While in the innermost parts CO rotational line cooling contributes largely to the total cooling rate, more outwards, where CO is frozen onto the cool dust grains, [O i] fine structure cooling determines the gas temperature.
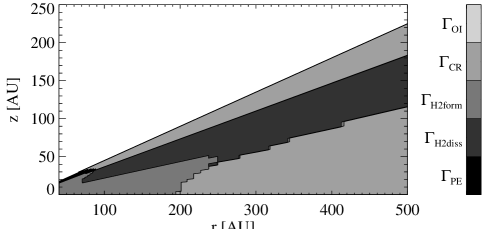
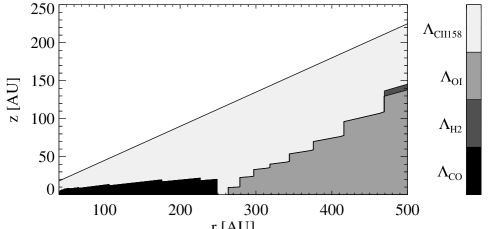
The heating/cooling processes for the M⊕ model are shown in Figs. 13 and 14. Cosmic ray heating is now also important in the uppermost low density disk layers. Between the two regions of cosmic ray heating, the gas is heated by H2 dissociation, while in the inner region of the disk H2 formation is more important. The cooling rates show a similar behaviour as for the 2 M⊕ model except that CO rotational line cooling and [O i] fine structure cooling are now more concentrated towards the disk midplane.
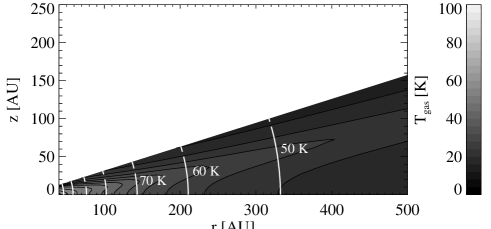
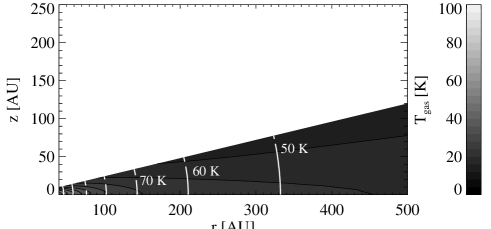
Without any drift velocity heating, the gas in the disks becomes extremely cool, K (Figs. 15 and 16). Note that one of the main heating sources, namely heating by H2 formation, is not as efficient as in molecular clouds, because the dust grains used in our disks are much larger than in the ISM, and hence the dust formation rate is lower (Kamp & Bertoldi Kamp (2000)).
4.3 Vega:
Contrary to the Pictoris model, CO is mainly photodissociated in the Vega disks and hence CO rotational line cooling is not important. Instead the main coolants are O i and C ii.
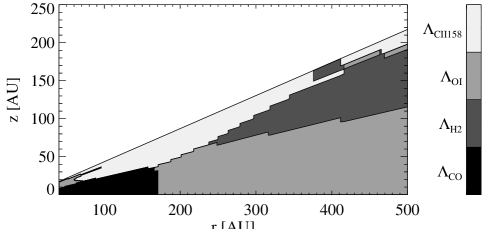
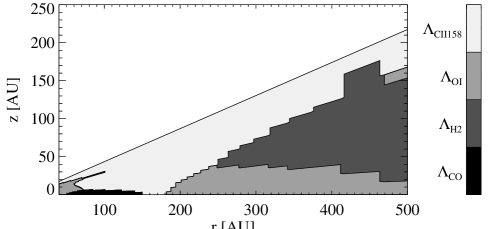
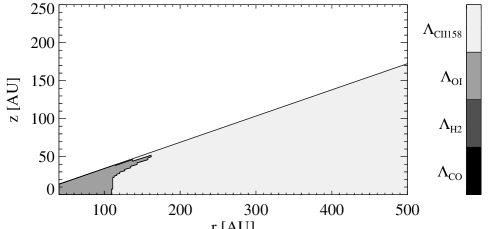
Similar to the Pictoris models, drift velocity heating is the main energy input for the gas. Fig. 17 shows, that [O i] (dense inner parts) and [C ii] m (outer parts) fine structure lines are the most important cooling processes of the 2 M⊕ Vega model.
If we reduce the density in the disks by a factor 10 (Fig. 18), the most important cooling processes remain the same.
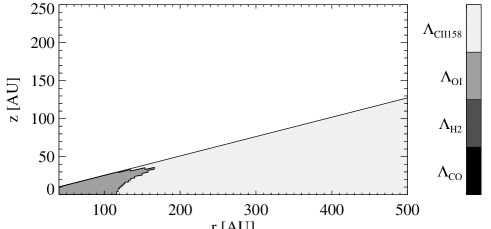
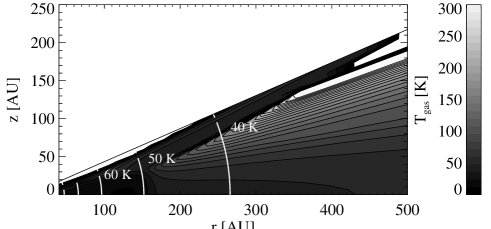
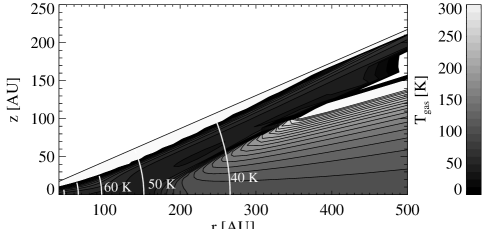
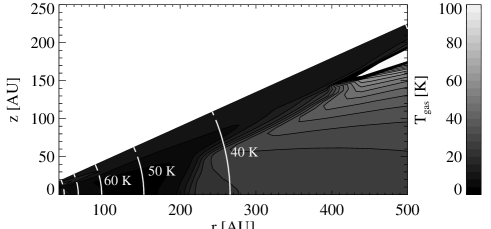
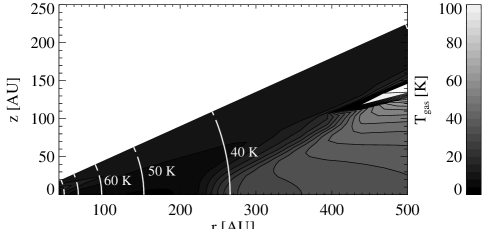
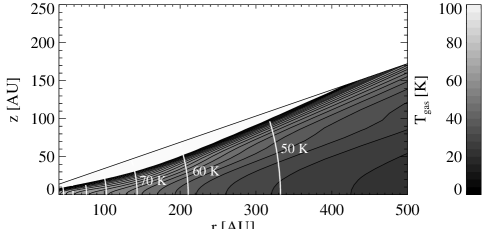
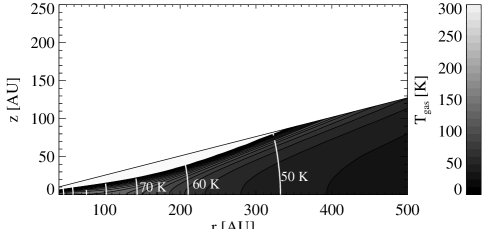
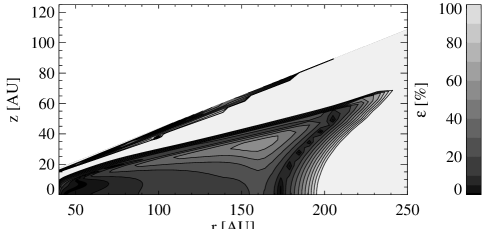
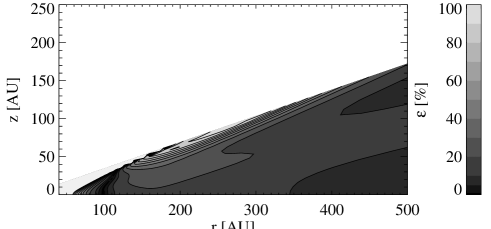
Fig. 19 reveals that the gas temperatures throughout most of the 2 M⊕ disk model stay well below 100 K. Nevertheless the heating due to the drift velocity of dust grains through the gas leads to a hot surface layer, especially in the inner parts of the disk. Due to the lower particle densities in the M⊕ disk model this hot surface layer reaches deeper into the disk, leading to temperatures above 100 K even in the disk midplane. Most of the outer regions of the disk have nevertheless gas temperatures below 100 K (Fig. 20 note the different temperature scale).
4.4 Vega:
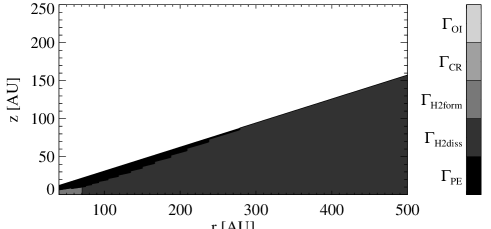
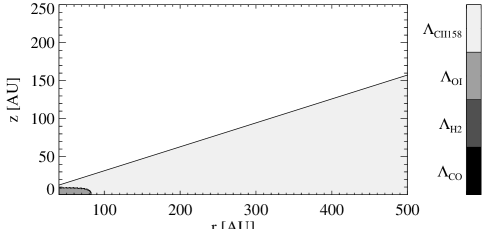
If the drift velocity is turned off, H2 dissociation and photoelectric heating take over (Figs. 21 and 23). Throughout most of the 2 M⊕ disk model H2 photodissociation is the main heating source. Only in the uppermost layers photoelectric heating by the micron-sized grains become important. As already pointed out in Sect. 2.1, due to the large size of the dust grains, the photoelectric heating rate is 2 to 3 orders of magnitude lower than in molecular clouds with typical ISM grains. The main energy loss for this disk model occurs via the [C ii] m fine structure line. Only in the densest parts of the disk midplane the [O i] fine structure lines are more efficient in radiating away the energy (Fig. 22).
If we now reduce the disk mass by a factor 10, the [C ii] m fine structure line is the sole remaining cooling process (see Fig. 24). On the other hand, Fig. 23 shows that the heating takes place via ejection of photoelectrons from the large dust grains (inner part of the modelled disk) and H2 photodissociation (outer parts of the disk).
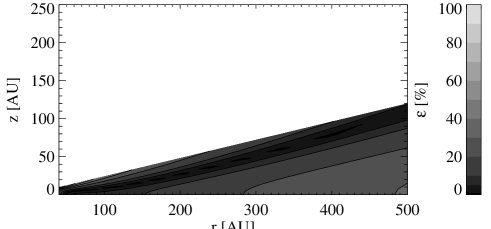
The resulting temperature structure of both disk models, the 2 M⊕ and the M⊕ disk model, is shown in Figs. 25 and 26. The hot surface layers, which we found for the models including the grain drift velocity, have now vanished. The whole disk models have moderate temperatures between 10 and 100 K. Even though the gas temperatures are in the same range as the dust temperatures, they do not show the same structuring in the disk models. While the dust temperature depends only on the distance from the star, the gas temperature depends on the particle densities and chemical structure of the disk.
5 The gas temperature: analytical approximations
In the inner core of the 2 M⊕ Pictoris disk all carbon is in the form of CO, hence radiation loss by the rotational lines of CO is the main cooling process. On the other hand the main heating process is gas heating due to the drift of dust grains through the gas.
In Sect. 2.1 we find that the analytical formula of McKee et al. (McKee (1982)) is a good approximation for the detailed statistical equilibrium CO cooling rate, even at low temperatures. The density is always larger than the critical density of McKee et al. (McKee (1982))
| (44) |
which is a fit parameter in their formula and therefore different from the critical densities derived in this paper for each CO rotational line. We equate their Eq.(5.5a) modified by a factor of (see Fig. 5) to our Eq.(27). This gives
| (45) |
where is the CO abundance, the dust-to-gas mass ratio, the total gas density, and and are the grain radius and the material density of the dust grains respectively. Fig. 27 shows the relative error of this approximation throughout the inner disk regions.
CO is photodissociated in the Vega disks and furthermore carbon is mainly ionized. In the presence of drift velocity heating, we can thus make the simplifying approximation , [C ii] fine structure line cooling equals drift velocity heating for the upper disk layers. For low gas temperatures the population number of the upper C ii level is approximately . This leads to the expression
| (46) |
for the approximated gas temperature. Fig. 28 illustrates that this approximation can be used throughout huge parts of the Vega M⊕ disk model. Moreover it holds in the cool outer regions of the Vega M⊕ disk model.
If we neglect drift velocity heating in these models, we can approximate the gas temperature in the inner parts of the M⊕ model by simply assuming , [C ii] fine structure line cooling equals photoelectric heating. For low gas temperatures we derive
| (47) |
This approximation allows to calculate the disk temperature throughout the whole Vega M⊕ model with an accuracy better than about 25% (Fig. 29).
6 The gas chemistry
In order to investigate the temperature dependence of our chemical network, we calculate the same models as discussed in Sect. 4 but with the assumption .
To illustrate the effect of the gas temperature on the disk chemistry, we show in Fig. 30 and Fig. 31 the CO abundances in the Pictoris 2 M⊕ model with the approximation and with derived from the heating/cooling balance. The difference in CO abundance is very small and the CO mass in these models is and M⊕ respectively.


This shows that gas chemistry does not change very much for gas temperatures below 300 K. Above this threshold reactions with an activation barrier start to become important and they can change the overall chemistry. Table 4 gives the mass of material in certain temperature ranges. The mass of material hotter than 300 K is negligible in our disk models except in the M⊕ Vega model with drift velocity heating, where it is 5% of the total mass. On the other hand a large amount of the total mass can have gas temperatures below 30 K. Note that a low gas temperature is a necessary, but not sufficient criterium for freezing out of molecules. For this process the dust temperature plays a crucial role. The mass of material hotter than 100 K is the mass that can be traced by H2 lines assuming the disks to consist of purely molecular hydrogen. This is at least for the Pictoris models with the heating due to the drift velocity of dust grains a significant percentage of the total disk mass.
| central | M | M | M | M | |
| star | total | K | K | K | |
| Pic | on | 2.0 | 0.71 | ||
| Pic | on | 0.2 | |||
| Pic | off | 2.0 | 0.0 | 1.96 | |
| Pic | off | 0.2 | 0.0 | 0.14 | |
| Vega | on | 2.0 | 0.52 | ||
| Vega | on | 0.2 | 0.00 | ||
| Vega | off | 2.0 | 0.0 | 0.0 | 1.17 |
| Vega | off | 0.2 | 0.0 | 0.0 | 0.16 |
7 Discussion
Throughout the whole paper we discussed the two extreme cases for the dust grain drift velocity. But is there not a better and more accurate way to derive the drift velocity?
Klahr & Lin (Klahr (2001)) solved the equation of motion for dust grains rotating in a gaseous disk around a central star. For the implementation of the hydrodynamical drag, it is assumed that the dust grains are in the Epstein regime, which means that their friction time scale is much smaller than their orbital timescale. Unfortunately this is not fullfilled for the m grains in our disk models. Nevertheless using their Eq.(17) for the radial drift velocity, we end up with drift velocities which are a factor 2-5 lower than the ones we applied in our models. Since the drift velocity enters cubic in the respective heating term, this would lead to heating rates that are up to a factor 125 smaller than the ones assumed in our models. But if we use m grains instead of m grains, we end up with drift velocities that are even somewhat larger than ours.
To summarize, it is obvious that the heating term due to the drift velocity of dust grains through the gas depends strongly on the exact drift velocity. Unfortunately the radial drift velocity depends also strongly on particle size, which we cannot fix exactly. Moreover the implementation of a more realistic hydrodynamical drag term may change the resulting radial drift velocity considerably. In any case our two approaches and will bracket the real solution.
8 Conclusion
The models presented in this paper are a link between the PDR models for dark molecular clouds (Tielens & Hollenbach Tielens2 (1985); Sternberg & Dalgarno Sternberg (1989)) and massive flaring disk models used for T Tauri stars and Herbig Ae/Be stars (Aikawa et al. Aikawa (1996); Chiang & Goldreich Chiang (1997); D’Alessio et al. Alessio (1998)). The optically thin non-flaring disk models for young A stars presented by Kamp & Bertoldi (Kamp (2000)) are extended to self-consistently include the calculation of the gas temperature from a detailed heating/cooling balance.
The model calculations reveal that gas and dust temperatures in these disks are completely different. Nevertheless there is still a coupling between them due to the IR pumping of O i fine structure and CO rotational levels. Since the disks are optically thin, this coupling does not result in , but instead in level population numbers that adjust to the local IR radiation field, which is several orders of magnitude below the local Planck function.
Since atomic and molecular transition probabilities are known with sufficient accuracy, the main uncertainty in the calculation of the gas temperature are the physical parameters of the dust grains, like the size and the composition. Except for the bright star Pictoris, where the silicate feature at m is clearly detected (Telesco & Knacke Telesco (1991); Aitken et al. Aitken (1993)), we lack observations that could constrain the composition of the dust grains in these disks.
The chemical structure of these disks does not change significantly, when we drop the approximation and calculate the gas temperature from a detailed heating/cooling balance. Hence the main results of Kamp & Bertoldi (Kamp (2000)) concerning the CO abundances in these disks do not change.
The gas temperature, the infrared radiation field and the statistical equilibrium calculations are crucial for the calculation of emission lines from these models. The results of the SE calculations show that level population numbers can easily be orders of magnitude different from thermodynamical equilibrium.
We will present emission line profiles and possible tracers of the gas in these disks in a forthcoming paper.
Acknowledgements
We are indebted to F. Bertoldi and H. Holweger for many helpful discussions. Furthermore we benefited greately from discussions with E. van Dishoeck on the heating/cooling network. We thank E. van Dishoeck, Xander Tielens and David Hollenbach for a critical reading of the manuscript and helpful comments. This research has been supported by the “Deutsche Forschungsgesellschaft” under grant Ho 596/35-2 and by a Marie Curie Fellowship of the European Community programme “Improving Human Potential” under contract number MCFI-1999-00734.
References
- (1) Aikawa Y., Miyama S.M., Nakano T., Umebayashi T., 1996, ApJ 467, 684
- (2) Aitken D.K., Moore T.J.T., Roche P.F., Smith C.H., Wright C.M. 1993, MNRAS 265, L41
- (3) Artymowicz P., 1988, ApJ 335, L79
- (4) Artymowicz P., Clampin M., 1997, ApJ 490, 863
- (5) Augereau J.C., Lagrange A.M., Mouillet D., Ménard F., 2001, A&A 365, 78
- (6) Backman D., Paresce F., 1993, in: Levy E.H., Lunine J.I. (eds.) Protostars & Planets iii, University of Arizona Press, p.1253
- (7) Bakes E.L.O., Tielens A.G.G.M., 1994, ApJ 427, 822
- (8) Bell K.L., Berrington K.A., Thomas M.R.J., 1998, MNRAS 293, L83
- (9) Black J.H., 1987, in: D.J. Hollenbach, H.A. Thronsen (eds.) Interstellar Processes, D. Reidel Publishing Company, p.731
- (10) Black J.H., Dalgarno A., 1976, ApJ 203, 132
- (11) Burke J.R., Hollenbach D.J., 1983, ApJ 265, 223
- (12) Chiang E.I., Goldreich P., 1997, ApJ 490, 368
- (13) Chini R., Krügel E., Kreysa E., 1990, A&A 227, L5
- (14) Clavel J., Viala Y.P., Bel N., 1978, A&A 65, 435
- (15) D’Alessio P., Cantó J., Calvet N., Lizano S., 1998, ApJ 500, 411
- (16) Dent W.R.F., Greaves J.S., Mannings V., Coulson I.M., Walther D.M., 1995, MNRAS 277, L25
- (17) Draine B.T., 1978, ApJSS 36, 595
- (18) Draine B.T., Bertoldi F., 1999, in: P. Cox, M.F. Kessler (eds.) The Universe as seen by ISO, ESA SP-427, p.553
- (19) Dutrey A., Guilloteau S., Duvert G., et al., 1996, A&A 309, 493
- (20) Feuerbacher B., Fitton B., 1972, J.Appl.Phys. Vol.43, No.4, 1563
- (21) Gilman R.C., 1972, ApJ 178, 423
- (22) Habing, H., 1968, Bull. Astr. Inst. Netherlands 19, 421
- (23) Hayashi C., Nakazawa K., Nakagawa Y. 1985, in: D.C. Black, M.S. Mathews (eds.) Protostars & Planets II, University of Arizona Press, p.1100
- (24) Hollenbach D.J., McKee C.F., 1979, ApJSS 41, 555
- (25) Hollenbach D.J., McKee C.F., 1989, ApJ 342, 306
- (26) Holweger H., Rentzsch-Holm I., 1995, A&A 303, 819
- (27) Holweger H., Hempel M., Kamp I., 1999, A&A 350, 603
- (28) Jaquet R., Staemmler V., Smith M.D., Flower D.R., 1992, J.Phys.B, 25, 285
- (29) Jolly A., McPhate J.B., Lecavelier A., et al., 1998, A&A 329, 1028
- (30) Kamp I., Bertoldi F., 2000, A&A 353, 276
- (31) Kamp I., van Zadelhoff G.-J., 2000, to appear in: A. Penny, P. Artymowicz, A.-M. Lagrange, S. Russell (eds.) Planetary Systems in the Universe: Observation, Formation and Evolution, Proceedings of the IAU Symposium 202, 7.-10. August, Manchester (UK)
- (32) Klahr H., Lin D.N.C., 2001, ApJ in press
- (33) Kurucz R.L., 1992, Rev. Mex. Astron. Astrofis. 23, 181
- (34) Launay J.M., Roueff E., 1977, A&A 56, 289
- (35) Le Bourlot J., Pineau des Forêts G., Flower D.R., 1999, MNRAS 305, 802
- (36) Liseau R., 1999, A&A 348, 133
- (37) Mc Kee C.F., Storey J.W.V., Watson D.M., Green S., 1982, ApJ 259, 647
- (38) Pantin E., Lagage P.O., Artymowicz P., 1997, A&A 327, 1123
- (39) Press W.H., Teukolsky S.A., Vetterling W.T., Flannery B.P., 1997, Numerical Recipes in Fortran 77, Cambridge University Press, 351
- (40) Roberge A., Feldman P.D., Lagrange A.M., et al., 2000, ApJ 538, 904
- (41) Sandford S.A., Allamandola L.J., 1990, Icarus 87, 188
- (42) Schinke R., Engel V., Buck U., Meyer H., Diercksen G.H.F., 1985, ApJ 299, 939
- (43) Stephens T.L., Dalgarno A., 1973, ApJ 186, 165
- (44) Sternberg A., Dalgarno A., 1989, ApJ 338, 197
- (45) Telesco C.M, Knacke R.F. 1991, ApJ 372, L29
- (46) Thi W.F., Blake G.A., van Dishoeck E.F., et al., 2001, Nature 409, 60
- (47) Tielens A.G.G.M., 1983, ApJ 271, 702
- (48) Tielens A.G.G.M., Hollenbach D.J., 1985, ApJ 291, 722
- (49) van der Bliek N.S., Prusti T., Waters L.B.F.M., 1994, A&A 285, 229
- (50) Watson W.D., 1972, ApJ 176, 103
- (51) Welsh B.Y., Craig N., Crawford I.A., Price R.J., 1998, A&A 338, 674
- (52) Yamashita T., Handa T., Omodaka T. et al., 1993, ApJ 402, L65