VLBA Polarimetry of Three Powerful
Radio Galaxy Cores
Abstract
We present sensitive, high dynamic range, Very Long Baseline Array (VLBA) polarimetric observations of the cores of three powerful radio galaxies: 3C 166, 3C 236 and 3C 390.3. Significant polarization is detected in one source (3C 166) allowing us to map out the Faraday Rotation Measure (RM) distribution and projected magnetic field direction. The inner jet of 3C 166 is found to have a rest frame RM of 2300 rad m-2, similar to those found in quasars cores. No polarized flux was detected from the other two sources, but in both counterjets are seen. The counterjet in 3C 236 was previously known, but the detection in 3C 390.3 is a new discovery. We suggest that the low fractional polarization in radio galaxy cores is the result of Faraday depolarization by ionized gas associated with the accretion disk. The lower polarization of radio galaxy cores compared to quasars is then naturally explained by unified models as a result of the viewing angle.
1 Introduction
The cores of high power (FRII) radio galaxies typically have quite low fractional polarization (0.6%) on arcsecond scales (e.g., Rudnick, Jones & Fiedler 1986, Rusk 1988). This is in contrast to the properties of quasar cores which are generally more highly polarized on arcsecond scales (2–5%). Rudnick et al. (1986) have speculated that the low polarization of radio galaxy cores could be due to optical depth effects of self-absorbed emission, highly randomized internal magnetic fields, or Faraday depolarization by a highly tangled screen.
Multi-frequency polarimetry with the Very Long Baseline Array (VLBA) telescope has recently revealed absolute Faraday Rotation Measures (RMs) in excess of 1000 rad m-2 in the central regions of 7 out of 8 strong quasars studied (e.g., 3C 273, 3C 279 – Taylor 1998, 2000). Beyond a projected distance of 20 pc, however, the jets are found to have RM 100 rad m-2. The RM measures the density weighted magnetic field along the line of sight. Such sharp RM gradients cannot be produced by cluster or galactic-scale magnetic fields, but rather must be the result of magnetic fields organized over the central 1–100 pc. Taylor (2000) postulates that the cores and inner jets of quasars are viewed through ionized gas associated with the nuclear region. According to the unified scheme (see review by Antonucci 1993) linking quasars to FRII radio galaxies, one expects that the jet components of FRII radio galaxies within 100 pc of the center of activity will be viewed through a deep Faraday screen. This would explain the low fractional polarization of radio galaxy cores. With the high resolution afforded by VLBI observations it might be possible to resolve the Faraday screen and recover some polarized flux density. Furthermore, once the jet components move farther from the nuclear environment the Faraday depth should drop, and it may be possible to measure both significant polarization from the jet and still high RMs.
Very little is known about the parsec-scale polarization properties of classical FRII radio galaxy cores. To investigate their polarization properties, and to image their RM distribution in the central parsecs, we observed three FRII radio galaxies having relatively strong cores and some integrated fractional polarizations: 3C 166 (B0642+214), 3C 236 (B1003+351), and 3C 390.3 (B1845+797). All three sources are classical FRII radio galaxies, and 3C 236, with a size of 4 Mpc, has the added distinction of being one of the giant radio galaxies.
We assume H km s-1 Mpc-1 and q0=0.5 throughout.
2 Observations and Data Reduction
The observations, performed on 2000 July 29-30, were carried out at 4.517, 4.547, 4.867 and 4.897 GHz (see Table 1) using the 10 element VLBA and a single antenna from the VLA111The National Radio Astronomy Observatory is operated by Associated Universities, Inc., under cooperative agreement with the National Science Foundation.. Unfortunately, due to a hardware fault, the VLBA antenna at Los Alamos was unable to participate in this experiment. Right- and left-circular polarizations were recorded using 2 bit sampling across bandwidths of 4 MHz at each frequency. The VLBA correlator produced 16 frequency channels across each 4 MHz band during every 2.1 s integration.
Amplitude calibration for each antenna was derived from measurements of the antenna gain and system temperatures during the run. No atmospheric opacity corrections were performed. Fringe fitting was performed on the strong calibrator 1928+738 to determine the delays to each station, and on 3C 279 to determine the R-L delay difference (caused by differences in the electronic path length between the two orthogonally polarized receivers) on the reference antenna (FD). Failure to properly set the R-L delay would cause the polarization angles to appear to drift with time. No global fringe fit was performed as the solutions found were consistent with 0 residual delay to within the scatter of those solutions.
The data were averaged over 20 s intervals and edited and self-calibrated using AIPS and DIFMAP (Shepherd, Pearson & Taylor 1994, Shepherd 1997) in combination. Feed polarizations of the antennas were determined using the unpolarized calibrator OQ 208 and the AIPS task LPCAL. We assumed that the VLBA antennas had good-quality feeds with relatively pure polarizations, which allowed us to use a linearized model to fit the feed polarizations. The absolute polarization angle calibration was performed by comparing the VLBA measurements of the calibrators 1308+326 and 1749+096 to near simultaneous measurements made with the VLA as part of the VLA polarization monitoring program (http://www.aoc.nrao.edu/smyers/calibration/). Both the VLA and VLBA data (after correction) at 4867 MHz, are given in Table 2. As a check, we also imaged 3C 279 in I, Q and U. This quasar has a strongly polarized jet component (C4) with a moderately low Faraday Rotation Measure (RM). The polarization angle and RM of this component change slowly with time (Zavala & Taylor 2001) and our measurement of 84∘ is within a few degrees of other observations carried out at 8 GHz and above in the summer of 2000 (R. Zavala, private communication).
3 Results
We present total intensity images for 3C 166, 3C 236 and 3C 390.3. Polarized emission was detected only in 3C166, and for this source we further present its polarization properties and RM distribution.
3.1 3C 166
This radio source was identified by Bridle & Fomalont (1978) with a 17.7 magnitude galaxy at z=0.2449 in a cluster (Wyndham 1966). Spangler & Bridle (1982) showed the radio structure to have a classical double morphology, but with rather dissimilar radio lobes. Further high resolution VLA observations confirmed that 3C 166 has an FRII morphology with edge brightened lobes extending north-south over 50 arcsec (170 kpc) (Leahy & Williams 1984; Neff, Roberts & Hutchings 1995). No evidence of jets is seen in any of the VLA images. The core is quite prominent, containing 475 mJy (Rudnick et al. 1986) at 5 GHz compared to the integrated flux density of 970 mJy (Gregory & Condon 1991; Zukowski et al. 1999). We chose to observe 3C 166, primarily based on the relatively high fractional polarization of the core of 1.7% (8 mJy of polarized flux density) at 5 GHz (Rudnick et al. 1986).
On the parsec scale, we recover 395 mJy (83%) of the kiloparsec-core flux density at 5 GHz. We assume the parsec-scale core is the compact component at the very southern end of the jet. Model-fitting with elliptical Gaussians shows this component contains 135 mJy, and the rest of the emission is in a one-sided jet that starts out in position angle 26∘ and curves gradually toward due North (Fig. 1). A total of 4 mJy of linearly polarized flux is detected on the parsec scale, mostly from the jet. The core is very weakly polarized (0.2%), but the polarization increases quickly in the inner jet (2%), and reaches 12% 8.5 mas out from the core. The electric vector polarization angle (EVPA) is shown in Fig. 1 to be fairly well ordered and transverse to the jet direction. The same EVPA was found for the VLA core by Rudnick et al. (1986). By fitting the EVPA as a function of wavelength-squared we derive the RM distribution (Fig. 2). The RMs in the jet have a mean value of 32 30, basically consistent with little or no RM contribution from the host galaxy. After correcting for the RM, the projected magnetic field direction beyond 10 pc from the core is very nearly parallel to the jet direction. The inner jet, just north of the core, however, exhibits substantial RMs of 1500 rad m-2. Assuming these RMs are produced in the rest frame of the source then correcting by (1+z)2 yields an intrinsic RM of 2300 rad m-2. After correcting for the RM, the projected magnetic field in the inner jet is nearly perpendicular to the axis of the jet. A similar transition from a perpendicular to a parallel magnetic field configuration, with similar RM in the inner jet, has been observed in the nucleus of the lobe-dominated quasar 3C 245 (Hough, Barth, & Yu 1998; Hough, Homan, & Wardle 2001).
There is no sign of any counterjet emission to the southeast over a comparable distance from the core as the jet extends. We can estimate an upper limit to the counterjet emission over a rectangular region matched to the outer northwest jet that contains 30 mJy. Using a region covering 130 beam areas (820 ) and the rms image noise of 80 Jy per beam, we find an upper limit of 10 mJy to the counterjet flux density. Thus the lower limit on the jet-to-counterjet brightness ratio is 3. Within 3 mas of the core the jet-to-counterjet limit is 50.
3.2 3C 236
The “giant” radio galaxy 3C 236 was studied on a vast range of angular scales by Barthel et al. (1985). Observations of 3C 236 with the Westerbork Synthesis Radio Telescope at 1.4 GHz (23′′x13′′ beam) revealed the presence of twin outer lobes that give the source an overall angular size of 42 arcminutes. Adopting the redshift = 0.1005 from Hill, Goodrich, & DePoy (1996), the projected linear size of 3C 236 is then 4.4 Mpc, making it the largest radio galaxy known. The northwest lobe has a central ridge with a peak that may be a “hot spot” along PA , and the southeast lobe has a weak terminal “hot spot” fed by a segment of emission all along PA . VLBI maps at 1.6 GHz and 5 GHz (Schilizzi et al. 2001) show structures on scales between 1 mas and 1′′ on both sides of the compact component, presumed to be the “core”, that can be compared to our new 5 GHz VLBA image. This inner double does not connect up with the outer hot spots, leading to the classification of 3C 236 as one of the “double-double” radio sources (Schoenmakers et al. 1999, 2000). O’Dea et al. (2001) present HST observations, and based on dynamical and spectral aging arguments, suggest that the central engine powering the radio source turned off for 107 yr, and has only recently been restarted.
Our VLBA image at 5 GHz is displayed in Fig. 3. While the overall structure is suggestive of an “S”-pattern, the source is decidedly asymmetric. The innermost structure is that of a typical “core-jet”, with a 217-mJy core and a 51-mJy one-sided jet extending 25 mas to the northwest. The jet is not straight, but rather shows undulations in PA , , , , and (the latter two being in the outer 10 mas of the jet where it is faintest before disappearing from view). There is no sign of any counterjet emission to the southeast over a comparable distance from the core. In fact, we can estimate an upper limit to the counterjet emission over a rectangular region matched to the northwest jet. Using a region covering 40 beam areas (210 ) and the rms image noise of 93 Jy per beam, we find an upper limit of 3.8 mJy to the inner counterjet flux density. Thus the lower limit on the jet-to-counterjet brightness ratio is 13.5. The Barthel et al. (1985) 5 GHz VLBI map shows the first few milliarcseconds of the jet in the same orientation as our image (a “counterjet” feature on their very low-dynamic-range image is clearly not real).
On the northwest side, there is a gap of nearly 40 mas between the end of the inner jet and a diffuse 41-mJy component. The center of this diffuse component (B1) lies about 70 mas from the core (B2) in PA and has a mean diameter of 20 mas. Its position angle is thus significantly greater than the mean position angle of the inner jet ( ).
On the southeast side, there is a 20-mJy bent counterjet segment that begins about 41 mas from the core in PA and ends about 59 mas away in PA . Beyond this, there is a large extended region at 130 mas in PA . Due to insufficient short baselines we cannot properly estimate the flux density of this extended component, or be certain that we have faithfully reproduced its morphology (Fig. 4). The shape and location of this component are in rough agreement with a 1.6 GHz EVN+MERLIN image (Schilizzi et al. 2001).
Our northwest diffuse feature corresponds to feature “B1” on the 1.6 GHz VLBI map of Barthel et al. (1985), and our curved counterjet segment and extended feature 130 mas from the core correspond to portions of their elongated feature “C”. The 1.6 GHz VLBI map also exhibits a diffuse halo in which these central features are imbedded, and a compact component “A” in a large diffuse patch nearly 1′′ to the northwest. The 1.6 GHz images of Schilizzi et al. (2001) show the same features that we see on our 5 GHz VLBA image, with more low-level emission in the vicinity of our outer 130 mas counterjet side feature and further low-level emission 500 mas to the northwest.
The overall picture in 3C 236 seems to suggest an initial jet (and a presumably invisible counterjet) that, while undulating, have an average position angle less than emission that appears beyond the jet and counterjet gaps. This suggests some mechanism on the scale of 25 mas (40 pc) is responsible for jet bending which redirects the flows in directions that - quite remarkably - point directly to large-scale features 2 Mpc away on either side of the source.
No polarized flux was detected in our 5 GHz VLBA observations. The polarized intensity image has an rms noise of 45 Jy per beam. At 5 GHz, Rusk (1988) observed 0.9% polarization corresponding to 13 mJy of linearly polarized flux density in the nucleus of 3C 236. Since Rusk (1988) presented a 15 GHz VLA image that suggests the polarized arcsecond-scale emission comes mainly from the northwestern of two components in a close 1′′ double, we must conclude that there is very little polarization on the size scales sampled by our observations. VLBA observations at a lower frequency may prove useful in detecting this polarized flux on scales approaching 0.5 to 1.0 arcsecond. It is interesting to note that Rusk (1988) found the electric vector position angle for the 5 GHz VLA core of 3C 236 to be , well-aligned with the main structural axis of the source.
3.3 3C 390.3
3C 390.3 is a broad line nearby FRII radio galaxy (z=0.0561 – Hewitt & Burbidge 1991), characterized by prominent lobes and hot spots with fine radio structure (Leahy & Perley 1995). Alef et al. (1996) detected a couple of faint jet features between the core and the northwest lobe on their VLA image; there is also a bright portion of the jet visible in the lobe feeding a compact hot spot. This source was also one of the first sources to be found to exhibit double-peaked emission lines (Eracleous & Halpern 1994). By modeling the double-peaked emission lines with a disk they derive an inclination for the disk of 26 degrees. Assuming that the radio jets are perpendicular to the disk then the angle between the line-of-sight and the jet axis, , is also 26∘. On the basis of a four epoch imaging monitoring, Alef et al. (1996) proposed superluminal motion of the order of 0.7 mas yr-1 along the one-sided milliarcsecond radio jet, corresponding to = 2.7 for our choice of the cosmological parameters.
Our naturally weighted VLBA image, shown in Fig. 5, is in good agreement with previous results from the literature. A taper has also been applied to increase sensitivity to some faint extended components. The total flux in our image, dominated by 206 mJy in a compact core and 120 mJy in a jet, recovers 94% of the core peak flux density in the VLA image shown in Alef et al. (1996). The milliarcsecond morphology is dominated by the core-jet structure, aligned in position angle , and consistent with the large scale orientation projected in the plane of the sky. The jet is edge-darkened and its brightness drops considerably at 10 mas from the peak emission. A uniformly weighted image convolved with a circular beam with = 0.8 mas (not shown here) shows that the centrally peaked jet in Fig. 5 is actually the result of a sequence of knots of similar brightness, almost perfectly aligned in p.a. . A gap in the parsec-scale jet emission at 3.5 mas from the peak brightness is also evident.
The very high sensitivity of the image presented here allows us to follow the jet out to 20 mas. A diffuse counterjet feature, significant at 7, is visible in Fig. 5 at 14.7 mas. At this distance from the core the jet-to-counterjet brightness ratio is 2. The region where the counterjet is undetected covers 10 beam areas (40 ). Given the rms image noise of 82 Jy per beam, we find an upper limit of 0.8 mJy to the inner counterjet flux density. Thus the lower limit on the inner jet-to-counterjet brightness ratio is 140.
No polarized flux was detected in our 5 GHz VLBA observations. The polarized intensity image has an rms noise of 60 Jy per beam.
4 Discussion
4.1 Constraints from Doppler Boosting
For a simple relativistic beaming model in which the jet and counterjet are intrinsically identical, the theoretical jet-to-counterjet brightness ratio is = , where is the speed parameter, is the angle of the jet axis to our line-of-sight, the index =2 for a continuous jet, and a spectral index = 0.5 () is assumed.
In 3C 166 the jet brightness drops smoothly along the parsec-scale jet. From our images we derived a jet-to-counterjet ratio changing from 50 at 3 mas, to 32 at 10 mas, and finally reaching 4 at 30 mas. The constraint in the proximity of the core is 0.67, leading to a maximum viewing angle .
In 3C 236, for the inner bright jet segment, we find = 0.48 which, as approaches one, gives a maximum angle to the line-of-sight = . On the basis of its immense projected linear size, Barthel et al. (1985) have argued that the overall source axis must not lie far from the plane of the sky. The apparently contradictory requirements on the source orientation based on observations of the smallest and largest scales in 3C 236 can be reconciled by assuming overall jet curvature on the order or more; such curvature may be plausible in 3C 236, given the bends of at least in the plane of the sky discussed in §3.2.
Under the same assumptions the high brightness asymmetry of the inner VLBI jet in 3C 390.3 leads to = 0.76, which implies = 0.76 and a maximum viewing angle for 1, consistent with the broad line nature of the host galaxy. This limit for is also in reasonable agreement with that obtained from the superluminal motion proposed by Alef et al. (1996), i.e. for . The corresponding is 0.94. The presence of the counterjet feature at mas yields . The very good alignment between the parsec and kiloparsec scale morphology suggests that jet deceleration may be relevant beyond mas from the core, i.e. 12 pc projected on the plane of the sky.
We compared our images of 3C 390.3 to those presented in Alef et al. (1996), in order to confirm their proposed superluminal motion. It is tempting to associate their component located at 5 mas from the core (see Fig. 3 in Alef et al. 1996) with our jet component located at 9.3 mas, just before the brightness drops. However the morphology of the milliarcsecond jet in Fig. 5 suggests that it is actually the blend of various knots, unresolved at the present resolution, and this makes any component identification uncertain. In spite of this difficulty, it is interesting to note that the inner portion of the jet (i.e., before the sharp the drop in brightness) has clearly stretched over the last 11.28 years, going from 6 mas to mas. This corresponds to a global expansion of 0.35 mas yr-1, i.e. superluminal motion with apparent tranverse speed c. This constrains the beaming parameters to for , and is in good agreement with the limit derived on the basis of the jet-to-counterjet asymmetry within 10 mas of the center of activity.
We note that other explanations for the observed one-sided morphologies of these radio galaxies are also possible. These include differences in the environment from side-to-side, and even free-free absorption from the circumnuclear torus as observed in 3C 84 by Walker et al. (2000).
4.2 Implications of the RM Structure in 3C166
Despite all three sources having comparable jet brightnesses, linearly polarized flux density was only detected on the parsec scale from 3C 166. Another intriguing difference between the sources is that 3C 236 and 3C 390.3 have detectable counterjets. In addition, while we did not detect any polarized emission in the inner 100 pc of the 3C236 jet that we were able to image, Rusk (1988) found significant arcsecond-scale polarization in a component roughly 1 kpc from the core. One way to explain these differences in light of the unified schemes is to require that the jet in 3C 166 is oriented more closely to the line-of-sight than the jets of the other two sources. This results in greater Faraday depths towards 3C 236 and 3C 390.3, and causes the counterjet to appear fainter due to Doppler deboosting in 3C 166. Even in 3C 166 the core itself is depolarized and the inner jet exhibits RMs of 2300 rad m-2. This is consistent with the detection of counterjet components in 3C 236 and 3C 390.3. A minor problem with this picture is that the jet-to-counterjet asymmetry close to the core is similar for all three sources (see Table 3). However, if the jet starts out highly relativistic and then slows after traveling 20 pc then a counterjet could be detected for those systems oriented closer to the plane of the sky. This possibility is supported by our argument for deceleration in the jets of 3C 390.3 (see §4.1 above).
5 Conclusions
We have detected linearly polarized flux on the parsec scale for one (3C 166) of three powerful radio galaxy cores observed. In 3C 166 we find substantial RMs (2300 rad m-2) and RM gradients. We suggest that Faraday depolarization is the most likely explanation for the low fractional polarization of the cores of radio galaxies. These conclusions are rather tentative considering the small number of sources involved in our study. A better test of this explanation and unified schemes would be to consider a complete sample of powerful radio galaxies and quasars chosen on the basis of an unbeamed property. One such sample that could warrant further study are the FRII lobe-dominated quasars from the 3CR catalog (Hough, Barth & Yu 1998, Hough et al. 2001).
References
- (1)
- (2) Alef, W., Wu, S. Y., Preuss, E., Kellermann, K. I., & Qiu, Y. H. 1996, A&A 308, 376
- (3) Antonucci, R. 1993, ARA&A, 31, 473
- (4) Barthel, P. D., Schilizzi, R. T., Miley, G. K., Jagers, W. J., & Strom, R. G. 1985, A&A, 148, 243
- (5) Bridle, A. H., & Fomalont, E. B. 1978, AJ, 83, 704
- (6) Eracleous, M., & Halpern, J. P. 1994, ApJS, 90, 1
- (7) Gregory, P. C., & Condon, J. J. 1991, ApJS, 75, 1011
- (8) Hewitt, A., & Burbidge, G. 1991, ApJS, 75, 297
- (9) Hill, G. J., Goodrich, R. W., & DePoy, D. L. 1996, ApJ, 462, 163
- (10) Hough, D. H., Barth, E. L., & Yu, L. H. 1998, BAPS, 43, 1392
- (11) Hough, D. H., Vermeulen, R. C., Readhead, A. C. S., Cross, L. L., Barth, E. L., Yu, L. H., Beyer, P. J., & Phifer, E. M. 2001, AJ, submitted
- (12) Hough, D. H., Homan, D., & Wardle, J. 2001, in preparation
- (13) Kühr, H., Witzel, A., Pauliny-Toth, I. I. K., & Nauber, U. 1981, A&AS, 45, 367
- (14) Leahy, J. P., & Williams, A. G. 1984, MNRAS, 210, 929
- (15) Leahy, J. P., & Perley, R. A. 1995, MNRAS, 277, 1097
- (16) Neff, S. G., Roberts, L., & Hutchings, J. B. 1995, ApJS, 99, 349
- (17) O’Dea, C. P., Koekemoer, A. M., Baum, S., Sparks, W. B., Martel, A. R., Allen, M. G., Machetto, F. D., & Miley, G. K. 2001, AJ, in press
- (18) Rudnick, L., Jones, T. W., & Fiedler, R. 1986, AJ, 91, 1011
- (19) Rusk, R. E. 1988, Ph.D. Thesis, University of Toronto
- (20) Schilizzi, R. T., Tian, W. W., Conway, J. E., Nan, R., Miley, G. K., Barthel, P. D., Normandeau, M., Dallacasa, D., & Gurvits, L. I. 2001, A&A, in press (astro-ph/0012231)
- (21) Schoenmakers, A. P., de Bruyn, A. G., Rottgering, H. J. A., & van der Laan, H. 1999, A&A, 341, 44
- (22) Schoenmakers, A. P., de Bruyn, A. G., Rottgering, H. J. A., van der Laan, H., & Kaiser, C. R. 2000, MNRAS, 315, 371
- (23) Shepherd, M. C., Pearson, T. J., & Taylor, G. B. 1994, BAAS, 27, 903
- (24) Shepherd, M. C. 1997, in Astronomical Data Analysis Software and Systems VI, A.S.P. Vol. 125, eds. G. Hunt & H. E. Payne, p. 77
- (25) Spangler, S. R., & Bridle, A. H. 1982, AJ, 87, 1270
- (26) Taylor, G. B. 1998, ApJ, 506, 637
- (27) Taylor, G. B. 2000, ApJ, 533, 95
- (28) Walker, R. C., Dhawan, V., Romney, J. D., Kellermann, K. I., & Vermeulen, R. C. 2000, ApJ, 530, 233
- (29) Wyndham, J. D. 1966, ApJ, 144, 459
- (30) Zavala, R. T., & Taylor, G. B. 2001, ApJL, in press, astro-ph/0103180
- (31) Zukowski, E. L. H., Kronberg, P. P., Forkert, T., & Wielebinski, R. 1999, A&AS 135, 571

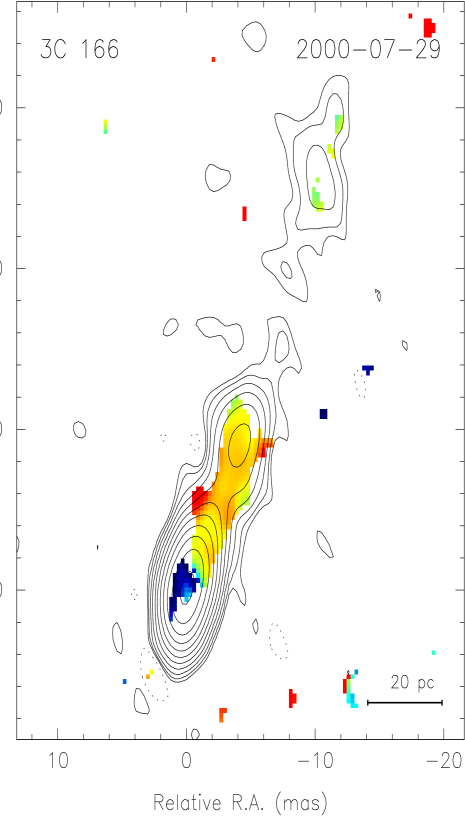
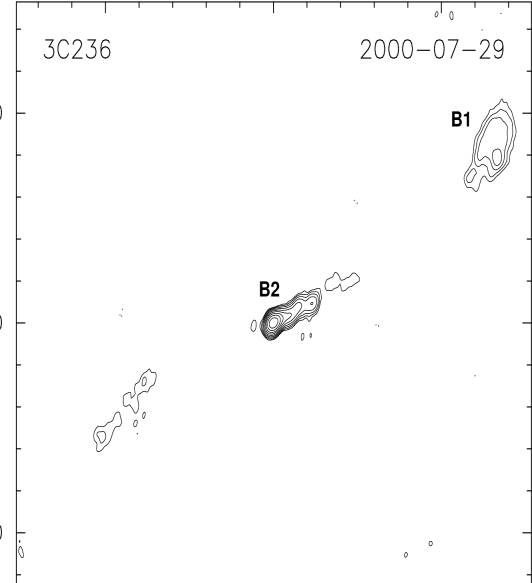
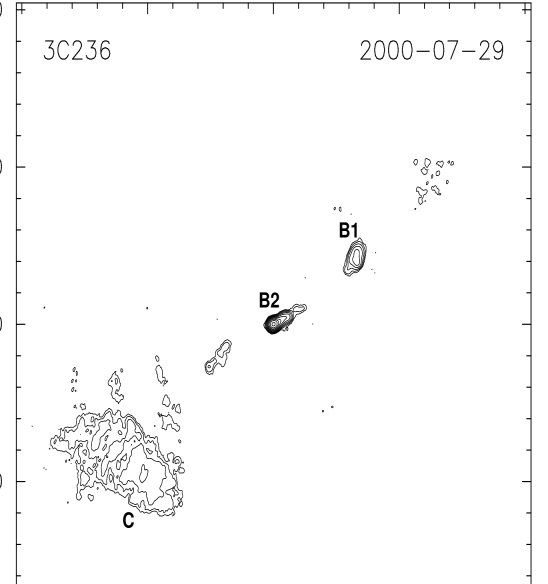
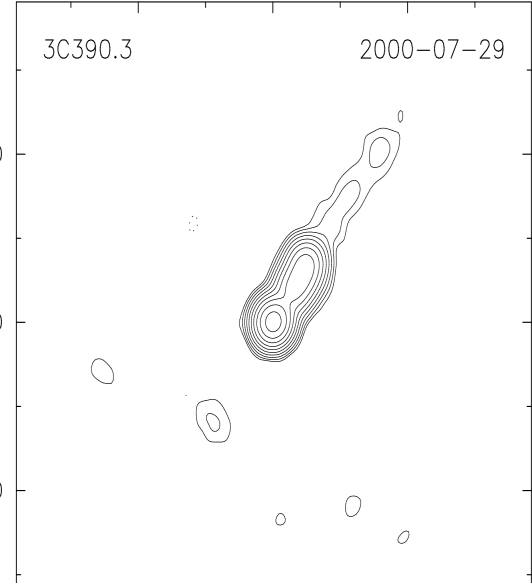
TABLE 1
VLBA Observational Parameters Source Frequency BW Scans Time (1) (2) (3) (4) (5) targets 3C 166 4.517, 4.547, 4.867, 4.897 4 10 400 3C 236 4.517, 4.547, 4.867, 4.897 4 10 400 3C 390.3 4.517, 4.547, 4.867, 4.897 4 11 440 calibrators 3C 279 4.517, 4.547, 4.867, 4.897 4 3 9 1308+326 4.517, 4.547, 4.867, 4.897 4 4 14 OQ208 4.517, 4.547, 4.867, 4.897 4 10 30 1749+096 4.517, 4.547, 4.867, 4.897 4 3 9 1928+738 4.517, 4.547, 4.867, 4.897 4 11 35
Notes to Table 1
Col.(1).—Source name. Col.(2).—Observing frequency in GHz. Col.(3).—Total spanned bandwidth in MHz. Col.(4).—Number of scans (each 4 – 40 minutes duration). Col.(5).—Total integration time on source in minutes.
TABLE 2
Polarization Angle Calibration Source (1) (2) (3) (4) (5) (6) (7) (8) 1308+326 4.9 1.768 58 13 1.633 54 14 1749+096 4.9 2.330 122 6 2.063 103 3
Notes to Table 2
Col.(1).—Source name. Col.(2).—Observing band in GHz. Col.(3).—Integrated VLA flux density in Jy. Col.(4).—Integrated VLA polarized flux density in mJy. Col.(5).—VLA polarization angle (E-vector) in degrees. Col.(6).—Integrated VLBA flux density in Jy. Col.(7).—Integrated VLBA polarized flux density in mJy. Col.(8).—VLBA polarization angle (E-vector) in degrees.
TABLE 3
Source Properties
| Property | 3C 166 | 3C 236 | 3C 390.3 |
|---|---|---|---|
| core RA (J2000) | 06h45m24s. 106 | 10h06m01s. 756 | 18h42m09s. 035 |
| Dec. (J2000) | 21°21′51″. 300 | 34°54′10″. 460 | 79°46′17″. 200 |
| redshift | 0.2449 | 0.0988 | 0.0561 |
| largest angular size | 50″ | 42′ | 3.7′ |
| largest physical size | 170 kpc | 4380 kpc | 235 kpc |
| flux density (4.9 GHz)a | 1229 mJy | 1672 mJy | 4380 mJy |
| power (4.9 GHz) | 18.0 1025 W Hz-1 | 3.9 1025 W Hz-1 | 3.1 1025 W Hz-1 |
| inner (VLBI jet) | 0.67 | 0.48 | 0.76 |
| inner (VLBI jet) | 48 | 61 | 41 |
a Total flux density from the 87 GB catalog of Gregory & Condon (1991), or in the case of 3C 390.3 from Kühr et al. (1981).