A SEARCH FOR VERY HIGH ENERGY NEUTRINOS WITH THE BAIKAL NEUTRINO TELESCOPE
Abstract
We present the results of a search for high energy neutrinos with the Baikal underwater Cherenkov detector NT-200. An upper limit on the () diffuse flux of within a neutrino energy range is obtained, assuming an behaviour of the neutrino spectrum and flavor ratio =1:2.
Institute for Nuclear Research, 60-th October Anniversary prospect,
Moscow 117312, Russia
E-mail: djilkib@pcbai10.inr.ruhep.ru
Irkutsk State University, Irkutsk, Russia
Institute of Nuclear Physics, Moscow State University, Moscow, Russia
Nizhni Novgorod State Technical University, Nizhni Novgorod , Russia
St.Petersburg State Marine Technical University, St.Petersburg, Russia
Kurchatov Institute, Moscow, Russia
Joint Institute for Nuclear Research, Dubna, Russia
DESY-Zeuthen, Zeuthen, Germany
and
KFKI, Budapest, Hungary
1 Introduction
The Baikal Neutrino Telescope is deployed in Lake Baikal, Siberia, 3.6 km from shore at a depth of 1.1 km. The optical properties of Lake Baikal deep water are characterized by an absorption length of 20 25 m, a scattering length of 2070 m and a strongly anisotropic scattering function with mean cosine of scattering angle =0.850.95. NT-200, the medium-term goal of the collaboration ?), was put into operation on April 6th, 1998 and consists of 192 optical modules (OMs). An umbrella-like frame (see Fig.1) carries 8 strings, each with 24 pairwise arranged OMs. Three underwater electrical cables and one optical cable connect the detector with the shore station.
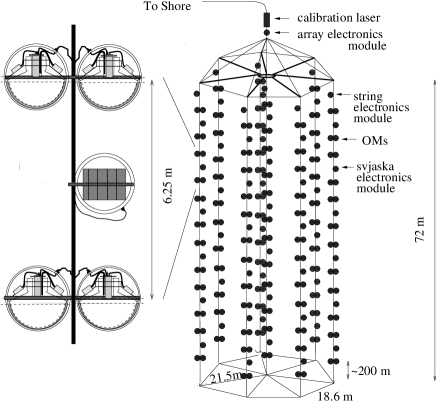
The OMs are grouped in pairs along the strings. They contain 37-cm diameter QUASAR - photomultipliers (PMs) which have been developed specially for our project ?). The two PMs of a pair are switched in coincidence in order to suppress background from bioluminescence and PM noise. A pair defines a channel.
A muon-trigger is formed by the requirement of 4 hits (with hit referring to a channel) within 500 ns. For such events, amplitude and time of all fired channels are digitized and sent to shore. Full space-angular track reconstruction is possible for muon induced events with 6 hits at 3 strings (off-line trigger 6/3). A separate monopole trigger system searches for clusters of sequential hits in individual channels which are characteristic for the passage of slowly moving, bright objects like GUT monopoles.
Table 1 illustrates NT-200 operation efficiency since April 1998 till February 2001. Shown are the data taking time T, the fraction T/Ttot of total detector operating time Ttot when data have been taken, the number of accumulated events Nev, the number of events allowing full space-angular track reconstruction Nev(6/3), the average fraction of working channels Nop/Ntot as well as the data taking time T(85%) with 85% channels in operation.
| Years | T | T/Ttot | Nev | Nev(6/3) | Nop/Ntot | T(85%) |
| (days) | (106 events) | (106 events) | (days) | |||
| 98-99 | 234 | 73% | 167 | 57 | 71% | 8 |
| 99-00 | 236 | 75% | 191 | 65 | 76% | 61 |
| 00-01 | 245 | 79% | 233 | 82 | 81% | 120 |
Using the data accumulated during first 234 livetime days between April 1998 and February 1999, 35 neutrino induced upward muons have been reconstructed ?). Although in a good agreement with MC expectation this number is by a factor 3 lower than predicted for the fully operational NT-200. The reason is that, due to unstable operation of electronics, in average only 50 - 70 channels have taken data during 1998. This is in contrast to 1999 and 2000 data taking where the stability had been improved. Ten events within a 30 degree half angle cone around nadir have been selected to set limits on the excess of the muon flux due to WIMP annihilation in the center of the Earth. Also a new limit on the flux of fast monopoles has been obtained ?).
Here we present preliminary results from a search for high energy neutrinos (E10 TeV) with NT-200 obtained from the analysis of the entire 1998 data set.
2 A search for high energy neutrinos
The main goal of large underwater neutrino telescopes is the search for extraterrestrial high energy neutrinos. Detection volume and detection area of such detectors depend on the transparency of the medium (water or ice) and the power of the source of Cherenkov radiation (high energy shower or muon), and may significantly exceed the geometrical one.
2.1 Search strategy
The used search strategy for high energy neutrinos relies on the detection of the Cherenkov light emitted by the electro-magnetic and (or) hadronic particle cascades and high energy muons produced at the neutrino interaction vertex in a large volume around the neutrino telescope. Earlier, a similar strategy has been used by DUMAND ?), AMANDA ?) and BAIKAL ?) collaborations to obtain upper limits on the diffuse flux of high energy neutrinos with relatively small detectors (SPS, AMANDA-A and NT-96, respectively). Although the limits implied by these observations are at least one order of magnitude higher then the model independent upper limit derived from the energy density of the diffuse X- and gamma-radiation ?), these results illustrate the power of used search strategy.
Neutrinos produce showers through CC-interactions
| (1) |
through NC-interactions
| (2) |
where , or , and through resonance production ?,?,?)
| (3) |
with the resonant neutrino energy GeV and cross section cm2.
We select events with high multiplicity of hit channels Nhit corresponding to bright cascades. The volume considered for generation of cascades is essentially below the geometrical volume of NT-200. A cut is applied which accepts only time patterns corresponding to upward traveling light signals (see below). This cut rejects most events from brems-cascades produced by downward going muons since the majority of muons is close to the vertical; they would cross the detector and generate a downward time pattern. Only the fewer muons with large zenith angles may escape detection and illuminate the array by their proper Cherenkov radiation or via bright cascades from below the detector. These events then have to be rejected by a stringent multiplicity cut.
The used strategy is very effective for and detection since the main fraction of neutrino energy would be transfered to electro-magnetic or/and hadronic cascades due to CC-interactions. It is less effective for detection since the main part of neutrino energy would be escaped by energetic muon from detection volume. For search preliminary result has been presented by the AMANDA experiment ?).
2.2 Data
Within the 234 days of the detector livetime, events with have been selected. For this analysis we used events with N10. The time difference between any two hit channels on the same string was required to obey the condition:
| (4) |
where are the arrival times at channels and the numbering of channels rises from top to bottom along the string.
Since April 1998 till February 1999, NT-200 operated in 3 main configurations with 77, 60 and 49 working channels, respectively. Data taking time T, the number of selected events Nev which survive cut (4) and the maximum hit multiplicity N of these events. are shown in Table 2.
| Configuration | Nop | T | Nev | N | Nthr |
| (days) | |||||
| 1 | 77 | 57.9 | 63540 | 45 | 50 |
| 2 | 60 | 145.8 | 83319 | 37 | 39 |
| 3 | 49 | 30.9 | 8719 | 24 | 26 |
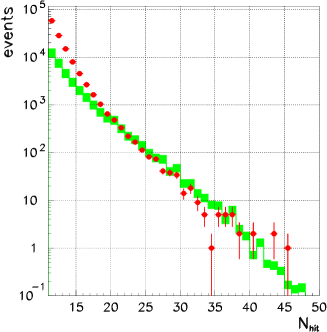
Fig.2 shows the hit multiplicity distribution of selected (dots) as well as the expected one from background high energy brems and hadronic showers produced by atmospheric muons (hatched boxes). The experimental distribution is consistent with the theoretical expectation for N18. For lower Nhit values the contribution of atmospheric muons close to horizon as well as low energy showers from pair production become important. The highest multiplicity of hit channels experimentally observed is (one event). No statistically significant excess over expectation from atmospheric muon induced showers has been observed for each of the 3 detector configurations. The detection efficiency of NT-200 for events with had been analysed by applying several less stringent cuts. It was shown that the experimental distributions are consistent with expected ones from atmospheric muons.
Since no events with are found in our data we can derive upper limits on the flux of high energy neutrinos which would produce events with
| (5) |
where the chosen values of Nthr for the 3 detector configurations are given in Table 2.
2.3 MC-simulations
Given an isotropic diffuse high energy neutrino flux with power law energy spectrum with spectral index , the number of expected events during observation time T reads
| (6) |
where is the neutrino energy, - the energy transferred to a shower, - normalization coefficient of neutrino flux and - detection volume aaaIn a case of CC- interaction in water the detector response to hadronic shower as well as to the high energy muon has been taken into account.. The index indicates neutrino types () and indicates the summation over CC and NC interactions. is the Avogadro number. Cross sections ?,?) correspond to processes (1) and (2). The neutrino absorption in the Earth has been taken into account with a suppression factor , where is the neutrino path length through the Earth in direction and according to ?,?).
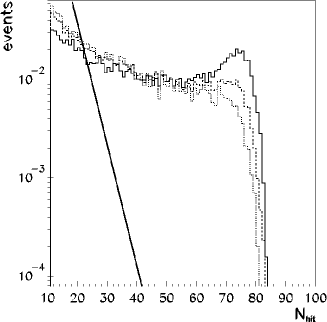
In Fig.3 we show the normalized predictions of Nhit distributions of events which survive cut (4) and would be induced by electron neutrino fluxes with =1.5, 2, 2.5. The normalized Nhit distribution of events from atmospheric muon induced showers, which has strongly steeper behaviour, is also presented.
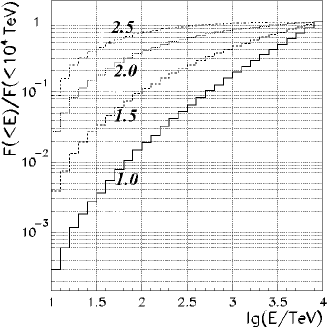
The neutrino detection energy range of NT-200 which contains, for instance, 90% of expected events, depends on the value of spectral index . Normalized energy distributions of expected events induced by electron neutrinos within energy range 10 TeV E (E104 TeV) and different are presented in Fig.4. Assuming 2 as typically expected for Fermi acceleration, 90% of expected events would be produced by neutrinos from the energy range TeV with the mean energy around 200 TeV.

The detection volume for neutrino produced events which fulfill conditions (4)-(5) was calculated as a function of neutrino energy and zenith angle . The energy dependence of the detection volume for isotropic flux with 2 is shown in Fig.5. Also shown is the detection volume folded with the neutrino absorption probability in the Earth. The value of rises from 2105 m3 for 10 TeV up to 6106 m3 for TeV and significantly exceeds the geometrical volume 105 m3 of NT-200. This is due to the low light scattering and the preserved light fronts from Cherenkov waves originating far outside the geometrical volume. Although the detection volume has been calculated without taking into account light scattering in the water, estimations show that a scattering with Ls=20 m and =0.88 (conservative values for Lake Baikal water) would cause 30% decrease of Veff for E103TeV.
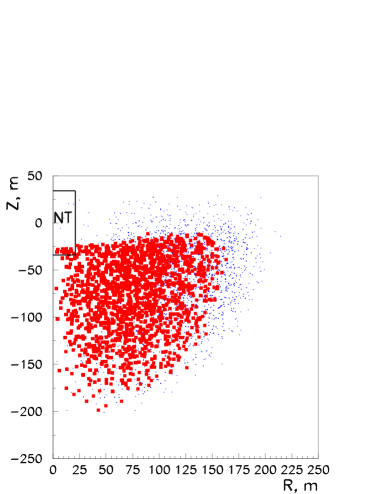
Fig.6 illustrates the difference between and . Shown here are the coordinates of neutrino interaction vertex for events which survive cuts (4) (dots) and (4)-(5) (rectangles).
2.4 The limits on the high energy neutrino fluxes
The shape of the neutrino spectrum was assumed to behave like and flavor ratio due to photo-meson production of followed by the decay for extraterrestrial sources.
Comparing the expected number of events fulfilling (4)-(5) with the upper limit on the actual number of events, 2.4 for 90% C.L. ?) we obtain the upper limit on the diffuse () flux. The combined upper limit obtained with Baikal neutrino telescopes NT-200 (234 days) and NT-96 ?) (70 days) is:
| (7) |
where the upper value refers to the conservative limit on light scattering in the Baikal water.
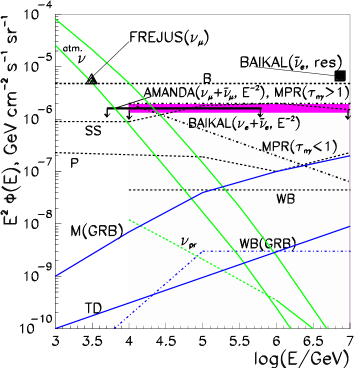
Fig.7 shows the upper limits on the isotropic diffuse high energy neutrino fluxes obtained by BAIKAL (this work), AMANDA ?) and FREJUS ?) (triangle) experiments as well as the atmospheric conventional neutrino fluxes ?) from horizontal and vertical directions (upper and lower curves, respectively) and atmospheric prompt neutrino flux ?) (curve labeled ). Also shown is the model independent upper limit on the diffuse high energy neutrino flux obtained by V.Berezinsky ?) (curve labeled ’B’) with the energy density of the diffuse X- and gamma-radiation eV cm-3 (as follows from EGRET data ?)), and predictions for diffuse neutrino fluxes from Stecker and Salamon model ?) (the sum of the quasar core and blazar jet contribution, curve labeled ’SS’) and Protheroe model ?) (from equal contribution from and interactions in AGN jets, curve labeled ’P’). Curves labeled ’MPR’ and ’WB’ show the upper bounds obtained by Mannheim, Protheroe and Rachen ?) for optically thick () and optically thin () sources as well as the upper bound obtained by Waxman and Bahcall ?) for optically thin sources respectively. Curves labeled ’M(GRB)’ and ’WB(GRB)’ present the upper bounds for diffuse neutrino flux from GRBs derived by Mannheim ?) and Waxman and Bahcall ?). Curve labeled ’TD’ shows prediction for neutrino flux from topological defects due to specific top-down scenario BHS1 ?).
For the resonant process (3) the event number is given by:
| (8) |
Our combined 90% C.L. limit obtained with NT-200 and NT-96 ?) at the W - resonance energy is:
| (9) |
and is also depicted in Fig.7 (rectangle).
3 Conclusion
The deep underwater neutrino telescope NT-200 in Lake Baikal is taking data since April 1998. Due to the high water transparency and low light scattering, the detection volume of NT-200 for high energy and detection is several megatons and exceeds the geometrical volume by factor of about 50 for highest energies. This permits a search for diffuse neutrino fluxes from extraterrestrial sources on the level of theoretical predictions. The upper limits (7), (9) obtained for the diffuse E-2 () flux and the model independent flux at resonant energy 6.3106GeV are the most stringent ones at present. We expect that the analysis of 3 years data taken with NT-200 would allow us to reach a sensitivity of cm-2s-1sr-1GeV.
4 Acknowledgements
This work was supported by the Russian Ministry of Research (contract 102-11(00)-p), the German Ministry of Education and Research and the Russian Fund of Basic Research (grants 99-02-18373a, 01-02-31013 and 00-15-96794), and by the Russian Federal Program “Integration” (project no. 346).
References
- [1] I.A.Belolaptikov et al., Astropart. Phys. 7 (1997) 263.
- [2] R.I.Bagduev et al., Nucl. Instr. Meth. A420 (1999) 138.
- [3] V.A.Balkanov et al., Nucl. Phys. Proc. Suppl. 91 (2001) 438.
- [4] J.W.Bolesta et al., Proc. 25-th ICRC Durban–South Africa, 7 (1997) 29.
- [5] R.Porrata et al., Proc. 25-th ICRC Durban–South Africa, 7 (1997) 9.
- [6] V.A.Balkanov et al., Astropart. Phys. 14 (2000) 61.
- [7] E.Andres et al., Nucl. Phys. Proc. Suppl. 91 (2001) 423.
- [8] V.S.Berezinsky et al., Astrophysics of Cosmic Rays, North Holland, Amsterdam (1990).
- [9] S.L.Glashow, Phys. Rev. 118 (1960) 316.
- [10] V.S.Berezinsky and A.Z.Gazizov, JETP Lett. 25 (1977) 254.
- [11] V.S.Berezinsky et al., Sov. J. Nucl. Phys. 43 (1986) 406.
- [12] R.Gandhi et al., Astropart. Phys. 5 (1996) 81.
- [13] G.Feldman and R.Cousins, Phys. Rev. D57 (1998) 3873.
- [14] W.Rhode et al., Astropart. Phys. 4 (1994) 217.
- [15] L.Volkova, Yad.Fiz. 31 (1980) 1510 (Sov. J. Nucl. Phys. 31 (1980) 784).
- [16] M.Thunman, G.Ingelman and P.Gondolo, Astropart. Phys. 5 (1996) 309.
- [17] P.Sreekumar et al. (EGRET Collaboration), Ap. J. 494 (1998) 523.
- [18] F.W.Stecker and M.H.Salamon, Astro-ph/9501064.
- [19] R.Protheroe, in Accretion Phenomena and Related Outflows, Vol. 163 of IAU Colloquium, edited by D.Wickramasinghe, G.Bicknell and L.Ferrario (The Astron. Soc. of the Pacific, 1997), pp.585-588, astro-ph/9809144.
- [20] K.Mannheim, R.J.Protheroe and J.P.Rachen, astro-ph/9812398.
- [21] E.Waxman and J.Bahcall, Phys. Rev. D 59 (1999) 023002.
- [22] K.Mannheim, astro-ph/0010353.
- [23] E.Waxman and J.Bahcall, Phys. Rev. Lett. 78 (1997) 2292.
- [24] P.Bhattacharjee, C.Hill and D.Schramm, Phys. Rev. Lett. 69 (1992) 567; G.Sigl, astro-ph/0008364.