A Chandra Survey of Broad Absorption Line Quasars 111ApJ, accepted May 15, 2001
Abstract
We have carried out a survey with the Chandra X-ray Observatory of a sample of 10 bright broad absorption line (BAL) QSOs. Eight out of ten sources are detected. The 6 brightest sources have only high ionization BALs (hiBALs), while the 4 faintest all show low ionization BALs (loBALs). We perform a combined spectral fit for hiBAL QSOs (384 counts total, 0.5-6keV) to determine the mean spectral parameters of this sample. We derive an underlying best-fit power-law slope , consistent with the mean slope for radio-quiet quasars from ASCA, but BALQSOs require a (restframe) absorbing column of , with a partial covering fraction of . The optical to X-ray spectral slope ( from 2500 Å to 2 keV) varies from 1.7 to 2.4 across the full sample, consistent with previous results that BALQSOs appear to be weak soft X-ray emitters. Removing the absorption component from our best-fit spectral model yields a range of from 1.55 to 2.28. All 6 hiBAL QSOs have de-absorbed X-ray emission consistent with non-BAL QSOs of similar luminosity. The spectral energy distributions of the hiBAL QSOs - both the underlying power-law slope and - provide the first conclusive evidence that BALQSOs have appeared to be X-ray weak because of intrinsic absorption, and that their underlying emission is consistent with non-BAL QSOs. By contrast, removal of the best-fit absorption column detected in the hiBAL QSOs still leaves the 4 loBAL QSOs with values that are unusually X-ray faint for their optical luminosities, consistent with other evidence that loBALs have higher column density, dustier absorbers. Important questions of whether BALQSOs represent a special line-of-sight towards a QSO nucleus or rather an early evolutionary or high accretion phase in a QSO lifetime remain to be resolved, and the unique properties of loBAL QSOs will be an integral part of that investigation.
Subject headings:
galaxies: active — quasars: emission lines — quasars: general — ultraviolet: galaxies1. Introduction
While large surveys are rapidly increasing the number of known quasars, our understanding of the quasar phenomenon grows more slowly. However, absorption lines caused by material intrinsic to the quasar hold great promise for revealing the conditions near the supermassive black holes that power them. The richest and most extreme absorption lines are found in quasars with broad absorption lines (BALs). About 10 - 15% of optically-selected QSOs have restframe ultraviolet spectra showing these BALs - deep absorption troughs displaced blueward from the corresponding emission lines in the high ionization transitions of C IV, Si IV, N V, and O VI (hiBALs hereafter). About 10% of BALQSOs also show broad absorption in lower ionization lines of Mg II or Al III (loBALs). BALQSOs in general have higher optical/UV polarization than non-BAL QSOs, but the loBAL subsample tends to have particularly high polarization (Schmidt & Hines 1999) along with signs of reddening by dust (Sprayberry & Foltz 1992; Egami et al. 1996). All the BALs are commonly attributed to material along our line of sight flowing outward from the nucleus with velocities of 5,000 up to km s. The observed ratios of broad emission and absorption line equivalent widths and the detailed profiles of CIV BALs both imply that the covering factor of the BAL region must be (Hamann et al. 1993). This observation, together with the similar fraction of QSOs showing BALs suggests that most or possibly all QSOs contain BAL-type outflows. The optical/UV emission lines and continuum slopes of hiBAL QSOs are remarkably similar to those of non-BALQSOs (Weymann et al. 1991). BALQSOs may thus provide a unique probe of conditions near the nucleus of most QSOs. Ironically, although viewed from an obscured direction, BALQSOs may nevertheless be particularly revealing.
In the last decade, a significant observational effort has been dedicated to BALQSOs in the ultraviolet (UV) and X-ray bandpasses. The absorbing columns typically inferred from the UV spectra for the BAL clouds themselves (e.g., ; Korista et al. 1992) appear low enough that we would a priori expect very little X-ray absorption (). It was initially a surprise then, to discover that BALQSOs are markedly underluminous in soft X-rays compared to their non-BALQSO counterparts. Contrasting a complete sample of 36 BALQSOs in the Large Bright Quasar Survey and the ROSAT All-Sky Survey (RASS) with carefully chosen comparison samples, Green et al. (1995) revealed definitively that BALQSOs are soft X-ray quiet as a class. Deeper archival ROSAT PSPC pointings of 11 bona fide BALQSOs confirmed this (Green & Mathur 1996; GM96 hereafter), yielding unusually steep optical-to-X-ray slopes for BALQSOs (222 is the slope of a hypothetical power-law from 2500 Å to 2 keV; .) relative to non-BAL QSOs () in the ROSAT bandpass. By assuming that the intrinsic (unabsorbed) spectral energy distributions (SEDs) of BALQSOs are similar to those of non-BAL QSOs, GM96 found that absorbing columns of are necessary to quench the X-ray flux to observed (or upper limit) levels. Gallagher et al. (1999) studied a sample of 8 BALQSOs with ASCA, of which only 2 were detected. They estimated column densities of to explain the non-detections, even higher than the ROSAT estimates. In some cases, the absorber is probably Compton thick (i.e., ), as in ASCA observations of PG 0946+301 (Mathur et al. 2000).
If the UV and X-ray absorption in quasars arises in the same region (e.g., Mathur et al. 1994), the large derived X-ray columns increase the best UV-derived estimates of both the ionization and mass outflow rate of BALs by 2 to 3 orders of magnitude. These highly ionized BAL outflows then represent a significant component of the QSO energy budget. But a single zone photoionization model may not be appropriate, and other intriguing possibilities remain. BALQSOs have been interpreted as normal QSOs seen along a line of sight either ablating off the edge of an obscuring torus, or accelerated from the surface of the accretion disk in a wind (e.g., Murray & Chiang 1997; deKool & Begelman 1995; Elvis 2000). In this case, the inner wind-driven X-ray absorber shields the UV BAL clouds, so that the UV BAL zone has a lower ionization than the X-ray absorber.
Even if the X-ray and UV absorbers are identical, the geometry, covering factor, temperature, density, metallicity and ionization parameter of the absorbing clouds are poorly constrained from UV absorption line studies alone. The few absorption lines observed provide little if any constraint on the ionization of the absorbing material, leading to the simplifying assumption that the observed ions are the dominant species. Furthermore, BALs in the UV are often saturated (Wang et al. 1999), and column densities derived from UV measurements may also be significantly underestimated due to partial covering of the continuum source (Hamann 1998; Arav et al. 1999). Higher ionization absorbers are indicated not just by the X-ray absorption, but by the detection of UV absorption in NeVIII, OVI, and SiXII (Telfer et al. 1998). UV spectropolarimetry implies columns consistent with X-ray results (Goodrich 1997) - the most common UV BALs are saturated, but partially filled in with scattered light.
Many results support the picture that BALQSOs are intrinsically normal QSOs, with the BAL region an important part of every QSO’s structure. Suggestive links between low-ionization BALQSOs and IR-luminous mergers (Fabian 1999), and similarities between BALQSOs and and narrow line Seyfert 1 galaxies (Mathur 2000; Brandt & Gallagher 2000) may also support a scenario where BALQSOs are adolescent quasars in a transition phase, evolving from active high (high Eddington fraction) to normal QSOs. If the BAL phase represents a high accretion rate period in a quasar’s lifetime, than an intrinsic power-law steeper than that for non-BAL QSOs might be expected, by analogy to narrow line Seyferts and Galactic black hole candidate binary systems in outburst (Leighly 1999; Pounds, Done, & Osborne 1995).
Are the intrinsic SEDs of BALQSOs really the same as non-BAL QSOs? X-ray spectroscopy can confirm the absorption interpretation, and verify whether the underlying (unabsorbed) emission supports the hypothesis that BALQSOs are typical QSOs seen from a privileged line of sight, or rather a different phase or species of QSO. Unfortunately, due to low observed fluxes, there are only a handful of BALQSOs with X-ray spectroscopy.
(1) In a 100 ksec ASCA spectrum, Mathur et al. (2000) found evidence that PG 0946+341 is Compton thick, but this again was based on assumptions that the underlying spectrum and normalization was that of a normal QSO, since the counts were too few for detailed spectral fitting.
(2) Mathur et al. (2001) analyzed an ASCA spectrum of the prototype BALQSO PHL5200 (with ), wherein intrinsic absorption of was required, covering 80% of the source. Intriguingly, the best-fit power-law photon index333 The photon index is related to the energy index by . in the 2–10keV range () for PHL5200 is steeper than typical for non-BALQSOs.
(3) Simultaneous ASCA/ROSAT fitting of PG 1411+442 (Wang et al. 1999) shows a hard X-ray slope typical for non-BALQSOs (; George et al. 2000; Reeves & Turner 2000), but there is also evidence for a strong, steep () component of soft X-ray emission, where non-BAL QSOs typically show . At however, PG 1411+442 is the least luminous BALQSO and suffers significant contamination from star-forming regions in its host galaxy.
(4) Gallagher et al. (2001) found one BALQSO, PG2112+059 () which has perhaps the brightest flux of any BALQSO. A best-fit power-law of slope , partially () covered by cm-2 of intrinsic absorption suggests that this object could be a shrouded example of a typical QSO. However, while the object’s ‘balnicity’ index444Weymann et al. (1991) define balnicity index by summing the equivalent width (in km/s) of any contiguous absorption that falls in the range 3,000 to 25,000 km/s from the systemic redshift, if the absorption feature exceeds 2000 km/s in width and is at least 10% below the continuum level. of 2980 km/s seems to classify it firmly a BALQSO, the BALs are atypically shallow, and the derived column rather low.
Further X-ray spectroscopy is critical to our basic understanding of BALQSOs, but is needed for some more typical objects, and for as large a sample as is feasible. To begin to address this problem systematically, we performed a snapshot X-ray survey of BALQSOs during Cycle 1 of the Chandra X-ray Observatory (CXO). We describe below the chosen sample (§ 2) and their Chandra observations, ensemble spectral fitting (§ 3), X-ray brightness (§ 4), and the significance of our findings (§ 5). We summarize our findings in (§ 6), and present a brief discussion of individual objects in the sample in an Appendix.
2. Sample and Observations
We compiled a list of bona fide BALQSOs with magnitudes (usually or ) brighter than 17th. We derived expected countrates using Chandra PIMMs, assuming that the intrinsic SED (before absorption) of BALQSOs is similar to that of typical radio-quiet QSOs at similar luminosities. For the X-ray spectral photon index , we used 2.5 in the soft X-ray band (Schartel et al. 1996), and 1.8 above 2keV (Lawson & Turner 1997). The power-law normalizations were derived from the observed optical magnitudes using values of typical for normal QSOs (; Green et al. 1995). We then calculated the absorbed Chandra broadband flux assuming a () absorbing column of , which corresponds to an intrinsic column of at typical sample redshifts. We thus calculated our proposed Chandra exposure times to result in a strong detection for each source.
The resulting sample spans a wide range of BALQSO phenomena, including: redshifts from 0.1 to 2.4, four dusty loBAL QSOs, two loBAL QSOs with metastable excited states of FeII and FeIII (Hazard et al. 1987), a radio-moderate BALQSO (Becker et al. 1997), and a gravitationally lensed BALQSO. Table 1 lists the sample in order of increasing right ascension, and includes mostly non-X-ray information.
All sources were observed between 1999-Dec-30 and 2000-May-15 using the back-illuminated S3 chip of the Advanced CCD Imaging Spectrometer (ACIS) on board Chandra. For the (optically) brightest object IRAS07598+6508 (), we used a subarray for more rapid readout, to avoid possible pileup of counts in ACIS. Table 2 lists the Chandra Observation ID (ObsID) and exposure times, observation dates, observed countrates or upper limits. The total exposure time for the sample of 10 objects is 36.2 ksec. For each detected target, X-ray celestial coordinates matched optical counterpart coordinates to within arcsec, so that there is no ambiguity about identification.
3. Data Analysis and Simultaneous Spectral Fitting
We used reprocessed 555CXCDS versions R4CU5UPD11.1 and higher, along with ACIS calibration data from the Chandra CALDB 2.0. data, and extracted ACIS gain-corrected pulse height invariant (PI) spectra from a 2.5″ region around each QSO, using the psextract script described in the standard thread for Chandra Interactive Analysis of Observations (CIAO2.0). This script creates an aspect histogram file, and the RMF and ARF666Response Matrix Files (RMFs) are used to convert the ACIS pulse height (deposited charge) to energy. Ancillary Response Files (ARFs) calibrate the effective collecting area of a specified source region on ACIS as a function of incident photon energy. calibration files appropriate to the source position on chip (which is time-dependent due to dither) and CCD temperature (C). We extract background in PI space using an annulus extending typically from arcsec around the source. In every case, the total background normalized to the source extraction area was less than one count, so we ignore background henceforth. In all analyses, we ignored channels below 0.5 keV, since the ACIS response at lower energies is not well calibrated. Above 0.5 keV, the calibration is accurate to better than 10%. Channels above 6keV were also ignored because of insufficient counts. Two final PI spectrum files were created for each source, one with no binning and one binned to a minimum of 5 counts per bin.
We perform spectral modeling for the six sources from Table 2 with more than 20 counts. We used Sherpa, a generalized modeling and fitting environment within CIAO2.0. Since each source spectrum taken individually has insufficient counts to usefully constrain the intrinsic absorption or power-law spectral index, instead we simultaneously fitted all 6 spectra. We fit only the 6 BALQSOs from Table 2 with more than 20 counts each. Note that these sources are all hiBAL QSOs, so the spectral parameters we derive may not apply to loBAL QSOs. We tested several source models, for which the best-fit values are recorded in Table 3.
Model (A) is simply a global power-law, with an individual flux normalization for each QSO, and () absorption fixed to the Galactic value for each QSO:
In this formula, is the normalization for the th spectrum but is a global power-law emission component. is the equivalent Galactic neutral hydrogen column density which characterizes the effective absorption (by cold gas at solar abundance) for the th source, with the corresponding absorption cross-section (Morrison & McCammon 1983). This simple fit yields an unusually flat continuum slope (), which is a signal that intrinsic absorption may be present. For determining the best-fit parameter values, we use Powell optimization with Cash statistics. This allows the use of unbinned spectral data, and we quote 90% confidence limits on fit parameters in Table 3 and hereafter.
In Model (B), we add a neutral absorber at the systemic redshift of each spectrum by multiplying Model (A) by a further term . Here the key feature is that all the intrinsic column density parameters are linked together, giving just a single free “intrinsic absorption” component. Similarly, the overall model amplitudes are free to vary individually, but again only one global power-law spectral index is fitted. The best-fit slope of Model (B) is , with intrinsic (rest-frame) absorption cm-2.
We examined the relative quality of different model fits using statistics, which must be performed on binned data. We binned the photon events to 5 counts per bin, and estimate the variance using the background and source model amplitudes rather than the observed counts data (statistic chi mvar in CIAO2.0). Table 3 presents the best-fit (Cash) model parameters together with their reduced- statistics. The results of fitting confirm that inclusion of a redshifted absorber (Model B) improves the fit at 99.7% (3) confidence (using the F-test).
Inclusion of a global partial covering parameter for the redshifted absorbers (Model C) substitutes the intrinsic absorption term in Model (B) with the expression
Here the last term in parentheses represents the fraction of light that escapes the source without absorption. Model C improves the fit, again at 99.5% confidence (F-test) relative to a redshifted absorber with no partial covering. The “composite” BALQSO has intrinsic (rest-frame) absorption cm-2 covering of the source, whose intrinsic power-law energy index .
In Figure 1, we present the summed Chandra X-ray spectrum for the six BALQSOs with more than 20 counts. The sum of all the individual source models from the global best-fit Model C is overplotted, both with and without the absorber. The dashed line shows the “de-absorbed” model spectrum, where the intrinsic absorption component is removed from the best-fit model. Residuals for (similarly summed) models A, B, and C are also shown. We caution that this is essentially a composite of residuals from individual sources with different values of redshift and galactic absorption, and so features do not correspond directly to those expected in a single spectrum. However, the result is useful for visualization purposes, since the redshifts for the spectral subsample - from 1.465 to 2.371, with mean - happen not to range so widely as in the full sample. Neither is the counts-weighted redshift of 1.93 significantly different from this mean.
Figure 2 shows the confidence contours for Model C, where it can be seen that the absorption is required at more than confidence. The best-fit power-law index for our BALQSO sample is entirely consistent with the mean of with dispersion seen with ASCA for RQQs at redshifts (Reeves & Turner 2000). Measurements in a similar redshift range are perhaps more relevant, so we compiled ASCA measurements from Reeves & Turner (2000) and Vignali et al. (1999) for all 10 of the RQ QSOs with measured power-law energy indices. Redshifts for this comparison sample range from 1.3 to 3.0, with a mean of 2.1. The average index for the comparison sample is with dispersion 0.15, indistinguishable from our results for the Chandra BALQSO sample.
The quality of the spectra are not sufficient to also constrain ionization or metallicity of the absorber, justifying the assumption of neutral absorbers with solar metallicity in our modeling. Modeling with either higher metallicities or with ionized absorbers would only increase the required intrinsic column in the best-fit models, but is very unlikely to substantially change the power-law slope.
4. X-ray Brightness
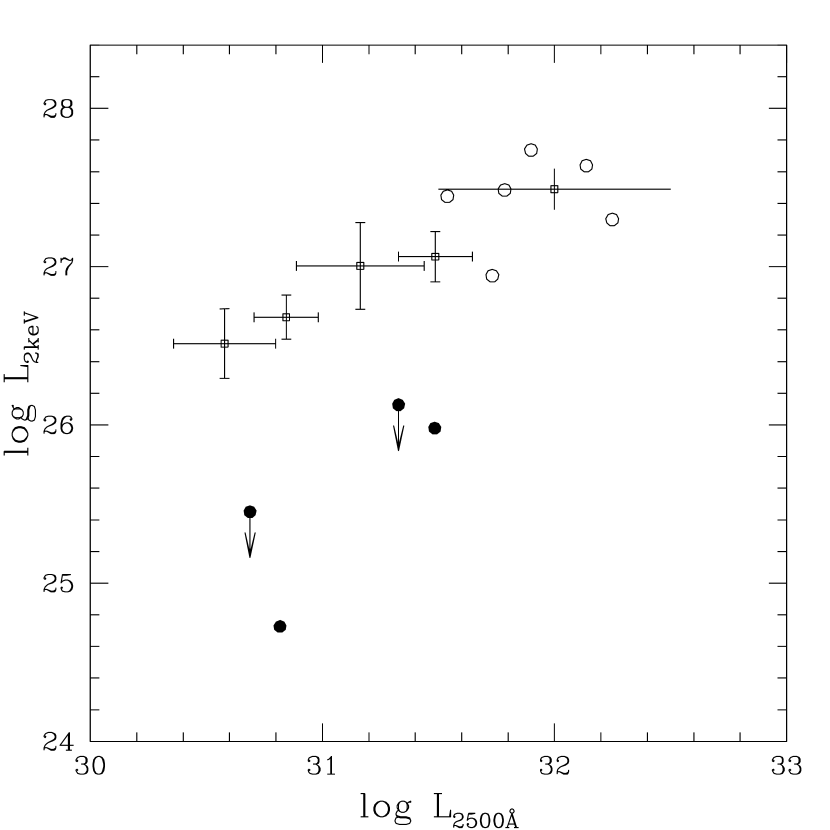
Now that we have a measured mean spectral shape for hiBAL QSOs, for the first time we can calculate fluxes consistently using the best-fit model with the redshifted absorption component removed. This tells us what values BALQSOs would have without their intrinsic absorption, since their (de-absorbed) intrinsic SEDs are well-characterized by the above slope. We use the best-fit composite X-ray spectral model to calculate the observed fluxes in the 0.5-8keV band in Table 2. We derive the de-absorbed flux in the same band, and use these to calculate the monochromatic rest-frame luminosities at 2 keV, also shown in Table 2. Optical magnitudes from Table 1 are used to derive the 2500Å luminosities, and from these we calculated the optical to X-ray index . All luminosities are calculated assuming km s-1 Mpc-1 and , with specific optical normalization from Marshall et al. (1984).
Using the de-absorbed fluxes from our full best-fit model in the observed Chandra band (0.5-8keV), and also a consistent power-law slope for the -correction, the resulting values (or limits) range from 1.56 to 2.36, with a mean of 1.87. We note that use of the absorbed fluxes would decrease log by about 0.23 and thereby increase by about 0.1.
We must be careful when we compare for our BALQSO sample to previous results derived from observed fluxes in different (e.g., ROSAT) bandpasses, or assuming different X-ray slopes. As a consistency check with previous results (e.g., GM96) we first simulate what would have been seen by ROSAT. To do this we calculate with our full best-fit model the flux that would be observed in the ROSAT (0.5-2keV) band. The resulting values range from 1.7 to 2.5, with a mean of 2.0, consistent with the ROSAT BALQSO results for GM96 (most of which were non-detections).
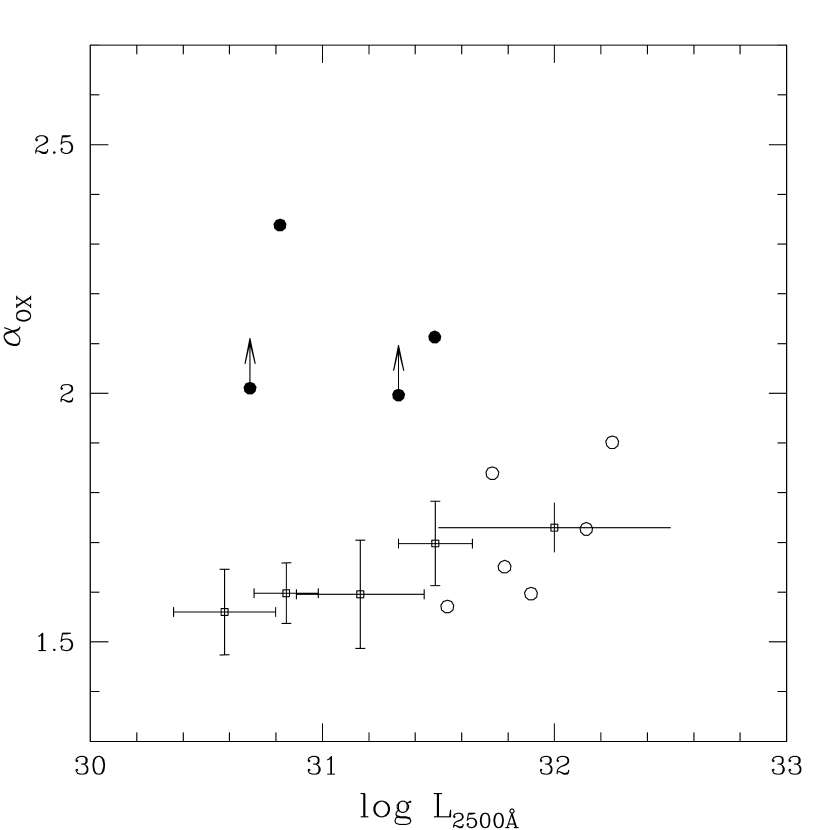
Figure 3 shows the de-absorbed luminosities and for our sample relative to the composite points for large samples of radio-quiet QSOs observed by ROSAT (Green et al. 1995, Yuan et al. 1998). We caution that those ROSAT points are calculated in the ROSAT bandpass assuming a steeper slope , applicable to ROSAT-observed radio-quiet quasars. With the modeled intrinsic absorption removed, the high ionization BALQSOs in our sample fit reasonably well along the empirical trend of increasing (weakening X-ray emission) with increasing . On the other hand, the four low-ionization BALQSOs in our sample are extremely X-ray weak. Two are not detected at all (for which we assign 5 counts as an upper limit). Of the two loBAL QSOs that are detected, one is the most nearby object (at ), and the other is a radio-intermediate BALQSO.
5. Discussion
Previous estimates of column densities in BALQSO samples came by assuming that each BALQSO had an intrinsic X-ray continuum of shape and normalization (relative to the optical) consistent with normal radio-quiet quasars (GM96; Gallagher et al. 1999). In most previous cases, the intrinsic absorbing column was estimated simply scaling up N until the expected X-ray fluxes (predicted using and ) matched the observed fluxes or flux upper limits.
In the current study, we detect most of the BALQSOs, and now confirm via actual spectral fitting that the underlying continuum is consistent with that of normal radio-quiet QSOs. In the ensemble spectrum we also detect not only the predicted strong absorption, but show the appropriateness of partial covering for the spectral model. Using the de-absorbed model, we now derive actual values (rather than limits), with or without the intrinsic absorbing column included.
The best-fit power-law slope we find is harder than the slope of derived for the bright loBAL QSO PHL 5200 by Mathur et al. (2001) using a 90% covering fraction. Intriguingly, however, their inclusion of a high energy (18keV) cut-off in the model yields the best overall fit that they find, and a slope of , which is consistent with the current result within the errors. However, PHL5200 may be a special case. With , PHL5200 is the X-ray brightest BALQSO ever observed, and its polarization is also quite high (5% at ; cf. Schmidt & Hines 1999). To account for its X-ray brightness requires far more than the simple application of an additional 10% reflected X-rays, since PHL5200 is an order of magnitude brighter in X-rays than most BALQSOs.
The BAL clouds along our sightline may be diaphanous, shredded or otherwise holey, affecting the measured partial covering fraction. However, the measured fraction is likely decreased by X-ray emission reflected towards us by clouds having a direct line of sight to the nucleus. Such reflection should be associated with increased polarization, but polarization measurements for 6 of the objects in our sample show no correlation with , or .
5.1. Low Ionization BAL QSOs
Only about 1% of optically-selected QSOs show broad absorption in lower ionization lines of Mg II or Fe II. By contrast, Boroson & Meyers (1992) found that LoBAL quasars constitute 10% of IR-selected quasars. LoBAL QSOs are reddened (Sprayberry & Foltz 1992; Egami et al. 1996), and tend to have particularly high polarization (Schmidt & Hines 1999). We have included 4 loBAL QSOs in our Chandra sample. Since insufficient counts are available from the loBALs, the spectral model we adopt is from hiBAL QSOs only. This also means that the de-absorption applied to the X-ray fluxes of the loBALs probably underestimates their true column, causing even the the de-absorbed and values in Table 2 and Figure 3 for these objects to look particularly X-ray weak.
We can interpret the difference between the values for loBAL QSOs plotted in Figure 3 and a de-absorbed of 1.7 (the mean value for the hiBAL QSOs alone) to be due to additional absorption in loBALs that is unaccounted for in our spectral model. The minimum difference is , based on the lower limits to of the undetected loBAL QSOs. Even neglecting any optical extinction, this corresponds to additional quenching of of at least a factor of six. Assuming that the same () intrinsic power-law applies to all BALQSOs, we can infer that loBAL QSOs are shrouded by at minimum an additional intrinsic column of nearly cm-2 beyond that of the hiBALQSOs. LoBAL QSOs may also have intrinsically steeper spectra so that their X-rays are more easily absorbed.
Even more rare than loBALs in optical surveys are the “iron loBALs”, which exhibit absorption lines from metastable excited levels of Fe II. There are just a few iron loBAL QSOs known to date: Q0059-2735, FIRST J0840+3633 and J1556+3517 (Becker et al. 1997), and Hawaii 167 (Cowie et al. 1994). Becker et al. (1997) noted a trend of radio power increasing with reddening and proposed that, as loBALs become more extinguished optically, their radio power increases, making iron loBAL QSOs a special radio-intermediate population of BALQSOs. Sensitive radio surveys may thus uncover many more iron loBAL QSOs. We have observed two of the known iron loBAL QSOs, Q0059-2735 and FIRST J0840+3633. Both are quite weak in X-rays, the former not detected at all. This indicates that iron loBALs, if they are indeed QSOs, may be nearly Compton thick (), so beyond the reach of most X-ray surveys except perhaps at high redshift where their observed-frame X-rays correspond to more penetrating hard X-ray emission in the quasar rest-frame.
The decrease in polarization toward longer wavelengths in some loBALs suggests edge-on dust-scattering models (Kartje 1995) where the scattered line of sight is less reddened, so that loBAL QSOs have been proposed as the most edge-on QSOs (Brotherton et al. 1997). On the other hand, loBAL QSOs may be nascent QSOs embedded in a dense, dusty star formation region (e.g., Voit, Weymann, & Korista 1993). The expected strong extinction has been seen (Sprayberry & Foltz 1992; Boroson & Meyers 1992), and could explain their low (1-2%) incidence in optically-selected samples. Luminous infrared galaxies such as IRAS07598+6508 may have both nuclear starbursts and active nuclei fueled by large masses of gas and dust within a few hundred pc of the nucleus arising from mergers and viscous accretion (Canalizo & Stockton 2000). Nearby examples such as this object may be accessible analogs of high redshift galaxies seen in their peak epoch of formation and growth (Scoville 1999).
Based only on their observed X-ray luminosities, an alternative to absorption is that loBAL QSOs may contain at best very weak AGN, and are instead dominated by massive starbursts (e.g., Risaliti et al. 2000). The brightest nearby spiral galaxies observed by Fabbiano & Trinchieri (1985) show log, and ellipticals achieve log, which is near to the apparent X-ray luminosity of our 2 detected loBAL QSOs. The nearby starburst galaxy NGC 3256 is driving a “superwind” (Moran et al. 1999), and achieves log, similar to the loBAL QSO IRAS07598+6508 in the current sample. However, the optical/UV emission and absorption line properties of loBAL QSOs clearly indicate velocities far higher than achievable even by starburst superwinds (Leitherer, Robert, & Drissen 1992).
5.2. Orientation, Evolution, and Outburst
An alternative to the orientation hypothesis, where every QSO has BAL clouds visible only along a privileged line of sight, is that BALQSOs are in a phase of high accretion rate. If so, in analogy to Narrow Line Seyfert 1 galaxies we expect the intrinsic power-law to be significantly steeper than normal QSOs (Mathur 2000; Brandt & Gallagher 2000). The underlying power-law that we detect in the current study does not favor such an interpretation. On the other hand, some counterexamples of steep X-ray spectrum BALQSOs may exist (PHL5200 Mathur et al. 2000; PG 1411+442, Wang et al. 1999).
In the orientation interpretation of the BAL phenomenon, of QSOs show BALs because the overall BAL covering factor is . The recent discovery of radio-selected BALQSOs with both compact and extended radio morphologies, with both steep and flat spectra is inconsistent with a simple unified orientation scheme, which predicts only steep-spectrum sources for an edge-on geometry. Predominantly compact radio morphology and steep radio spectra in radio-selected BALQSOs are reminiscent of compact steep spectrum quasars. These have been interpreted as young radio objects that are confined to a small region by dense gas, but which later evolve extended radio lobes as they escape confinement (O’Dea 1998), analogous to the evolutionary model of BALQSOs as young quasars emerging from cocoons (Voit et al. 1993). Rather than directly interpreting the fraction of QSOs with BALs as a covering factor, the observed fraction may instead reflect the portion of a QSO lifetime with strong outflows at large covering factor. If in addition, mergers and interactions that trigger growth and accretion occur more frequently at early epochs as expected, then an evolutionary trend is predicted; BALQSOs should be more common at high redshifts. If a large, relatively unbiased sample of BALQSOs can be accumulated, both evolution and orientation may need to be invoked to explain the observed population.
A recent tally (Chartas 2000) of QSOs has shown that 35% of gravitationally lensed QSOs show BALs, more than 3 times the rate in flux-limited optical QSO surveys. While the fraction of BALQSOs may increase with look-back time, another viable explanation is that lensing magnification overcomes attenuation of the BALQSO optical emission, such that presently available flux-limited surveys of BAL quasars detect more gravitationally lensed BALQSOs. Grey attenuation of a factor of about 5, as also suggested by Goodrich (1997) from polarization observations of BALQSOs, together with plausible average lensing magnification factors of , successfully reproduce the observations. The resulting prediction that the fraction of BALQSOs should increase with survey sensitivity (see also Krolik & Voit 1998) seems to be borne out by the fact that at least 3 of 5 of the QSOs found so far in the Sloan Digital Sky Survey show BALs (Zheng et al. 2000). However, these (small sample) statistics could support either a lensing or an evolutionary model.
Increasingly, low-energy X-ray absorption is being reported in quasars at high redshift (Yuan et al. 2000; Fiore et al. 1998; Elvis et al. 1994). At this writing, the QSO with the highest known redshift (Sloan Digital Sky Survey SDSSp J104433.04-012402.2 at ; Brandt et al. 2001) is also X-ray weak (). BALQSOs and similar absorbed AGN may provide a significantly larger fraction of the cosmic X-ray background (CXRB) than would be estimated from their contribution to typical optically-selected samples. Furthermore, as the simplest model fits demonstrate (Table 3), low S/N absorbed X-ray spectra of BALQSOs will look hard () like the CXRB spectrum. The apparently high fraction and nature of obscured faint sources with hard X-ray spectra reported in early deep Chandra fields (e.g., Giacconi et al. 2001; Hornschemeier et al. 2001) is being hotly debated, but may contain many such objects. Our results provide a caution to interpretations of the spectra of these faint hard X-ray sources. Distant obscured quasars detected with very few counts may appear to be hard enough to compose much of the CXRB, while their true continuua could taper off more quickly at higher energies. Table 3 shows that partial covering can also strongly affect the apparent continuum slope even when absorption is detected. Extremely deep pointings may find a small number of such objects bright enough so that better X-ray spectral constraints are available. Samples of high redshift and/or optically reddened objects from larger areas should be amassed at brighter fluxes by serendipitous surveys wider sky coverage like the ChaMP (Green et al. 1999; Wilkes et al. 2001). Stacking or simultaneous fitting of X-ray spectra as performed here could help establish the detailed spectral characteristics and evolution of X-ray absorption in quasars.
6. Summary
We have carried out a short-exposure Chandra survey of a sample of 10 bright Broad Absorption Line (BAL) QSOS, with exposures ranging in length from 1.3 to 5.4 ksec. Eight out of ten sources are detected, with observed counts ranging from 8 to 113. Corresponding fluxes are rewardingly bright in the Chandra (0.5-8 keV) bandpass, ranging from to erg cm-2 s-1.
Simultaneous fitting of spectra from six BALQSOs detected by Chandra shows that the “composite” BALQSO has an underlying power-law spectral index that is covered by an intrinsic absorber of column cm-2. Our X-ray spectral constraints should represent those of an average high ionization BALQSO. We note that the best-fit absorption column (with partial covering) of is far higher than would be naively measured from UV spectra from BAL equivalent widths or by direct conversion of residual intensity to optical depth, robustly confirming earlier suggestions. Truly high S/N X-ray spectra of typical BALQSOs are still coveted, since the cloud properties can then be studied in detail and compared to spectral information from the BALs in the restframe UV. Scattering models can in principle be tested with a soft X-ray polarization measurement.
For the detected QSOs, the de-absorbed optical to X-ray spectral slope ( from 2500 Å to 2 keV) varies from 1.6 to 2.3. The high-ionization BALQSOs in our sample have de-absorbed values of consistent with those measured in optically-selected radio-quiet QSOs of similar luminosity. The low-ionization BALQSOs in our sample are X-ray weak, even after correcting for the composite intrinsic absorption. One explanation is that the absorbing column in these objects is substantially higher, but further investigation is of great interest, especially given the possible links of these objects to ultraluminous IR galaxies and mergers.
The authors would like thank Aneta Siemiginowska for her expert help with Sherpa, as well as the entire Chandra team for making possible these very sensitive observations. This work was supported by CXO grant GO 0-1030X and NASA grant NAS8-39073.
7. APPENDIX: Individual Objects
Q0059-2735: This strong loBAL was not detected by Chandra. It is highly reddened (Egami et al. 1996) and significantly polarized (; Hutsemekers et al. 1998). Although several examples now exist (Becker et al. 1997; Brotherton et al. 1997), Q0059-2735 is the prototype “iron loBAL”, showing striking absorption lines in metastable iron (Hazard et al. 1987). The spectra of these objects are spectacular, and completely dominated by their absorption features in the restframe UV.
Q0135-4001: Normal, strong hiBALs (Korista et al. 1993).
Q0254-334: Amongst our sample, this object is intrinsically brightest in X-rays, and is not polarized (; Hutsemekers et al. 1998), implying that little of the observed emission is reflected into our line of sight. The restframe UV spectrum (Wright et al. 1982) has strong hiBALS, with no evidence for loBALs. We note that the countrates between the two observations differ at the 2.2 level, offering intriguing evidence for absorber variability, rarely if ever seen in high luminosity BALQSOs.
In our ACIS-S image, we also detect the radio quasar PKS 0254-334 (PMN J0256-3315), which is 60 distant, and at a similar redshift (1.913). With 25 counts in ObsID 135, and 51 counts in ObsID 815, we derive a count rate of 0.022. Assuming typical for radio-loud quasars (Reeves & Turner 2000), we derive an (absorbed) flux (0.5-8keV)erg cm-2 s-1(or (0.5-2keV)erg cm-2 s-1). The (unabsorbed) X-ray luminosity log, which together with the USNOA2.0 magnitude (Monet 1998) yields . As expected, this object is more X-ray bright than most radio-quiet quasars, and significantly more so than most BALQSOs.
IRAS07598+6508: Of the entire Chandra BALQSO sample, this IRAS-selected loBAL shows the weakest observed X-ray emission relative to optical (), consistent with both the ROSAT upper limit from an 8.3 ksec PSPC observation (GM96) and Gallagher et al. (1999), where the object is detected only in the hard-sensitive ASCA GIS in a 40 ksec observation. We owe our detection here in just 1.3 ksec to Chandra’s tiny PSF ( on axis) and to the object’s low redshift (0.148), perhaps abetted by some reflected X-ray emission implied by the object’s significant optical polarization (; Schmidt & Hines 1999). Objects such as this may also have an appreciable contribution from a circumnuclear starburst in the X-ray bandpass. (Lawrence et al. 1997).
While most optically-selected quasars fall in a narrow range of (Andreani et al. 1999), IRAS07598+6508 is IRAS-selected, and has a ratio about an order of magnitude larger than the mean. In the unified AGN scheme, may be related to the viewing angle of the torus, with more inclined objects having larger values. If BALQSOs are seen at a line of sight that skims outflowing BAL clouds ablated from a disk, the likelihood that the disk and torus tend to be aligned means that BALQSOs, and the reddened loBALs in particular, are probably severely underrepresented in optical surveys.
FIRSTJ0840+3633: This iron loBAL is one of many BALQSOs selected by FIRST radio survey (Becker et al. 2000). While quite X-ray weak (), and at higher redshift than the other iron loBAL in our sample (IRAS07598+6508), FIRSTJ0840+3633 is detected in our survey. Some of the detected X-ray emission may be reflected, as suggested by the very significant polarization in this object ( at 2000Å restframe; Brotherton et al. 1997).
Q0842+3431 (CSO 203): This hiBAL QSO has low polarization (; Ogle et al. 1999), and appears to have X-ray brightness typical for a non-BAL of its optical luminosity.
UM 425 (Q1120+019): This hiBAL QSO has the highest X-ray flux in our sample, and also has high polarization (; Hutsemekers et al. 1998). Two quasars at identical redshifts are seen, separated by and about 4.5mag in optical brightness. UM425A and UM425B may well be lensed, especially since both spectra show BALs (Meylan & Djorgovski 1989). It could also be an intriguing case of merger-triggered AGN (Kochanek, Falco & Munoz 1998) interacting within their 60-100kpc separation. UM425B is expected to show only about one or two counts in our 2.6 ksec exposure, and consistent with that, it is not detected.
LBQS1235+1807B (IRAS F12358+1807): We would certainly have expected to detect this optically bright, low redshift object in our Chandra exposure if it were a non-BAL, or even a hiBAL QSO. However, it is an IRAS-detected loBAL, with little expectation of reflected nuclear emission, since it is unpolarized in the optical (; Lamy & Hutsemeker 2000).
Q1246-0542: It is notable that this BALQSO is particularly X-ray weak for a high ionization BALQSO (), and may show weak evidence for an Mg II BAL (Hutsemekers et al. 1998). A high S/N spectrum reaching Mg II at 9200Å would be valuable. Intriguingly, polarization may be variable in this object: Schmidt et al. (1999) report , while Hutsemekers et al. (1998) list . If a substantial fraction of the detected X-rays are scattered into our line of sight, then this implies that the observed X-ray flux should also vary. We see no significant variability within the short timescale of our 5.4 ksec Chandra observation. Our derived flux is also consistent with that seen by GM96 with ROSAT.
SBSG1542+541: This bright high redshift hiBAL QSO has very highly ionized BALs (including O VI, NeV III, and Si XII; Telfer et al. 1998), and appears to have X-ray brightness typical for a non-BAL of its optical luminosity.
| Target | aa magnitudes from USNOA-2.0 (Monet 1998), for all but UM 425 (Michalitsianos et al. 1997). Magnitudes are uncorrected for the BALs. | BAL | Polarization | RefbbReferences (for Polarization only): 1) Lamy & Hutsemekers 2000; 2) Hutsemekers et al. 1998; 3) Schmidt & Hines 1999; 4) Brotherton et al. 1997; 5) Ogle et al. 1999. | CommentccReferences for comments can be found in the Appemdix, where individual objects are discussed. | ||
|---|---|---|---|---|---|---|---|
| (1020cm-2) | Ionization | % | |||||
| Q0059-2735 | 1.595 | 18.0 | 1.97 | Low | 1 | Metastable FeII, FeIII | |
| Q0135-4001 | 1.850 | 17.3 | 1.97 | High | … | ||
| Q0254-334 | 1.863 | 17.8 | 2.26 | High | 2 | NV, OVI BALs | |
| IRAS07598+6508 | 0.148 | 14.3 | 4.34 | Low | 3 | IRAS, ASCA detection | |
| FIRSTJ0840+3633 | 1.220 | 17.1 | 3.44 | Low | 4 | 4 | Metastable FeII, FeIII, |
| Radio-moderate | |||||||
| Q0842+3431 | 2.120 | 17.5 | 3.41 | High | 5 | ||
| UM425 | 1.465 | 16.5 | 4.09 | High | 2 | Grav. lens?, OVI BALs | |
| LBQS1235+1807B | 0.449 | 16.9 | 1.96 | Low | 1 | IRAS | |
| Q1246-0542 | 2.236 | 16.4 | 2.17 | High | 2 | ROSAT detection | |
| SBSG1542+541 | 2.371 | 16.8 | 1.27 | High | … | Very high ionization | |
| Target | Chandra | Time | Date of | Counts | Count rate | log(0.5-8keV)a | loga | a | |
|---|---|---|---|---|---|---|---|---|---|
| ObsID | (ksec) | Observation | (ksec-1) | abs. | de-abs. | ||||
| Q0059-2735 | 813 | 4.39 | 2000-05-15 | 5 | 1.1 | 14.19 | 13.96 | 26.13 | 2.00 |
| Q0135-4001 | 814 | 4.90 | 2000-01-02 | 23 | 4.7 | 13.59 | 13.29 | 26.94 | 1.84 |
| Q0254-334b | 815 | 2.43 | 2000-01-02 | 33 | 15.2 | 12.96 | 12.75 | 27.44 | 1.57 |
| 135 | 1.04 | 2000-02-15 | 27 | 27.9 | |||||
| IRAS07598+6508 | 816 | 1.34 | 2000-03-21 | 10 | 6.7 | 13.38 | 13.19 | 24.73 | 2.34 |
| FIRSTJ0840+3633 | 817 | 4.17 | 1999-12-30 | 8 | 1.9 | 13.97 | 13.85 | 25.98 | 2.11 |
| Q0842+3431 | 818 | 4.09 | 2000-01-22 | 51 | 11.7 | 13.17 | 12.91 | 27.48 | 1.65 |
| UM425 | 819 | 2.61 | 2000-04-07 | 113 | 43.7 | 12.53 | 12.28 | 27.74 | 1.60 |
| LBQS1235+1807B | 820 | 1.30 | 2000-01-21 | 5 | 3.8 | 13.66 | 13.43 | 25.45 | 2.01 |
| Q1246-0542 | 821 | 5.41 | 2000-02-08 | 43 | 8.1 | 13.34 | 13.12 | 27.30 | 1.90 |
| SBSG1542+541 | 822 | 4.55 | 2000-03-22 | 78 | 19.7 | 13.05 | 12.79 | 27.64 | 1.73 |
| aafootnotetext: Units of and are erg cm-2 s-1 and erg s-1 Hz-1, respectively. De-absorbed flux values, and are all calculated using our best-fit partial covering spectral model from Table 3, with the intrinsic (redshifted) absorption component removed from the best-fit model. We note that use of the absorbed fluxes would decrease log by about 0.23 and thereby increase by about 0.1. bbfootnotetext: Fluxes and luminosities calculated from average count rate of the 2 Chandra observations. | |||||||||
| Model | Covering | (DOF)1 | ||
|---|---|---|---|---|
| ( cm-2) | Fraction | |||
| A | … | … | 75.8 (62) | |
| B | … | 64.6 (61) | ||
| C | 56.9 (60) | |||
| ††footnotetext: NOTES: Fit parameters based on simultaneous fitting of unbinned spectra using Cash statistics. Uncertainties are 90% confidence limits. Models fit (A) a global power-law continuum of photon index with individual neutral Galactic absorption of column N (see Table 1); (B) includes global neutral absorption of column N at each quasar’s redshift; (C) allows for a global partial covering fraction of continuum by N. 11footnotetext: based on spectra binned to 5 counts per bin, using given fit parameters. |
References
- (1) Andreani, P., Franceschini, A., & Granato, G., 1999, MNRAS, 306, 161
- (2) Arav, N, Korista, K.T., de Kool, M., Junkkarinen, V. T., & Begelman, M. C. 1999, ApJ, 516, 27
- (3) Arav, N. et al., 2001, in preparation
- (4) Becker R. H. et al. 2000, ApJ 538, 72
- (5) Becker R. H. et al. 1997, ApJ 479, L93
- (6) Boroson, T. A. & Meyers, K. A. 1992, ApJ, 397, 442
- (7) Brandt, W. N. & Gallagher, S. C. 2000, NewAR, 44, 461
- (8) Brandt, W.N., Guainazzi, M., Kaspi, S., Fan, X., Schneider, D.P., Strauss, M. A. , Clavel, J., & Gunn, J.E. 2001, AJ, in press
- (9) Brotherton, M.S., Tran, H.D., Van Breugel, W., Dey, A., & Antonucci, R., 1997, ApJL 487, L113
- (10) Canalizo, G. & Stockton, A. 2000, AJ, 120, 1750
- (11) Chartas, G. 2000, ApJ, 531, 81
- (12) Cowie, L. L., Songaila, A., Hu, E. M., Egami, E., Huang, J.-S., Pickles, A. J., Ridgway, S. E., Wainscoat, R. J., & Weymann, R. J. 1994, ApJ, 432, 83
- (13) de Kool, M. & Begelman, M. C. 1995, ApJ, 455, 448
- (14) Egami, E., Iwamuro, F., Maihara, T., Oya, S., & Cowie, L.L., 1996, AJ 112, 73
- (15) Elvis, M. 2000, ApJ, 545, 63
- (16) Elvis, M., Fiore, F., Wilkes, B., McDowell, J., Bechtold, J. 1994, ApJ, 422, 60
- (17) Fabbiano, G. & Trinchieri, G. 1985, ApJ, 296, 430
- (18) Fabian A. 1999, MNRAS, 308, L39
- (19) Fiore, F., Elvis, M., Giommi, P., Padovani, P. 1998, ApJ, 492, 79
- (20) Gallagher, S. C., Brandt, W. N., Sambruna, R. M., Mathur, S., & Yamasaki, N. 1999, ApJ, 519, 549
- (21) Gallagher, S. C., Brandt, W. N., Laor, A., Elvis, M., Mathur, S., Wills, Beverley J. & Iyomoto, N. 2001, ApJ, 546, 795
- (22) George, I. M., Turner, T. J., Yaqoob, T., Netzer, H., Laor, A., Mushotzky, R. F., Nandra, K., Takahashi, T 2000, ApJ, 531, 52
- (23) Giacconi, R. et al. 2001, ApJ, 551, 624
- (24) Goodrich, R. W. 1997, ApJ, 474, 606
- (25) Green, P. J., et al. 1995, ApJ, 450, 51
- (26) Green, P. J. & Mathur, S. 1996, ApJ, 462, 637
- (27) Green, P. J. et al. 1999, BAAS, 195, 8008
- (28) Hamann, F., Korista, K. T., & Morris, S. L. 1993, ApJ, 415, 541
- (29) Hamann, F. 1998, ApJ, 500, 79
- (30) Hazard C., Mc Mahon R.G., Webb J.K., & Morton D.C. 1987, ApJ 323, 263
- (31) Hornschemeier, A. E. et al. 2000, ApJ, 541, 49
- (32) Hutsemekers, D., Lamy, H., & Remy, M. 1998 A&A, 340, 371
- (33) Kartje, J. F. 1995, ApJ, 452, 565
- (34) Kochanek, C. S., Falco E. E. & Munoz, J. A. 1998, ApJ, 510, 590
- (35) Korista, K. T. et al. 1992, ApJ, 401, 529
- (36) Krolik, J. H., Voit, G. M. 1998, ApJ, 497, 5
- (37) Lamy, H. & Hutsemekers, D. 2000, A&AS, 142, 451
- (38) Lawrence, A., Elvis, M., Wilkes, B.J., McHardy, I., & Brandt, N. 1997, MNRAS, 285, 879
- (39) Lawson, A. J. & Turner, M. J. L. 1997, MNRAS, 288, 920
- (40) Leighly, K. M. 1999, ApJS, 125, 317
- (41) Leitherer, C., Robert, C., & Drissen, L. 1992, ApJ, 401, 596
- (42) Marshall, H. L., Avni, Y., Braccesi, A., Huchra, J. P., Tananbaum, H., Zamorani, G., & Zitelli, V. 1984, ApJ, 283, 50
- (43) Mathur S. 2000, MNRAS, 314, 17
- (44) Mathur S. et al. 2000, ApJ, 533, 79
- (45) Mathur, S. Matt, G., Green, P. J., Elvis, M., & Singh, K. P. 2001, ApJL, submitted G. Matt (Roma), P.J. Green, M. Elvis (CfA), K. P. Singh (
- (46) Mathur, S. , Wilkes, B. J., Elvis, M., & Fiore, F. 1994, ApJ, 434, 493
- (47) Meylan, G., & Djorgovski, S. 1989, ApJ, 338, 1L
- (48) Michalitsianos A.G., Falco E.E., Munoz J.A., & Kazanas D. 1997, ApJ, 487, L117
- (49) Monet, D. G. 1998, BAAS, 1931, 2003
- (50) Moran, E. C., Lehnert, M. D., & Helfand, D. J. 1999 ApJ, 526, 649
- (51) Morrison, R., & McCammon, D. 1983, ApJ, 270, 119
- (52) Murray, N. & Chiang, J. 1997, ApJ, 454, L105
- (53) O’Dea, C. P. 1998, PASP, 110, 493
- (54) Ogle, P. M., Cohen, M. H., Miller, J. S., Tran, H. D., Goodrich, R. W., & Martel, A. R. 1999, ApJS, 125, 1
- (55) Pounds, K. A., Done, C., & Osborne, J. P. 1995, MNRAS, 277
- (56) Reeves, J. N. & Turner, M. J. L. 2000, MNRAS, 316, 234
- (57)
- (58) Risaliti, G., Gilli, R., Maiolino, R., & Salvati, M. 2000, A&A, 357, 13
- (59) Schartel, N., Green, P. J., Anderson, S. F., Hewett, P. C., Foltz, C. B., Margon, B., Brinkmann, W., Fink, H., & Trümper, J. 1996, MNRAS, 283,1015
- (60) Schmidt, G. & Hines, D. 1999, ApJ, 512, 125
- (61) Scoville, N. 1999, Ap&SS, 269, 367
- (62) Sprayberry, D. & Foltz, C. B. 1992, ApJ, 390, 39
- (63) Telfer, R. C., Kriss, G. A., Zheng, W., Davidsen, A. F. & Green, R. F. 1998, ApJ, 509, 132
- (64) Vignali, C., Comastri, A., Cappi, M., Palumbo, G. G. C., Matsuoka, M., & Kubo, H. 1999, ApJ, 516, 582
- (65) Voit, G. M., Weymann, R. J., & Korista, K. T. 1993, ApJ, 413, 95
- (66) Wang, T. G., Wang, J. X., Brinkmann, W., & Matsuoka, M. 1999, ApJL, 519, 35
- (67) Weymann, R. J. et al. 1991, ApJ, 373, 23
- (68) Wilkes, B. J. et al. 2001, in New Era of Wide Field Astronomy, eds. Clowes, R.G., Adamson, A.J., & Bromage, G.E. (San Francisco: Astronomical Society of the Pacific), in press
- (69) Wilman, R. J. & Fabian, A. C. 1999, MNRAS, 309, 862
- (70) Wright, A. E., Morton, D. C., Peterson, B. A., & Jauncey, D. L. 1982, MNRAS, 199, 81
- (71) Yuan, W., Brinkmann, W., Siebert, J., & Voges, W. 1998, A&A, 330, 108
- (72) Yuan, W., Matsuoka, M., Wang, T., Ueno, S., Kubo, H. & Mihara, T. 2000, ApJ, 545, 625
- (73) Zheng, W. et al. 2000, AJ, 120, 1607