The gravitational wave signal from the Galactic disk population of binaries containing two compact objects
We review the properties of Galactic binaries containing two compact objects, as derived by means of population synthesis. Using this information we calculate the gravitational wave signal of these binaries. At frequencies below mHz the double white dwarf population forms an unresolved background for the low-frequency gravitational wave detector LISA. Above this limit some few thousand double white dwarfs and few tens of binaries containing neutron stars will be resolved. Of the resolved double white dwarfs have a total mass above the Chandrasekhar limit. About of these have a measurable frequency change allowing a determination of their chirp mass. We discuss the properties of the resolved systems.
Key Words.:
Gravitational waves – Stars: statistics – binaries: close – Galaxy: stellar content1 Introduction
The interest in gravitational waves, predicted by Einstein’s theory of general relativity, was greatly enhanced by the signals supposedly detected by resonant gravitational wave (GW) antennas (Weber 1969) and the discovery of the pulsar B1916+13 in a relativistic binary (Hulse & Taylor 1975; Taylor & Weisberg 1982). Currently, about ten projects for ground and space-based gravitational wave detectors are already operating or under development (see Flanagan 1998). They will open the windows in the frequency bands 10 to Hz from the ground and to 1 Hz from space. Recently the first upper limits on detections from the Japanese TAMA300 detector were reported (Tagoshi et al. 2001).
At high frequencies the merging events of extragalactic binaries containing neutron stars and/or black holes are among the most promising sources of GW radiation. The estimates of the merger rates of these systems are highly uncertain (e.g. Phinney 1991; Portegies Zwart & Yungelson 1998; Kalogera & Lorimer 2000). An upper limit for the rate of neutron star – neutron star mergers in our Galaxy of is found both from observations (Arzoumanian et al. 1999) and theory (Tutukov & Yungelson 1993b). Extrapolated to cosmic scales, these estimates show that the perspectives for detection of such events by the first generation GW detectors are not very good (see Kalogera et al. 2000). They could be better for black hole – black hole or for black hole – neutron star mergers (Tutukov & Yungelson 1993b; Lipunov et al. 1997; Portegies Zwart & McMillan 2000).
At low frequencies, it was first expected that contact W UMa binaries will dominate the gravitational wave spectrum (Mironovskii 1965). However, it was shown that the gravitational wave background formed by Galactic disk systems is probably totally dominated by detached double white dwarfs and that their number is so large that they will form a confusion limited background for the currently planned detectors (Evans et al. 1987; Lipunov et al. 1987; Hils et al. 1990; Nelemans et al. 2000a). Only sources with a frequency above a certain limiting frequency (somewhere between mHz) can be resolved (Evans et al. 1987).
The aim of the present paper is an accurate evaluation of the confusion limit, based on population synthesis models for compact stars in the Galactic disk and a discussion of the properties of the sample of potentially resolved binaries containing two compact objects: white dwarfs, neutron stars or black holes. We first discuss the gravitational wave signal from (eccentric) binaries (Sect. 2). Next, we summarise the properties of the Galactic disk populations of compact binaries which are relevant to the emission of gravitational waves (Sect. 3). We do not consider globular cluster binaries. In Sect. 4 we present a model for the background formed by the Galactic disk double white dwarfs, discuss the confusion limit and the properties of the individually resolved binaries. A discussion of the possible contribution of the halo and extragalactic sources and a comparison with previous work follows in Sect. 5. Our conclusions are summarised in Sect. 6.
2 Gravitational waves from binaries
The gravitational wave luminosity of a binary in the th harmonic is given by (Peters & Matthews 1963)
| (1) |
Here and are the masses of the components, is their orbital separation and is the eccentricity of the orbit. The function is the Fourier decomposition of the GW signal.
The measurable signal for gravitational wave detectors is the amplitude of the wave – and for the two polarisations. These can be computed from the GW flux at the Earth (Press & Thorne 1972)
| (2) |
Assuming the waves to be sinusoidal and defining the so called strain amplitude as one obtains
| (3) | |||
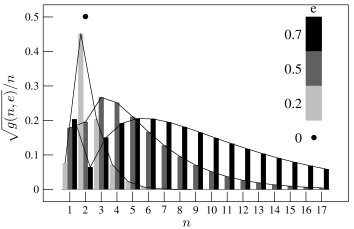
where is the so called chirp mass and is the angular frequency of the emitted wave111For circular orbits this equation is identical to Eq. (5) of Evans et al. (1987). It is different by a factor of from Eq. (20) of Press & Thorne (1972), who use a factor larger definition of and possibly confuse in Eq. (3) with the orbital angular frequency. It differs by a factor from Eq. (3.14) of Douglas & Braginsky (1979) because they confuse the orbital frequency in their Eq. (3.13), with the frequency of the wave (twice the orbital frequency) in their Eq. (3.4).. In Fig. 1 we plot the values of for different eccentricities. High eccentricity binaries emit most of their energy at higher frequencies than their orbital frequency, reflecting the fact that the radiation is more effective near periastron of the orbit. Thus, eccentric compact binaries may be detectable sources of GW signals at frequencies higher than their orbital frequency (cf. Barone et al. 1988; Hils 1991).
3 The Galactic disk population of binaries containing two compact objects
We calculated the Galactic disk population of binaries containing two compact objects using the population synthesis code SeBa (Portegies Zwart & Verbunt 1996; Portegies Zwart & Yungelson 1998; Nelemans et al. 2001b). The basic assumptions used in this paper can be summarised as follows. The initial primary masses are distributed according to a power law IMF with index , the initial mass ratio distribution is taken flat, the initial semi major axis distribution flat in log up to , and the eccentricities follow . The fraction of binaries in the initial population of main-sequence stars is 50% (2/3 of all stars are in binaries). A difference with other studies of the populations of close binaries is that the mass transfer from a giant to a main sequence star of comparable mass is calculated using an angular momentum balance formalism, as described in Nelemans et al. (2000b). For the star formation rate of the Galactic disc we use an exponential function:
| (4) |
where = 7 Gyr. With an age of the Galactic disk of 10 Gyr it gives a current star formation rate of 3.6 yr-1 compatible with observational estimates (Rana 1991; van den Hoek & de Jong 1997). It gives a Galactic supernova II/Ib rate of 0.02 yr-1 and if supernovae Ia are produced by merging double carbon-oxygen (CO) white dwarfs it gives a Galactic rate of 0.002 yr-1. Both are in agreement with observational estimates by Cappellaro et al. (1999).
| Type | |||
|---|---|---|---|
| (wd, wd) | 2.5 10-2 | 1.1 10-2 | 1.1 108 |
| wd, wd) | 3.3 10-3 | – | 4.2 107 |
| (ns, wd) | 2.4 10-4 | 1.4 10-4 | 2.2 106 |
| (ns, ns) | 5.7 10-5 | 2.4 10-5 | 7.5 105 |
| (bh, wd) | 8.2 10-5 | 1.9 10-6 | 1.4 106 |
| (bh, ns) | 2.6 10-5 | 2.9 10-6 | 4.7 105 |
| (bh, bh) | 1.6 10-4 | – | 2.8 106 |
The current birth- and merger rates and total number of systems in the Galactic disk with these assumptions are given in Table 1. We use a notation introduced by Portegies Zwart & Verbunt (1996): wd, ns and bh for white dwarf, neutron star and black hole respectively; and for detached and semi-detached binaries. The fact that the numbers here are different from the numbers given in Portegies Zwart & Yungelson (1998, 1999)222Note that Portegies Zwart & Yungelson (1999) consider only a subset of the (ns, wd) population, namely the systems that are eccentric and contain a white dwarf more massive than 1.1 . For this subset they find a birth rate that is comparable to the birth rate of double neutron stars., Nelemans et al. (2001b) and Brown et al. (2001) is caused by the differences in the assumed IMF, initial binary fraction and star formation history.
In Fig. 2 we show the period distributions of the
binaries of different types in the range of interest for space based
gravitational wave detectors. The properties of these populations can
be summarised as follows:
Detached double white dwarf binaries: (wd, wd).
Our model for the Galactic disk population of double white dwarfs is
described in detail in Nelemans et al. (2001b). Most double white dwarfs have a
mass ratio around unity and low-mass () components.
From Table 1 and Fig. 2 it is clear
that they vastly outnumber all other binaries with compact objects in
the Galactic disk.
Semi-detached double white dwarfs (AM CVn stars): [wd, wd).
We include in our calculation both AM CVn stars descending from
detached close double white dwarfs and from low-mass helium stars with
white dwarf companions (Nelemans et al. 2001a). We use Model II of Nelemans et
al., which is most favourable for the formation of AM CVn’s.
Neutron star – white dwarf binaries: (ns, wd).
Neutron star - white dwarf binaries fall into two families
(Tutukov & Yungelson 1993a; Portegies Zwart & Yungelson 1999; Tauris & Sennels 2000). In one family the neutron star is formed
first. Later the secondary forms a white dwarf and in the mass
transfer event the orbit circularizes (e.g. van den Heuvel & Taam 1984). If both
components of the initial binary are of comparable mass it can happen
that the primary becomes a white dwarf, while the secondary accretes
so much mass that it becomes a neutron star (e.g. Tutukov & Yungelson 1993a). In
this case the orbits are eccentric. The masses of the white dwarfs
are typically low in the first family and high in the second (see
Fig. 5 below).
Double neutron star binaries: (ns, ns).
The formation and characteristics of the current population of double
neutron stars is extensively studied by us in Portegies Zwart & Yungelson (1998). Maybe the
most important assumption, which influences the birth rate, orbital
periods and eccentricities of neutron star – neutron star binaries,
is the kick velocity distribution. We use the one proposed by Hartman (1997).
Black hole binaries: (bh, wd), (bh, ns) and (bh, bh).
The knowledge of the way in which black holes are formed and the range
of masses of their progenitors are still highly uncertain
(see e.g. Woosley & Weaver 1995; Portegies Zwart et al. 1997; Ergma & van den Heuvel 1998; Wellstein & Langer 1999; Fryer 1999). The treatment of the
formation of black holes implemented in the present study is described
in some detail in the Appendix. Typical black holes in our model have
masses between 5 and 7 . In the short orbital period range
(Fig. 2) they are rare and their merger rates are at
least an order of magnitude lower than those of the neutron star
binaries (Table 1). Double black hole binaries are
absent in this period range and do not merge at all in our model.


4 The gravitational wave signal from compact binaries in the Galactic disk
Merging of binaries containing neutron stars and black holes in distant galaxies could give measurable signals in the high frequency detectors. We do not extrapolate our merger rates to extragalactic scales, but our inferred rates (Table 1) are consistent with the (very uncertain) rates derived elsewhere for the Galaxy (see for a detailed discussion Kalogera et al. 2000).
The Galactic binaries with periods less than 10 hr are interesting for the low-frequency GW detectors. We calculate the expected signal for LISA, the joint ESA, NASA detector that is expected to be launched around 2010. It will consist of three satellites, 5 million kilometres apart, between which laser beams will be exchanged, measuring the distance changes (McNamara et al. 2000). It will give the GW amplitude as a function of frequency with fixed frequency resolution. A limited angular resolution will be achieved, allowing e.g. identification of sources in globular clusters (see Benacquista et al. 2001). In our calculations we restrict ourselves to the sensitivity in frequency and do not consider the angular resolution.
Because the number of Galactic binaries drops strongly towards shorter periods (Fig. 2) the number of sources per frequency bin for detectors with a fixed frequency resolution will also decrease: at low frequencies the signals in particular frequency bins will overlap, forming a so called “confusion limited noise”. Above a certain limiting frequency, called the “confusion limit”, there is not more than one system per frequency bin, so the systems can be resolved individually. We discuss these regimes separately.
4.1 The confusion limited background due to double white dwarfs
Evans et al. (1987) have shown that for space-born detectors the confusion limit is determined by the Galactic close binary white dwarfs. In our model the total number of detached and semi-detached double white dwarfs in the Galactic disk is (see Table 1). We distribute these systems randomly in the Galactic disk according to
| (5) |
Here = 2.5 kpc (Sackett 1997) and = 200 pc, neglecting the age and mass dependence of . All systems are circular and for each system we calculate the strain amplitude from Eq. (3) taking kpc and pc.
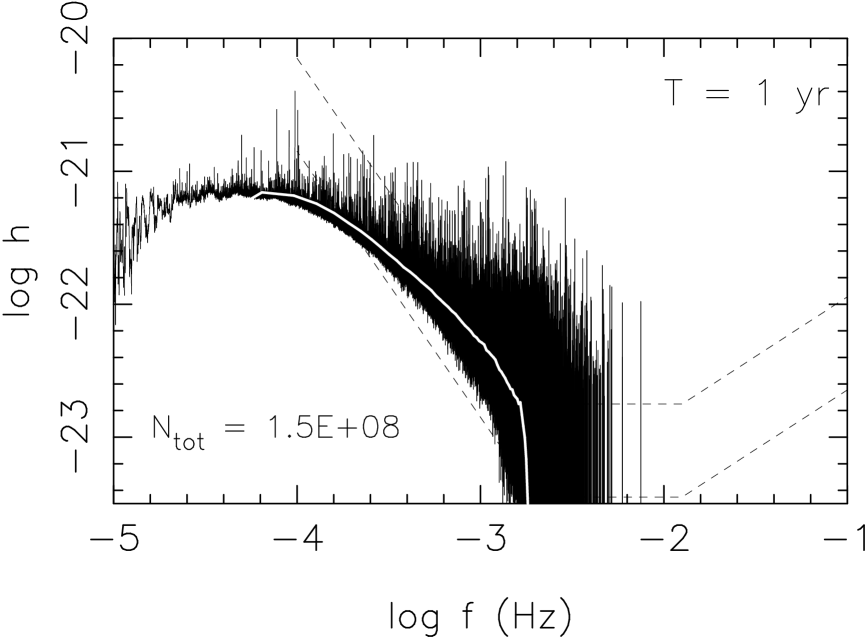
To simulate the power spectrum for this population of binaries as would be detected by a gravitational wave detector in space we determine the distribution of the systems over wide bins, with the total integration time (for which we use 1 yr). In Fig. 3 we plot the resulting confusion limited background signal and the number of systems per bin. The contribution of the semi-detached double white dwarfs, which are less numerous than the detached double white dwarfs and have lower strain amplitude is concentrated in a relatively small frequency interval between and where they dominate the number of systems per bin.
Most previous studies used only the average properties of the double white dwarf population to calculate the average background signal. In Fig. 3 we plotted the average of our model power spectrum as the white line. Note that in many bins the actual power is much larger than the average. These bins contain one system that has a much stronger signal than the rest, for example because it is close to the Earth, and it may be detectable above the noise (see Sect. 4.3).

4.2 The population of resolved binaries
Given the fact that the double white dwarf background buries all underlying signals at frequencies below , we did not consider the neutron star and black hole binaries below 1 mHz. To find the binaries that will be resolved by LISA, we calculated the Galactic disk population of all binaries containing compact objects which contribute to the GW signal at frequencies above 1 mHz. Because we now also consider eccentric binaries, which emit at frequencies higher than twice the orbital frequency [Eq. (3)], there are contributions from binaries with orbital periods up to 10 hr.
If one considers an average background as done i.e. by Evans et al. (1987), the average number of systems per bin at a certain moment drops below one system. However, we model all individual systems in the Galaxy and determine, for an integration time of 1 yr, for each frequency bin () how many systems it contains. In Fig. 4 we plot the fraction of bins that contain exactly one, none and more than one system as function of frequency. The figure shows that the notion of a “confusion limit” as a unique value is too simple. At the first resolved bins (i.e. containing exactly one system) are found, while up to bins containing more than one system are still present.
| Type | resolved systems | detectable above noise |
|---|---|---|
| (wd, wd) | 12124 | 5943 |
| (ns, wd) | 38 | 124 |
| (ns, ns) | 8 | 31 |
| (bh, wd) | 1 | 3 |
| (bh, ns) | 0 | 3 |
| total | 12171 | 6104 |
The total number of resolved systems with a signal above the sensitivity limit (S/N = 1) of LISA for an assumed integration time of 1 yr is 12171. In Table 2 we give the numbers of binaries of different types that are resolved. The eccentric binaries can contribute to more than one frequency [Eq. (3)], but the amplitude of the signal in the high harmonics in general is rather low. Just below the LISA sensitivity limit for = 1 yr there are indeed 3 high harmonics of (ns, wd) binaries and one of a double neutron star in our model.
The change of the frequency of a binary evolving under the influence of GWR is given by (e.g. Schutz 1996)
| (6) |
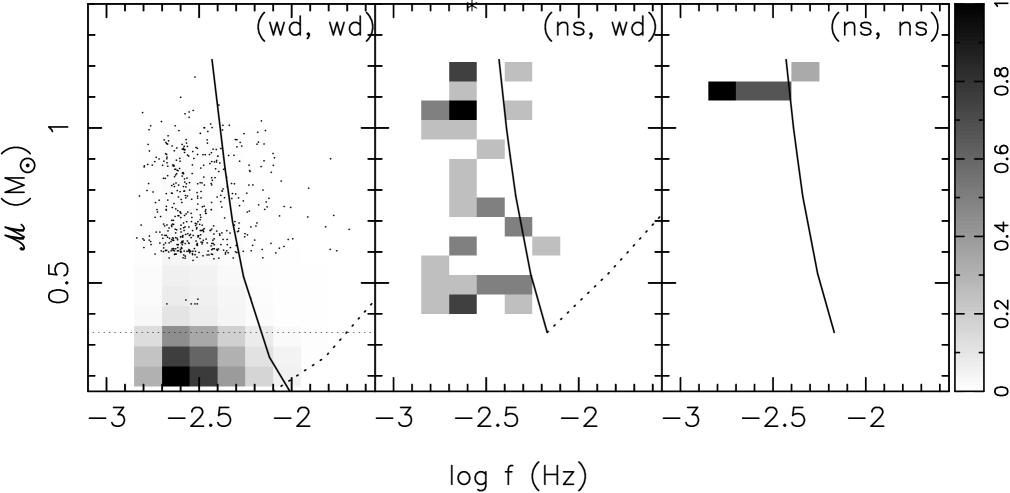
For high-frequency systems this means that during a sufficiently long integration time the change of the frequency (the “chirp”) can be detected and hence, be determined. Then from Eq. (3) the distance to these sources can be found. In Fig. 5 we plot the frequency versus chirp mass distributions of the resolved systems for the binaries of different types to show their properties separately. In the panel with the double white dwarf systems we plot the so called chirp line, for yr, as the solid line. Systems to the right of this line change their frequency during the integration by one or more bins (). The position at which the systems merge is plotted as the dotted line in the left two panels.
The horizontal straight dotted line in Fig. 5 (left panel) marks the lower limit of for systems with a total mass larger than the Chandrasekhar mass which may be type Ia Supernovae (SNe Ia) precursors. The resolved systems above this line are plotted as the dots, since because of their relatively small number (501 systems) the grey shades above this line are practically invisible in the plot.
In the (ns, wd) panel we also plot the chirp and merger line, assuming for the latter that the systems emit at the fundamental () frequency. In our model the mass of a neutron star is between and , depending on the initial mass of the progenitor. This results in a very narrow range in chirp masses for the double neutron star systems.
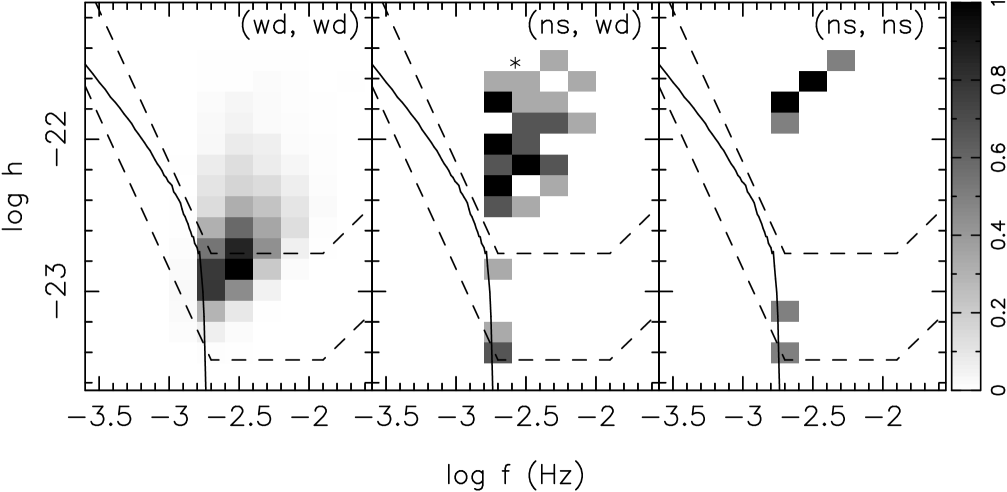
The quantities measured by detectors like LISA are the frequency and the strain amplitude [Eq. (3)]. In Fig. 6 we plot the distributions of the expected resolved systems over and . In Fig. 6 we also show the sensitivity limits of LISA for monochromatic sources, for signal to noise ratios of 5 and 1 and an integration time of 1 yr (adapted from Fig. 5 and Eq. (53) of Larson et al. 2000). The solid line gives the averaged noise background as produced by double white dwarfs (see Fig. 3).
4.3 Other detectable systems?
It may well be that the systems which produce strong signals because of their proximity to the Sun or a large chirp mass can be detected individually above the noise background (see Fig. 3). To investigate this possibility, we computed the number of systems of the different types that are not resolved, but have a strain amplitude well above the noise background, by selecting all systems that have a signal above the S/N = 5 sensitivity limit of LISA (see Fig. 3). This adds a considerable number of potentially detectable systems to the resolved binaries (Table 2). It brings the total number of potentially detectable binaries containing neutron stars to almost 200 for an integration time of 1 yr.
5 Discussion
5.1 Halo and extra-galactic sources
Above, the confusion limit and the number of resolved sources were calculated for the Galactic disk binaries. However, for example, Galactic halo objects and extragalactic binaries may also contribute to the GW signal in the LISA band.
The results of microlensing experiments can be considered as evidence for the existence of massive compact halo objects (MACHO’s). The most likely MACHO mass is between 0.15 and 0.9 , depending on the halo model, and the total mass in MACHO’s out to 50 kpc is , independent of the halo model (Alcock et al. 2000). The nature of MACHO’s is still unknown (e.g. Gates et al. 1998), but two possibilities are relevant to this study.
The first is that they are white dwarfs (Tamanaha et al. 1990). A discussion is still going on whether the presence of a significant white dwarf population is compatible with constraints derived from the chemical composition of the halo and the cooling properties of white dwarfs (e.g. Chabrier 1999; Fields et al. 2000; Hansen 2000). The fraction of binaries in this hypothetical population is unknown. However, because the star formation in the halo happened long ago (e.g. Adams & Laughlin 1996), most short period double white dwarfs that could have formed will already have merged. For example, for a 1 Gyr long burst of star formation, 10 Gyr ago, with an IMF similar to the IMF of the disk, all halo close binary white dwarfs currently have orbital periods longer than hr, so they cannot contribute to the GW signal at frequencies higher than . The observed deficit of halo white dwarf progenitors in distant galaxies (Adams & Laughlin 1996) suggests that the IMF in the halo is peaked at or above 2 , limiting a hypothetical double white dwarf population to even lower frequencies. Hence, we do not expect a change in the confusion limit due to halo white dwarfs, but they could contribute to the noise below this limit.
Existing estimates of the contribution of halo double white dwarfs to the GW noise (Hiscock et al. 2000) are based on a simple rescaling to the halo of the estimate of the GW signal from the disk by Hils et al. (1990). Because of the different evolutionary histories of disk and halo this is unrealistic. Additionally, Hiscock et al. (2000) use the lowest existing observational estimate of the local white dwarf space density, probably overestimating the relative importance of a possible halo white dwarf population.
Another possibility is that MACHO’s are low-mass black holes. Formation of low-mass () black holes is possible in inflationary cosmological models (e.g. Naselskii & Polnarev 1985). Further, as was shown by Nakamura et al. (1997), these black holes may form binaries. An estimate by Hiscock (1998) shows that under certain assumptions about the separations of the components, the GW background formed by halo binary black holes can be much stronger than the signal from the Galactic binary white dwarfs. If this model is correct, the noise produced by halo objects would bury virtually all resolved signals from Galactic systems (compare our Fig.3, left panel and Fig. 2 of Hiscock 1998). This would result in the non-detection of any resolved systems by LISA, and show up as an anisotropic noise.
A significant contribution from extragalactic binaries to the background is expected only if the star formation keeps increasing at (Kosenko & Postnov 1998). A computation with a star formation rate which is almost constant at and roughly the same input for stellar evolution as used in this study (Schneider et al. 2000), showed that only just above the point where the Galactic disk double white dwarf background drops sharply (around ) the extragalactic background could exceed the Galactic one. However, the signals of the resolved binaries at these frequencies are at least an order of magnitude stronger than this background and will probably be detectable (see our Fig. 6 and Fig. 12 of Schneider et al. 2000).
Finally it should be noted that, in addition to our estimate above, a few tens of double neutron stars and neutron star – white dwarf binaries in globular clusters will probably be resolved (Benacquista et al. 2001).
5.2 Comparison with previous studies
The Galactic GW background produced by double white dwarfs was studied earlier by e.g. Evans et al. (1987); Lipunov et al. (1987); Hils et al. (1990); Postnov & Prokhorov (1998); Webbink & Han (1998). The most widely quoted study is the one by Hils et al. (1990), who calculated the background based on the estimates of the number of systems by Webbink (1984). Because Webbink found a considerably higher birth rate of close double white dwarfs than we find, Hills et al. found a higher noise background. The same holds for the study by Evans et al. (1987), who in addition use a different Galactic distribution. When we estimate the difference in the total number of systems in the Galaxy from the different birth rates, we find that the renormalised background levels differ by a factor .
Webbink & Han (1998) use a current birth rate of 0.03 yr-1, similar to ours, but a constant star formation history and a larger age of the Galactic disk, of 15 Gyr (Han 1998). Their estimate of the background is slightly higher that what we find, probably due to the higher average chirp mass (0.42) of their (wd, wd) systems or their assumed Galactic distribution, which is slightly different from our Eq. (5). Because they also calculated individual systems (which they later average), they calculate the number of resolved systems (although with a different criterium). Above the resolution limit found by Han & Webbink () we have 3615 resolved systems in agreement with their number of 3600, despite differences in the underlying white dwarf population.
The fact that most studies give an estimate of the confusion limit within a factor from mHz found by us is a consequence of weak dependence of this limit on the parameters of the models [see Eq. (19) of Evans et al. (1987)].
The background due to semi-detached white dwarfs was calculated by Hils & Bender (2000). They conclude (as we do) that these stars are not important for the overall background. This can be understood as a consequence of their low strain amplitude due to their low chirp mass, which makes them unimportant even in the frequency range where they outnumber the detached systems.
6 Conclusion
We calculated the gravitational wave signal of Galactic disk binaries containing two compact objects. We discuss three populations: (i) double white dwarfs (including semi-detached systems) which produce a confusion limited noise background at low frequencies (), (ii) resolved binaries and (iii) unresolved systems that have such a strong signal that they may be detected above the noise.
The confusion limited background is dominated by detached double white dwarfs, although in a small frequency range () the semi-detached systems form the majority of the systems in each bin. The double white dwarf gravitational wave background, which in our model consists of the sum of the signal of all 150 million systems in the Galaxy shows large spikes caused by strong-signal (i.e. close) systems, which might be detectable above the noise.
Adding the binaries containing neutron stars and black holes (which are much less numerous than white dwarf pairs), we find the distribution of bins containing one, none and more than one system and show that the “confusion limit” as a single value does not exist: at the first resolved bins are found, while up to bins containing more than one system are present.
We find 12171 resolved systems of which the vast majority are double white dwarfs. There are only 8 double neutron stars and 38 neutron star - white dwarf binaries resolved. Finally we calculate that there are 6104 systems (5943 double white dwarfs, 124 neutron star – white dwarf systems, 31 double neutron stars and 6 systems containing a black hole) which have a signal well above the double white dwarf background and the LISA sensitivity level and might be detectable.
Out of 12124 resolved double white dwarfs, 501 have a combined mass above the Chandrasekhar limit and periods short enough to merge in 10 Gyr and are thus potential SN Ia progenitors. Such double white dwarfs have not yet been found optically. If a system would chirp, LISA will measure the chirp mass and the distance to the system allowing a good estimate of its total mass. The number of chirping SN Ia progenitors is for an integration time of 1 yr. But even for these systems the actual time to coalescence is yr.
Acknowledgements.
We thank Frank Verbunt for stimulating discussions. LRY and SPZ acknowledge the warm hospitality of the Astronomical Institute “Anton Pannekoek”. This work was supported by NWO Spinoza grant 08-0 to E. P. J. van den Heuvel, RFBR grant 99-02-16037, the Russian Ministry of Science Program “Astronomy and Space Research” and by NASA through Hubble Fellowship grant HF-01112.01-98A awarded (to SPZ) by the Space Telescope Science Institute, which is operated by the Association of Universities for Research in Astronomy, Inc., for NASA under contract NAS 5-26555.References
- Adams & Laughlin (1996) Adams, F. C. & Laughlin, G. 1996, ApJ, 468, 586
- Alcock et al. (2000) Alcock, C., Allsman, R. A., Alves, D. R., et al. 2000, ApJ, 542, 281
- Arzoumanian et al. (1999) Arzoumanian, Z., Cordes, J. M., & Wasserman, I. 1999, ApJ, 520, 696
- Barone et al. (1988) Barone, F., Milano, L., Pinto, I., & Recano, F. 1988, A&A, 199, 161
- Benacquista et al. (2001) Benacquista, M. J., Portegies Zwart, S., & Rasio, F. A. 2001, to appear in Class. Quantum Grav., gr-qc/0010020
- Brown et al. (2001) Brown, G. E., Lee, C.-H., Portegies Zwart, S. F., & Bethe, H. 2001, ApJ, 547, 345
- Cappellaro et al. (1999) Cappellaro, E., Evans, R., & Turatto, M. 1999, A&A, 351, 459
- Chabrier (1999) Chabrier, G. 1999, ApJ, 513, L103
- Charles (1998) Charles, P. A. 1998, in Theory of Black Hole Accretion Disks, ed. M. Abramowicz, G. Bjornsson, & J. Pringle (Cambridge: CUP), 1
- Douglas & Braginsky (1979) Douglas, D. H. & Braginsky, V. B. 1979, in General Relativity An Einstein centenary survey, ed. S. W. Hawking & W. Israel (Cambridge: CUP), 90
- Eggleton et al. (1989) Eggleton, P. P., Fitchett, M. J., & Tout, C. A. 1989, ApJ, 347, 998
- Ergma & van den Heuvel (1998) Ergma, E. & van den Heuvel, E. P. J. 1998, A&A, 331, L29
- Evans et al. (1987) Evans, C. R., Iben, Jr, I., & Smarr, L. 1987, ApJ, 323, 129
- Fields et al. (2000) Fields, B. D., Freese, K., & Graff, D. S. 2000, ApJ, 534, 265
- Flanagan (1998) Flanagan, E. 1998, in Gravitation and Relativity: At the Turn of the Millennium, 177, gr-qc/9804024
- Fryer (1999) Fryer, C. L. 1999, ApJ, 522, 413
- Gates et al. (1998) Gates, E. I., Gyuk, G., Holder, G. P., & Turner, M. S. 1998, ApJ, 500, L145
- Han (1998) Han, Z. 1998, MNRAS, 296, 1019
- Hansen (2000) Hansen, B. M. S. 2000, in Microlensing 2000: A new era of microlensing astrophysics, ed. J. W. Menzies & P. D. Sackett, ASP Conf. Ser.
- Hartman (1997) Hartman, J. W. 1997, A&A, 322, 127
- Hils (1991) Hils, D. 1991, ApJ, 381, 484
- Hils & Bender (2000) Hils, D. & Bender, P. L. 2000, ApJ, 537, 334
- Hils et al. (1990) Hils, D., Bender, P. L., & Webbink, R. F. 1990, ApJ, 360, 75
- Hiscock (1998) Hiscock, W. A. 1998, ApJ, 509, L101
- Hiscock et al. (2000) Hiscock, W. A., Larson, S. L., Routzahn, J. R., & Kulick, B. 2000, ApJ, 540, L5
- Hulse & Taylor (1975) Hulse, R. A. & Taylor, J. H. 1975, ApJ, 195, L51
- Kalogera & Lorimer (2000) Kalogera, V. & Lorimer, D. R. 2000, ApJ, 530, 890
- Kalogera et al. (2000) Kalogera, V., Narayan, R., Spergel, D. N., & Taylor, J. H. 2000, ApJ, submitted, astro-ph/0012038
- Kosenko & Postnov (1998) Kosenko, D. I. & Postnov, K. A. 1998, A&A, 336, 786
- Langer (1989) Langer, N. 1989, A&A, 220, 135
- Larson et al. (2000) Larson, S. L., Hiscock, W. A., & Hellings, R. W. 2000, Phys. Rev. D, 62, 062001
- Lipunov et al. (1987) Lipunov, V. M., Postnov, K. A., & Prokhorov, M. E. 1987, A&A, 176, L1
- Lipunov et al. (1997) —. 1997, Pisma Astronomicheskii Zhurnal, 23, 563
- McNamara et al. (2000) McNamara, P. W., Ward, H., & Hough, J. 2000, Advances in Space Research, 25, 1137
- Mironovskii (1965) Mironovskii, V. N. 1965, SvA, 9, 752
- Nakamura et al. (1997) Nakamura, T., Sasaki, M., Tanaka, T., & Thorne, K. S. 1997, ApJ, 487, L139
- Naselskii & Polnarev (1985) Naselskii, P. D. & Polnarev, A. G. 1985, SvA, 29, 487
- Nelemans et al. (2000a) Nelemans, G., Portegies Zwart, S. F., & Verbunt, F. 2000a, in Gravitational Waves and Experimental Gravity, ed. J. Trân Thanh Vân, J. Dumarchez, S. Reynaud, C. Salomon, S. Thorsett, & J. Y. Vinet, XXXIVth Rencontres de Moriond (Hanoi: World Publishers), 119
- Nelemans et al. (2001a) Nelemans, G., Portegies Zwart, S. F., Verbunt, F., & Yungelson, L. R. 2001a, A&A, 368, 939
- Nelemans et al. (1999) Nelemans, G., Tauris, T. M., & van den Heuvel, E. P. J. 1999, A&A, 352, L87
- Nelemans et al. (2000b) Nelemans, G., Verbunt, F., Yungelson, L. R., & Portegies Zwart, S. F. 2000b, A&A, 360, 1011
- Nelemans et al. (2001b) Nelemans, G., Yungelson, L. R., Portegies Zwart, S. F., & Verbunt, F. 2001b, A&A, 365, 491
- Peters & Matthews (1963) Peters, P. C. & Matthews, J. 1963, Phys. Rev., 131, 435
- Phinney (1991) Phinney, E. S. 1991, ApJ, 380, L17
- Portegies Zwart & McMillan (2000) Portegies Zwart, S. F. & McMillan, S. L. W. 2000, ApJ, 528, L17
- Portegies Zwart & Verbunt (1996) Portegies Zwart, S. F. & Verbunt, F. 1996, A&A, 309, 179
- Portegies Zwart et al. (1997) Portegies Zwart, S. F., Verbunt, F., & Ergma, E. 1997, A&A, 321, 207
- Portegies Zwart & Yungelson (1998) Portegies Zwart, S. F. & Yungelson, L. R. 1998, A&A, 332, 173
- Portegies Zwart & Yungelson (1999) —. 1999, MNRAS, 309, 26
- Postnov & Prokhorov (1998) Postnov, K. A. & Prokhorov, M. E. 1998, ApJ, 494, 674
- Press & Thorne (1972) Press, W. & Thorne, K. S. 1972, ARA&A, 10, 335
- Rana (1991) Rana, N. C. 1991, ARA&A, 29, 129
- Sackett (1997) Sackett, P. D. 1997, ApJ, 483, 103
- Schaller et al. (1992) Schaller, G., Schaerer, D., Meynet, G., & Maeder, A. 1992, A&AS, 96, 269
- Schneider et al. (2000) Schneider, R., Ferrari, V., Matarrese, S., & Portegies Zwart, S. F. 2000, MNRAS, submitted, astro-ph/0002055
- Schutz (1996) Schutz, B. F. 1996, Class. Quantum Grav., 13, A219
- Tagoshi et al. (2001) Tagoshi, H., Kanda, N., Tanaka, T., et al. 2001, Phys. Rev. D, 63, 231
- Tamanaha et al. (1990) Tamanaha, C. M., Silk, J., Wood, M. A., & Winget, D. E. 1990, ApJ, 358, 164
- Tauris & Sennels (2000) Tauris, T. M. & Sennels, T. 2000, A&A, 355, 236
- Taylor & Weisberg (1982) Taylor, J. H. & Weisberg, J. M. 1982, ApJ, 253, 908
- Tutukov & Yungelson (1993a) Tutukov, A. V. & Yungelson, L. R. 1993a, ARep, 37, 411
- Tutukov & Yungelson (1993b) —. 1993b, MNRAS, 260, 675
- van den Heuvel & Taam (1984) van den Heuvel, E. P. J. & Taam, R. E. 1984, Nature, 309, 235
- van den Hoek & de Jong (1997) van den Hoek, L. B. & de Jong, T. 1997, A&A, 318, 231
- Webbink (1984) Webbink, R. F. 1984, ApJ, 277, 355
- Webbink & Han (1998) Webbink, R. F. & Han, Z. 1998, in Laser Interferometer Space Antenna, AIP Conf. Proc. No. 456 (New York: AIP), 61
- Weber (1969) Weber, J. 1969, Phys. Rev. Lett., 22, 1302
- Wellstein & Langer (1999) Wellstein, S. & Langer, N. 1999, A&A, 350, 148
- White & van Paradijs (1996) White, N. E. & van Paradijs, J. 1996, ApJ, 473, L25
- Woosley & Weaver (1995) Woosley, S. E. & Weaver, T. A. 1995, ApJS, 101, 181
Appendix A The formation of black holes
The simplified description of the evolution of massive stars used in this paper is based on results of Eggleton et al. (1989) and Schaller et al. (1992) and can be summarised as follows (see also Portegies Zwart & Yungelson 1998)
-
1.
The radii of the massive stars are limited to 1000 (after Schaller et al. 1992).
-
2.
The maximum amount of mass loss for hydrogen rich massive stars is given by 0.01 , unless the whole envelope is lost and the star becomes a Wolf-Rayet star. Thus stars above 85 evolve off the main sequence immediately to become Wolf-Rayet stars with an initial mass of 43 (after Schaller et al. 1992).
-
3.
Wolf-Rayet stars lose mass according to the equation proposed by Langer (1989): yr-1.
-
4.
In the supernova 50% of the mass of the exploding object is ejected (consistent with Nelemans et al. 1999).
-
5.
Exploding helium stars more massive than 10 collapse to a black hole. Thus, the lower limit for black hole masses of is consistent with observational estimates (e.g. Charles 1998).
-
6.
Black holes do not get a kick at birth in contrast to neutron stars (e.g. White & van Paradijs 1996).