1]Max-Planck-Institut für extraterrestrische Physik, Garching, Germany 2]Space Research Organization Netherlands, Utrecht, The Netherlands 3]Space Science Center, University of New Hampshire, Durham, USA 4]Astrophysics Division, ESTEC, Noordwijk, The Netherlands 5]NASA/Goddard Space Flight Center, Greenbelt, MD 20771, USA 6]High Energy Astrophysics Lab, IHEP, P.O.Box 918-3, Beijing, China
COMPTEL Observations of the Blazar PKS 1622-297 during a Gamma-Ray High State in 1995
Abstract
PKS 1622-297 was detected as a source of -rays by the EGRET experiment at energies above 100 MeV during a -ray outburst June and July 1995. We analyzed the COMPTEL data (0.75-30 MeV) of this time period to investigate the behaviour of PKS 1622-297 at lower -ray energies. The blazar is significantly (5.7) detected by COMPTEL at energies above 10 MeV. Below 10 MeV the source is only marginally (3-10 MeV band) or not (below 3 MeV) detected. The summed MeV spectrum shows a ’hard’ ( 2, ) shape and, if combined with the simultaneous EGRET spectrum, a spectral break at MeV energies is indicated. We present the COMPTEL results (light curves, spectra) and compare them to results derived in neighbouring energy bands, in particular to the EGRET one.
keywords:
-rays: observations - galaxies: active - galaxies: quasars: individual: PKS 1622-2971 Introduction
The EGRET experiment aboard CGRO has identified more than 60 blazar-type AGN emtting at high-energy (100 MeV) -rays (Hartman et al. 1999). Most of them show a time-variable -ray flux and a few even strong -ray flares. One such example is PKS 1622-297, which was detected by EGRET during a -ray high state in June and July 1995, and on top of that showed a strong -ray flare lasting for a few days (Mattox et al. 1997). After the -ray activity of PKS 1622-297 was recognized by EGRET a target-of-opportunity (ToO) observation for CGRO was scheduled which led to the detection of PKS 1622-297 also at hard X- to soft -rays by the OSSE experiment (Kurfess et al. 1995).
The COMPTEL experiment (Schönfelder et al. 1993), measuring in the MeV band between 0.75 and 30 MeV, has detected 9 blazars (e.g., Collmar et al. 1999). Among them is PKS 1622-297 which was detected during this -ray high state period in 1995. Preliminary MeV results have been reported by Collmar et al. (1997). In this paper we briefly present first results of a detailed analysis of the COMPTEL data of this period, and compare them to results in neighbouring energy bands, in particular to the EGRET band. A more detailed presentation of the results of the analysis will be given in Zhang et al. (2001).
| VP | Date | Offset angle |
|---|---|---|
| 421.0 | 06/06/95-13/06/95 | 14.5∘ |
| 422.0 | 13/06/95-20/06/95 | 15.2∘ |
| 423.0 | 20/06/95-30/06/95 | 19.2∘ |
| 423.5 | 30/06/95-10/07/95 | 3.0∘ |
2 OBSERVATION AND DATA ANALYSIS
PKS 1622-297 was observed during a four-week observations towards the Galactic Center region from June 6 to July 10, 1995 covering the CGRO viewing periods (VPs) 421 to 423.5. For more details on the observations see Tab. 1.
The analyses were carried out using the standard COMPTEL maximum-likelihood analysis procedure (e.g., de Boer et al. 1992) including a filtering technique for background generation (e.g., Bloemen et al. 1994) to derive detection significances, fluxes and flux errors of the -ray source in the four standard COMPTEL energy bands. Diffuse emission models have been included in the analysis to subtract off the diffuse galactic -ray emission.
3 Results
3.1 Detections
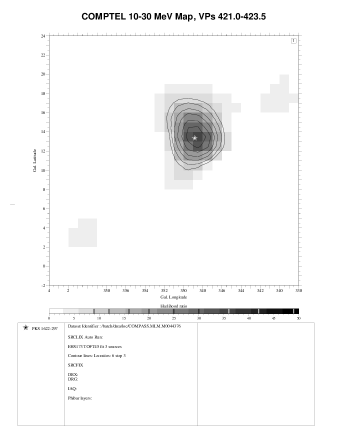
In the sum of the 4 weeks, PKS 1622-297 is detected with a significance of 5.7 in the upper – 10 - 30 MeV – COMPTEL band (Fig. 1). Below 10 MeV the source becomes weak. In the 3 - 10 MeV band only a hint is obtained, and below 3 MeV the source is not detected anymore. Above 10 MeV there is evidence for the source in all 4 individual VPs showing that PKS 1622-297 was emitting MeV -rays for the whole period. However, the detection significances with about 2 to 3 each, become weak. The relevant fluxes and upper limits are given in Tab. 2.
| Period (VP) | 0.75-1 | 1-3 | 3-10 | 10-30 |
|---|---|---|---|---|
| 421.0 | 28.3 | 25.2 | 10.7 | 3.41.7 |
| 422.0 | 18.313.6 | 28.0 | 8.9 | 3.21.5 |
| 423.0 | 18.112.5 | 23.9 | 10.0 | 5.11.5 |
| 423.5 | 21.5 | 20.8 | 9.7 | 1.81.0 |
| 421.0-423.5 | 17.4 | 11.2 | 2.01.9 | 3.50.7 |


3.2 Time Variability
The EGRET (100 MeV; from Hartman et al. 1999) and COMPTEL 10-30 MeV light curve of the 4 individual CGRO VPs show neither for COMPTEL nor for EGRET strong evidence for time variability (Fig. 2). However, on shorter time scales (1 day) Mattox et al. (1997) reports strong time variability including an major flare event on top of the -ray high state, which occurred within VP 423 and lasted for about 2 days (Fig. 3). We searched the COMPTEL data for a possible simultaneous MeV flare, by subdividing VP 423 according to the EGRET light curve in 3 parts: a pre-flare (TJD 9888.8 - 9892.7), on-flare (TJD 9892.7 - 9894.7), and post-flare part (TJD 9894.7 - 9898.6). The fluxes for the on-flare and post-flare part are higher than the other 10-30 MeV fluxes indicating the presence of the flare also at MeV energies (Fig. 3). We note, however, that the highest COMPTEL flux is found after the flare in the EGRET band had already vanished. This indicates a possible time delay of a few days between the two bands in the sense that the higher energies come first.
3.3 Energy Spectra
We have added the COMPTEL data of the 4-week high-state period to generate an average MeV spectrum. Due to the non-detections below 3 MeV only 2 spectral points are derived, which, nevertheless, indicate a hard ( 2, ) spectrum of PKS 1622-297 at MeV energies (Fig. 4). We also generated the simultaneous EGRET spectrum of PKS 1622-297, which is between 30 MeV and 10 GeV sufficiently fitted by a power-law shape with a photon index of 2.2. If the simultaneous EGRET and COMPTEL spectra are combined (Fig. 4), a spectral break at MeV energies becomes obvious. A fit of this simultaneous EGRET and COMPTEL spectrum with a broken power-law model indicates the break energy to be around 20 MeV. Due to the marginal COMPTEL detections below 10 MeV, the amount of the spectral break, i.e. the change in photon index from the higher to the lower energies, is not well determined. Its lower limit, however, should be larger than 0.6.

After the -ray activity of PKS 1622-297 had been recognized by EGRET, a ToO observation (VP 423.5) was carried out, where OSSE participated. This provided the possibility to measure the spectrum down to 0.05 MeV. Mattox et al. (1997) reported that the OSSE and EGRET data itself can be represented by power-law shapes with similar photon indices of 2.00.2 and 2.20.1, respectively (Fig. 5). However, fitting a simple power-law shape to the combined OSSE/EGRET data, they obtained a photon spectral index of 1.870.02. We have analysed the COMPTEL data of VP 423.5 and have added the spectral results to this combined OSSE-EGRET spectrum (Fig. 5). Although these COMPTEL data are not really constraining, they – at first glance – support a more complex spectral shape at -ray energies than the simple power-law model.
4 Discussion
In general, PKS 1622-297 shows a similar behaviour as is observed in other such sources, like PKS 0528+134 and 3C 279 for example. During flaring events observed by EGRET, PKS 1622-297 is detected – predominantly – at the upper COMPTEL energies, resulting in a ’hard’ MeV spectrum and showing a spectral break in the combined COMPTEL-EGRET spectrum. These facts indicate that the flare is more efficient at higher -ray energies. Such a behaviour can generally be explained in a multi-component -ray emission scenario, consisting of synchrotron-self Compton and external Comptonization components. Because they have different dependencies on the bulk Lorentz factor, a change in bulk Lorentz factor could result in increased emission at mainly the higher-energy -rays (e.g., Böttcher Collmar 1998).
On top of the already high -ray level, PKS 1622-297 showed a major flare which lasted for a few days. COMPTEL measures enhanced -ray emission during this period. This suggests that the flare is also visible at MeV energies, however with reduced amplitude. An intriguing feature of this flare is the possible time delay of a few days between the -rays above 100 MeV and the 10-30 MeV band, indicating that the opacity of the -ray emitting region might be different for the different energy bands. Such a delay has not yet been observed in another blazar. A measurement of this delay, together with the ratio of the flare amplitudes in the different bands, has the potential to improve our insights on the -ray emitting region.
5 Summary
During a 4-week -ray acitivity period observed at energies above 100 MeV by EGRET, PKS 1622-297 is also significantly detected at lower-energy -rays (10 MeV) by COMPTEL. This detection together with the marginal detection and non-detection at lower COMPTEL energies indicates a ’hard’ ( 2, ) MeV spectrum. The combined COMPTEL-EGRET spectrum requires a spectral break around 20 MeV.
On top of this -ray high state, EGRET observed a major flare which lasted for about 2 days. COMPTEL observes enhanced MeV emission (10 - 30 MeV band) during that time. However, the COMPTEL flux is still high when the EGRET one is already down, indicating a possible time delay of a few days between the two bands.
Acknowledgements
This research was supported by the German government through DLR grant 50 QV 9096 8, by NASA under contract NAS5-26645, and by the Netherlands Organisation for Scientific Research NWO.
References
- de Boer et al. (1992) Bloemen H., Hermsen W., Swanenburg B.N., et al., 1994, ApJS 92, 419
- de Boer et al. (1992) de Boer, H., Bennett K., Bloemen H., et al., 1992, In: Data Analysis in Astronomy IV, eds. V. Di Gesu et al., New York, USA, p. 241
- Böttcher & Collmar (1998) Böttcher M., Collmar W., 1998, A&A 329, 57
- Collmar et al. (1997) Collmar W., Bennett K., Bloemen H., et al., 1997, in Proceedings of the Fourth Compton Symposium, eds. C.D. Dermer, M.S. Strickman, J.D. Kurfess (New York: AIP Conf. Proc. 410), p. 1341
- Collmar et al. (1999) Collmar W., Bennett K., Bloemen H., et al., 1999, Astrophys. Lett. & Communications, Vol. 39, p. 57
- Hartman et al. (1999) Hartman R.C., Bertsch D.L., Bloom S.D., et al., 1999, ApJS 123, 79
- Kurfess et al. (1995) Kurfess J.D., Grove J.E., McNaron-Brown K., et al., 1995, IAU circular 6185
- Mattox et al. (1997) Mattox J.R., Wagner S.J., Malkan M., et al., 1997, ApJ 476, 692
- Schönfelder et al. (1993) Schönfelder V., Aarts H., Bennett K., et al., 1993, ApJS 86, 657
- Zhang et al. (2001) Zhang S., Collmar W., Bennett K., et al., 2001, in prep.