Discovery of an absorbed cluster of galaxies (XMMU J183225.4-103645) close to the Galactic plane with XMM-Newton
During an XMM-Newton observation of the galactic supernova remnant G21.5-09 a bright, previously uncatalogued, source (XMMU J183225.4-103645) was detected 18′ from G21.5-09. The European Photon Imaging Camera data inside 1′ (180 h kpc) radius are consistent with a source at a redshift of with an optically thin thermal spectrum of temperature keV and a metal abundance of solar. This model gives a 2 – 10 keV luminosity of . These characteristics, as well as the source extent of 20 (350 kpc), and the surface brightness profile are consistent with emission from the central region of a moderately rich cluster containing a cooling flow with mass flow rate of yr-1. The absorption is atom cm-2, 5 times that inferred from low-resolution HI data but consistent with higher spatial resolution infrared dust extinction estimates. XMMU J183225.4-103645 is not visible in earlier ROSAT observations due to high amount of absorption. This discovery demonstrates the capability of XMM-Newton to map the cluster distribution close to the Galactic plane, where few such systems are known. The ability of XMM-Newton to determine cluster redshifts to 1% precision at z = 0.1 is especially important in optically crowded and absorbed fields such as close to the Galactic plane, where the optical redshift measurements of galaxies are difficult.
Key Words.:
galaxies: clusters: individual: XMMU J183225.4-10364; galaxies: intergalactic medium; X-rays: galaxies: clusters1 Introduction
Studies of large scale structure in the Universe have been extended with the advent of X-ray surveys. Clusters trace the deepest gravitational potential wells, and their X-ray emission, which traces out the hot phase of inter-galactic gas, is less dependent on foreground contamination effects than optical cluster identification techniques. In addition, optical searches for clusters of galaxies have historically been forced to avoid a wide band of sky centered on the Galactic plane. The obscuration of 25% of the whole sky by the Galactic plane is problematic for the understanding of the dynamics in the local Universe, where the whole-sky map of the large scale structure is essential (Kraan-Korteweg & Lahav 2000). This is particularly unfortunate from the point of view of mapping out structure associated with the Great Attractor region (l , b ) More recently a number of searches employing techniques in different wavebands have attempted solve this problem (see e.g., Schneider et al. 1997).
With X-ray searches, the limiting factor is no longer extinction due to dust and confusion from stellar sources, but the amount of photo-electric absorption, . The and visual extinction rise roughly proportionally towards the Galactic plane, but because XMM-Newton has a lot of effective area above energies 2 keV, where the absorption is negligible, the photon loss is much smaller with XMM-Newton, compared to optical band. Therefore, XMM-Newton survey for clusters should be able to reach closer to the plane than traditional survey techniques. Ebeling et al. (2000) describe such a survey using data from the ROSAT All-Sky Survey (RASS). Initially, they examined sources in the ROSAT Bright Source Catalogue, where targets were selected with fluxes erg cm-2 s-1, , and hard spectral colors. From follow-up studies they obtained 73 spectroscopically confirmed clusters, of which 58 were previously unknown. Nevertheless, the ROSAT pass-band of 0.1–2.5 keV limited the sensitivity to energies where absorption is high, even for modest galactic extinctions . The newly commissioned Chandra and XMM-Newton X-ray observatories have high sensitivities extending to 10 and 12 keV, respectively. Therefore, Chandra and XMM-Newton have additional potential to discover highly-absorbed objects, with equivalent optical extinctions compared to ROSAT. In this work we demonstrate the capability of detecting clusters behind the central regions of the Milky Way.
We use km s-1 Mpc-1, , , and consider uncertainties and significances at 90% level throughout the paper, unless stated otherwise.
2 Observation
The XMM-Newton payload comprises 3 identical X-ray reflecting telescopes, the EPIC (European Photon Imaging Camera) imaging spectrometers, together with two reflection grating spectrometers and a co-aligned optical/UV monitor. The EPIC complement includes 2 conventional MOS CCD detectors (Turner et al. 2001) and a PN CCD instrument (Strüder et al. 2001). The former are placed behind the mirror systems containing grating arrays, the latter in the unobscured telescope. For more details of XMM-Newton see Jansen et al. (2001). In total the 3 EPICs provide 2500 cm2 of collecting area at 1.5 keV. The mirror systems offer an on-axis full-width half maximum (FWHM) angular resolution of 4–5′′ and a field of view (FOV) of 30′ diameter.
The location of the reflection grating array behind two of the mirror systems breaks the rotational symmetry of the collecting area vignetting. To confirm the ground calibration of this effect, observations were made of a number of sources at on- and off-axis positions. The compact galactic supernova remnant G21.5-09 was chosen for these measurements because it is time invariant, has a compact core with a spatial scale not much larger than the XMM-Newton point spread function (PSF), and a simple absorbed power-law spectrum (see Warwick et al. 2001 for the analysis of XMM-Newton observations of G21.5-09). During one of these off-axis observations on 2000 April 11 the source discussed here was discovered serendipitously.
The new source is located on the opposite side of the FOV from G21.5-09 at an off-axis angle of 8′ at RA = 1832m 25.4s, dec. = 36′ 45′′ (corresponding to galactic coordinates l = 21.3∘, b = ) with a 5′′ uncertainty in the absolute coordinates. At this off-axis angle the PSF of the XMM-Newton optics is barely degraded from the on-axis value. The source is designated XMMU J183225.4-10364. Exposures of 29 ks were taken with the 0.2–10 keV EPIC in full frame mode using medium thickness filters. The event lists produced by the XMM-Newton Science Analysis Software (SAS 5.0) tasks emchain and epchain were subsequently filtered using a third SAS task, xmmselect. For the MOS only X-ray events corresponding to patterns 0–12 were selected, while for the PN, only pattern 0 (single pixel) events were selected. Known hot, or flickering, pixels and electronic noise were rejected using the SAS.
We examined the effect of particle flares by extracting a light curve of all the CCDs in the 10 keV band. The light curve shows several short peaks, and a large flare towards the end of the observation. We rejected time bins using several different count rate criteria, ranging from no rejection at all to a very low level (0.4 count s-1 for the PN and 0.2 count s-1 for the MOS), which reduced the exposure time by 50%. Fitting the corresponding PN + MOS spectra revealed, that the fit parameters are virtually independent of the rejection level. However, to be safe, we chose to reject data obtained during the large flare close to the end, which reduced the exposure time to 26 ks.
3 Spatial Analysis
To study the spatial extent of the source, we used the SAS tool eexpmap to create exposure maps in the 1–10 keV energy range for the PN observation, and in 1–8 keV range for MOS1 and MOS2. The exposure maps include effects of the spatial dependence of the quantum efficiency, filter transmission and mirror vignetting. We used the images to derive radial surface brightness profiles for PN, and a combined one for MOS1 + MOS2 (Fig. 1).

For comparison, we used SciSim V2.1 to produce PN and MOS images of a point source at the same location and with a spectrum similar to that of XMMU J183225.4-10364 (i.e. a mekal spectrum with T = 6 keV and absorbed by atom cm-2, see below). The SciSim mirror model contains relevant geometric and metrology data that was verified by the ground calibration, and subsequently by in-flight calibration measurements (Aschenbach et al. 2000). We extracted a radial surface brightness profile of the simulated image and thereby obtained the PSF corresponding to our observation. Comparison of the surface brightness profile data with PSF shows that the source is clearly extended (Fig. 1). With MOS data, we can detect the source out to a 20 radius with confidence. Using the best-fit reshift (see below) this radius corresponds to 350 h kpc. In the following, we use this conversion between angular and physical radii. Beyond a 3′ radius the surface brightness reaches a nearly constant value, indicating that the sky and particle background dominates over the source emission at these radii.
We determined the background level from the data at large radii (beyond 3 ′ ) and fitted the MOS data at radii of 006 – 50 and the PN data at radii 01 – 40 with a model (Cavaliere & Fusco-Femiano 1976) and background, convolved with the PSF. A single model provides a reasonable description of both data sets with and h kpc, except in the central 4′′ bin, where the count rate is significantly (by a factor of 3.0) above the model. The low value of the core radius is more suggestive of values obtained for rich cluster cooling flows than the larger scale ambient cluster emission. We have therefore also fit a two-component model with the second component having fixed values of = 2/3 and = 250 h kpc, representative of other typical clusters. The best fit cooling flow component has values and h kpc, typical of a large sample of clusters (Mohr et al. 1999). We find that of the counts within 1′ can be attributed to a ‘cooling flow’ component with the residual coming from the more extended component.
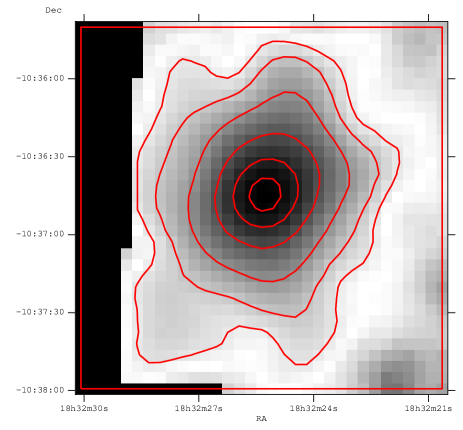
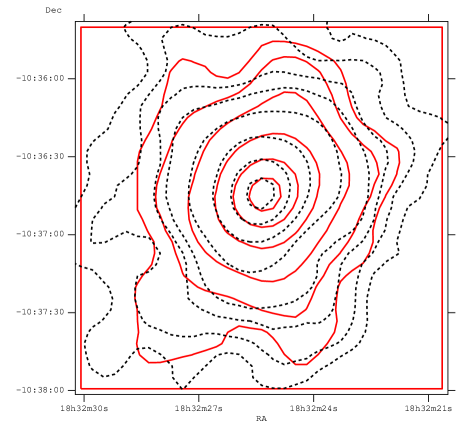
The exposure corrected PN image (Fig. 2) does not exhibit strong distortions from azimuthal symmetry and thus does not suggest a strong ongoing merger in the cluster. However, the data indicates small radial elongation structures between 05 – 1′ and central 05 elongation with an axial ratio of 0.85. The spokes in the mirror produce a 16-fold symmetric pattern in surface brightness at the spatial scales smaller than the pixel size used and thus cannot produce the observed features. Due to the small number of counts in the pixels at 1′ distance from the center, we cannot derive strong conclusions on the spatial structure. However, the MOS2 brightness contours seem to confirm the existence of the deviations from the spherical symmetry, decreasing the probablility of them being noise. In cooling flow scenario, the elongated radial structures could result from enhanged density due to patchy infalling gas. Similar behavior is visible in Chandra data of the core of cooling flow cluster 3C295 (Allen et al. 2001). The central elongation could be due to a recent merger, which is about to disrupt the cooling flow.
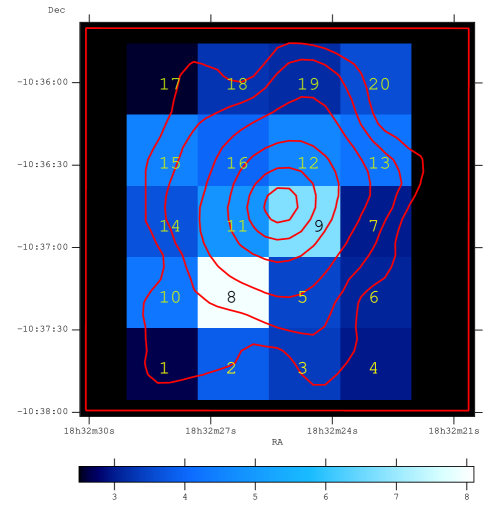
In order to obtain information on the spatial distribution of the spectral properties of the cluster gas, we produced a color map, where color is defined as vignetting corrected PN counts in the 3–10 keV energy range, divided by the counts in the 1–3 keV energy ranges (Fig. 3). The pixel size was chosen to be 26′′ so that each pixel contains at least 20 counts in both bands. The resulting standard Gaussian errors of the color derived from the raw counts are below 1 in most pixels. Within 1′ the color varies significantly, from 3 to 8. The emission in the South-West quadrant is soft (color ), while the North-East quadrant is harder (color –5). Between them, aligned with the elongation axis of the total band brightness the emission is very hard (color –8). If this is due to significant variation in NH, the excess absorption would affect the soft band more and increase the color value. This would lead to an anticorrelation between the soft band counts and the color, but this is excluded by the data. This indicates that the variations are due to temperature variations in the cluster. It is interesting to note that Chandra imaging of a core of cooling flow cluster Perseus (Fabian et al. 2000) shows relatively well defined regions of different temperature gas and strong temperature variations on very small angular scales, qualitatively similar to our findings for XMMU J183225.4-10364. Such a structure may be produced by shock waves resulting from the collision of different infalling gas patches. Alternately, the variations in the color across the elongation axis of the cluster could also suggest a merger along the same axis, so that areas of significant hardening would be due to heating due to ram-pressure.

4 Spectral Analysis
Source counts were extracted from circular regions of 11 and 12 radius centered on XMMU J183225.4-10364 for the PN and MOS-2 instruments. In the MOS-1 instrument the source fell close to the gap between two of the outer CCDs of the detector and thus an extraction radius of 09 was used. The background extraction required extra care, because the particle induced fluorescent excitation of materials in XMM-Newton produces spatially variable K line contamination for the PN, and Al K and Si K line contamination for the MOS. The intensity of these features varies with position within the FOV. To study this, we extracted background spectra from the PN image varying the extraction locations as a function of a distance from the source, up to 10′. We also used locations at different off-axis angles (up to 10′) to see if the radially-changing vignetting function produces a significant effect. We fitted the data using these background spectra, and noticed that even though there were some differences in the PN spectrum at 8 keV (due to the Cu line) and below 2 keV (due to the Al line) these made an insignificant effect to the fit parameters, compared to the statistical uncertainties. Thus, the choise of background extraction region is not critical in our case, but again, to be safe, we chose to use background regions close to the source and at similar off-axis angle in the subsequent analysis.
As suggested by Saxton & Siddiqui (2000), we used the ready-made on-axis energy redistribution matrices epn_fs20_sY9.rmf, M1_all.rmf and M2_all.rmf for the PN, MOS-1 and MOS-2, respectively, assuming that the response function does not vary significantly across the CCDs. We generated the vignetting corrected auxiliary response files with the SAS tool arfgen 1.41.12. In our fit, we excluded the strongly absorbed low energy band (below 1 keV), where most of the signal consists of redistributed photons from higher energies, and used the energy ranges 1–10 keV for the PN and 1–8 keV for the MOS. The net count rates in the above bands are , , and s-1 for the PN, MOS-1 and MOS-2, respectively. We rebinned the data so that each bin included at least 50 counts. The photoelectric absorption cross sections of Morrison & McCammon (m:83 (1983)) and the solar abundances of Anders & Grevesse (a:89 (1989)) were used throughout
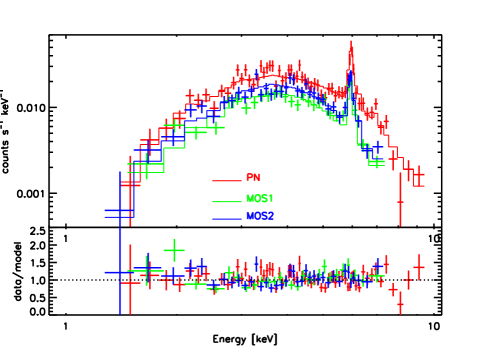
We fitted the spectrum using the absorbed mekal collisionally ionized thermal plasma model in XSPEC v11.0.1. The and the redshift were allowed to vary as well as the relative normalizations between the PN, MOS-1 and MOS-2 instruments. We obtained the best fit with parameters atom cm-2, T = keV, metal abundance of in Solar units and a redshift of (see Fig.4 and Table 1). The fit is formally acceptable at a 90% confidence level with a of 140.1 for 120 degrees of freedom (dof). The residuals show that in PN data at 8 keV the data bins are significantly below the model, indicating the effect of the variable Cu K line.
| PN + MOS1 + MOS2 | |
| T (keV) | |
| Metallicity (solar) | |
| NH) | |
| redshift | |
| /dof | 140.1/120 |
Our redshift measurement depends critically on the centroid energy of the Fe Kα line, and thus on the accuracy of the instrument gain. As shown in Strüder et al. (2001), the long term monitoring of the centroid of the Mn Kα line of the internal PN radioactive spectral calibration source shows that it has been stable to within 5 eV between 2000 January and September. This shows that in the long term the gain is well defined, at least at around 6 keV. However, there have been short term changes in gain due to platform temperature changes which are not yet fully calibrated. These changes have generally been on timescales of days, due to eclipses, or to changes in instrument configuration. Therefore we analyzed near-contemporaneous PN and MOS-1 data of revolution 59, (7 days before the observation of XMMU J183225.4-10364) of the internal in-flight calibration source at the location of the cluster using the same responses as for the source (MOS-2 data was not usable due to high background). We measured the line centroids to be within eV (or %) of the expected values. This implies a systematic component of the redshift determination, negligible compared to the statistical error of the redshift. Therefore our redshift measurement is robust.
5 Discussion
5.1 The nature of XMMU J183225.4-10364
At a redshift of 0.12, the spatial extent of 20 radius (see Sect. 3) corresponds to a physical diameter of 0.7 h Mpc for the source. The only known bound objects on this scale are clusters of galaxies and giant elliptical galaxies. The surface brightness profile of XMMU J183225.4-10364 is reasonably well described with 2 component model, which is succesfully used to fit the ROSAT PSPC data of many cooling flow clusters (Mohr et al. 1999). Our best fit values for the core radius and the slope are typical of the values in the above sample, supporting the cooling flow explanation.
Also, the source has a temperature of 6 keV, typical of rich clusters of galaxies. The iron abundance is somewhat higher than the typical cluster average, but at this redshift the 1′ extraction radius corresponds to 180 h kpc, less than a typical cluster core radius. The recent study of a sample of BeppoSAX clusters (De Grandi & Molendi 2001) shows that in cooling flow clusters the metal abundances increase towards the center, reaching values consistent with ours. The extraction radius of 180 h kpc is consistent with the cooling radius of strong cooling flow clusters (Allen & Fabian 1997). Fitting the spectra of XMMU J183225.4-10364 with an absorbed cooling flow model wabs * mkcflow results in a worse fit than the best-fit reported above, mainly due to systematic residuals below 2.5 keV. This is consistent with the above finding that 30% of the total emission within 1′ comes from the ambient gas. However, it’s spectral signal is too small to be modeled properly. With this scaling, the spectral fit indicates a strong mass flow rate of yr-1, consistent with values found for other clusters (e.g., White et al. 1998).
For flux calculation, we use the average model normalizations of the PN, MOS-1 and MOS-2. For the flux uncertainty estimate we consider the full range covered by the statistical uncertainties of the model normalizations of all instruments. Within a 1′ circle centered at the brightness peak, we measure unabsorbed 2–10 keV fluxes and luminosities of , and and bolometric values of , . Using the best fit 2-component model, only 20% of the total emission of the ambient cluster gas is contained within the central 1′ . For a comparison with LX-T relation determined using ASCA cluster sample (Markevitch 1998) we computed the luminosity in 0.1–2.4 keV range within Mpc using the above model (including the emission from the ambient gas and the cooling flow). We made no estimate for the uncertainty resulting from the extrapolation of the model to larger radius, or from extrapolating the spectral model to the absorbed 1 keV range. Also, our temperature estimate is not directly comparable with the Markevitch (1998) value, because theirs is the emission weighted value of the whole cluster, whereas ours is measured in the cluster center. Therefore the resulting value agrees surprisingly well with the corresponding value derived from the ASCA sample for T = 5.8 keV, with no cooling flow correction for T and LX. This excellent agreement further supports the identification of XMMU J183225.4-10364 with a cluster of galaxies.
The value of NH derived here is 5 times the standard Galactic value of obtained from broad beam Hi observations (Dickey & Lockman 1990). Fixing NH to the above value gives a totally unacceptable fit to the XMM-Newton spectra. The huge excess obtained in our spectral fit, NH, is an order of magnitude larger than the typical values in cooling flow clusters (e.g., Allen & Fabian 1997; White et al. 1991). This suggests that the excess absorption is due to material in Galaxy, rather than in the cluster. The excess could be due to small angular scale (′) variations of NH in the Galactic plane which would be averaged out in the 1∘ resolution maps of Dickey & Lockman (1990). To study this, we used the dust infrared emission results on a better angular scale (6 ′) (Schlegel et al. 1998), based on COBE and IRAS all sky maps. This data, as computed with Nasa Extragalactic Database extinction calculator, gives visual extinction A mag in the direction of XMMU J183225.4-10364. In a study of ROSAT X-ray halos a correlation between Av and NH was found (Predehl et al. 1995), which yields NH for the above amount of extinction. However, there are several uncertainties involved here. For example, the measurement of Av is not very reliable at low galactic latitudes, and the Av – NH correlation is measured only in the range Av = 0 – 20 mag. On the other hand a high value of AV is supported by the lack of any obvious cluster glaxy measurements on survey Schmidt plates of the region. We thus conclude that the NH obtained in this work is consistent with the amount of visual extinction, and thus with the actual Galactic NH.
5.2 Implications for Galactic plane Surveys
The ROSAT Position Sensitive Proportional Counter (PSPC) 8 ks observation of the G21.5-09 field (rp500126n00) shows no evidence for the presence of XMMU J183225.4-10364. This is consistent with the high absorption which strongly reduces the flux in the PSPC energy band. Consistent with this, a PN image accumulated of the cluster selecting only photons below 2 keV shows no trace of the cluster. The 87 ks ASCA observation 50036000 of the G21.5-09 field reveals a weak source whose centroid is 3′ away from the cluster centroid determined from the PN image, probably consistent within the uncertainty envelopes. However, the source is too faint for any meaningful analysis. These facts indicate the power of XMM-Newton to enlarge our knowledge on the galaxy cluster distribution close to the Galactic plane.
De Grandi et al. (1999) based on Rosat All Sky Survey data from the southern hemisphere provides an estimate of the density of clusters as a function of the ROSAT band flux. In this paper we have clearly demosnstrated that at a 0.5–2.0 keV flux level of XMMU J183225.4-10364 within 1′ , erg cm-2 s-1, is easily sufficient to measure redshifts accurately with XMM-Newton (for reasonable 10–30 ks exposures). De Grandi et al. (1999) then predict 60 such clusters per steradian. In XMM-Newton A0-1 there are about 10 square degrees of Galactic plane being covered in systematic surveys, which implies 20% probablility of a detection. The above flux is similar to the limit in ROSAT Galactic plane cluster survey (Ebeling et al. 2000). Considering that the effective area of XMM-Newton exceeds that of ROSAT by a factor of 10, and that the exposure times in the XMM-Newton surveys exceed those of RASS by a factor of 10, the actual minimum flux needed for XMM-Newton cluster detection, with reasonably accurate redshift measurement, will be 1-2 orders of magnitude lower than that of XMMU J183225.4-10364. This would increase the number of clusters detectable with XMM-Newton on the Galactic plane to between a few to tens per year assuming a similar sky coverage pattern to the currently scheduled observations.
In the Galactic plane galaxy redshifts are very difficult to measure using optical techniques due to the large amount of visual extinction and because of crowding. We have demonstrated here that XMM-Newton has the capability of measuring such redshifts, using the X-ray Fe Kα line. The systematic uncertainties induce 10 eV uncertainty in the line centroid measurement which has a negligible effect compared to the statistical uncertainties in redshift measurements ( 1%) for clusters with data of similar quality and with similar redshifts to XMMU J183225.4-10364. XMM-Newton data, over its projected 10 year lifetime will thus prove invaluable, in completing our picture of large scale structure in the local Universe and reducing the need for interpolation over a significan fraction of the sky.
References
- (1) Allen, S., & Fabian, C., 1997, MNRAS 286. 583
- (2) Allen, S. W., Taylor, G. B., Nulsen, P. E. J., et al., 2001, MNRAS in press, astro-ph/0101162
- (3) Anders, E., & Grevesse, N. 1989, Geochimica et Cosmochimica Acta, 53, 197
- (4) Aschenbach, B., Briel, U., Haberl, F., et al. 2000, astro-ph/0007256
- (5) Boller, Th., Glozzi, M., Griffiths, M., et al. A&A, 365. L158
- (6) Cavaliere, A., & Fusco-Femiano, R., 1976, A&A, 49, 137
- (7) De Grandi, S., Böhringer, H., Guzzo, L., et al. 1999, ApJ, 514. 148
- (8) De Grandi, S., & Molendi, S., 2001, ApJ, in press, astro-ph/0012232
- (9) Dickey, J., & Lockman, L. F., 1990, Ann. Rev. Ast. Astr. 28, 215.
- (10) Ebeling, H., Mullis, C., & Tully, B., 2000, astro-ph/0001319
- (11) Fabian, A. C., Sanders, J. S., Ettoriu, G. B., et al. 2000, MNRAS, 318, L65
- (12) Jansen, F., Lumb, D., Altieri, B., et al. 2001, A&A, 365, L1
- (13) Kraan-Korteweg, R. C., & Lahav, O., 2000, A&AAR, 10, 3, 211
- (14) Markevitch, M. 1998, ApJ, 504, 27
- (15) Morrison, D., & McCammon, D. 1983, ApJ, 270, 119
- (16) Predehl, P., & Schmitt, J. H. M. M., 1995, A&A, 293, 889
- (17) Saxton, R. D., & Siddiqui, H. 2000, XMM-Newton technical note. XMM-PS-TN-43
- (18) Schneider, S. E., Skrutskie, M. F., Chester, T. J., et al. 1997, “Extragalactic Astronomy with 2MASS”, in Extragalactic Astronomy in the Infrared. ed. G. A. Mamon, T. X. Thuan, & J. T. Thanh Van (Paris: Editions Frontieres), 39
- (19) Schlegel, D. J., Finkbeiner, D. P., & Davis, M., 1998, ApJ, 500, 525
- (20) Strüder, L. Briel, U., Dennerl, K., et al. 2001, A&A, 365, L18
- (21) Turner, M. J. L., Abbey, A., Arnaud, M., et al., 2001, A&A, 365, L27.
- (22) Warwick, R. S., Bernard, J.-P., Bocchino, F., et al. 2001, A&A, 365, L248
- (23) White, D. A., Fabian, A., C., Johnstone, R. M., et al. 1991, MNRAS, 252, 72