Unité associée au CNRS, UMR 5572 (http://webast.obs-mip.fr)
2 Astrophysics, Nuclear and Astrophysics Laboratory, Keble Road, Oxford, OX1 3RH, UNITED KINGDOM
Cosmology from Cosmic Microwave Background and Galaxy Clusters
We present the results of analysis of constraints on cosmological parameters from cosmic microwave background (CMB) alone and in combination with galaxy cluster baryon fraction assuming inflation–generated adiabatic scalar fluctuations. The CMB constraints are obtained using our likelihood approximation method (Bartlett et al., 2000, Douspis et al., 2001). In the present analysis we use the new data coming from MAXIMA and BOOMERanG balloon borne experiments, the first results of the DASI interferometer together with the COBE/DMR data. The quality of these independent data sets implies that the are rather well known, and allow reliable constraints. We found that the constraints in the plane are very tightened, favouring a flat Universe, that the index of the primordial fluctuations is very close to one, that the primordial baryon density is now in good agreement with primordial nucleosynthesis. Nevertheless degeneracies between several parameters still exist, and for instance the constraint on the cosmological constant or the Hubble constant are very weak, preferred values being low. A way to break these degeneracies is to “cross-constrain” the parameters by combining with constraints from other independent data. We use the baryon fraction determination from X–ray clusters of galaxies as an additional constraint and show that the combined analysis leads to strong constraints on all cosmological parameters. Using a high baryon fraction ( for ) we found a rather low Hubble constant, values around km/s/Mpc being ruled out. Using a recent and low baryon fraction estimation ( for ) we found a preferred model with a low Hubble constant and a high density content (), an Einstein–de Sitter model being only weakly ruled out.
Key Words.:
cosmic microwave background – galaxy clusters – Cosmology: observations – Cosmology: theory1 Introduction
The determination of cosmological parameters is a central goal of modern cosmology. The measurements of the angular spectrum of the fluctuations in the CMB is one of the most promising techniques. Indeed the first measurements of fluctuations at the degree scales (Saskatoon, Netterfield et al., 1997) has allowed to put the first constraints on cosmological parameters (Lineweaver et al. 1997; Hancock et al 1997). Probably the most spectacular result was that the open models could be reasonably excluded, while flat models were favoured (Lineweaver & Barbosa; 1998b), essentially because of the location of the first peak. This result has been brilliantly confirmed by the first BOOMERanG and MAXIMA measurements (Hanany et al., 2000, de Bernardis et al., 2000). The data are now becoming of high quality and the detailed features expected in so-called inflationary models are now becoming apparent (the famous peaks) from independent measurements (BOOMERanG, MAXIMA, DASI). Alternative scenarios like topological defects models are almost entirely ruled out. The possibility of a partial contribution remains open (Bouchet et al., 2000) and will be difficult to entirely rule out, although inflationary models are clearly preferred. In this paper we analyse the constraints that can be set from the recent measurements obtained by BOOMERanG, MAXIMA, DASI combined with the COBE/DMR results.
However, it has been realised that combination of different methods to constraint cosmological parameters was very welcome, not only because of the gain in precision, but mainly because most of cosmological tests present degeneracies and may constraint rather well only specific combinations of cosmological parameters but not each parameter individually. Combinations of constraints or measurements, often implemented as prior on some parameters in likelihood analysis, are currently used to obtain accurate values for the cosmological parameters. In this paper, we use as a first additional constraint the observed baryon fraction in clusters. This quantity has the advantage of not specifying one fundamental cosmological parameter in a direct way. Nevertheless, we obtained contours which are significantly tightened for all the parameters, breaking all the degeneracies. This allows us to investigate constraints on cosmological parameters without introducing any prior from measurements based on standard candles hypothesis. In this paper we use km/s/Mpc.
2 Constraints from CMB alone
2.1 CMB analysis
During the last decade (since the COBE/DMR results) different measurements of CMB anisotropies at different scales have been used to constrain the cosmology of our Universe (Hancock et al., 1997 , Lineweaver et al., 1997, Dodelson and Knox, 2000, Tegmark and Zaldarriaga 2000ab, Ledour et al., 2000, Jaffe et al., 2001 and others). The last experiments (second generation) are sensitive to different scales. This gives homogeneous sets of data from a few degrees to a few arcmins, which cover two or three peaks in the power spectrum with good accuracy. We then expect the constraints to be stronger, especially if several experiments are consistent.
Our method to derive parameters from CMB data has been presented in Bartlett et al., 2000 (BDBL), Douspis et al., 2001 (DBBL) and used in Le Dour et al., 2000 (LDBB)111see http://webast.ast.obs-mip.fr/cosmo/CMB for complementary informations. We use the maximisation technique rather than the marginalisation obtained by integrating over some parameters. Both techniques are equivalent when the probabilities are Gaussian and the model is linear in the parameters. This is far from being the case however when dealing with likelihood on the . The degeneracies imply that likelihood surfaces are sheets in a multidimensional space. In the presence of such a complex structure in the likelihood space, the marginalisation has the inconvenient that the model corresponding to the preferred parameters may actually lie outside of the actual allowed region! We present our results by means of contours in two dimensional parameter space. This allows us to some extent to identify complex structure in the multidimensional parameter space, that might be hidden in the likelihood on one parameter. Goodness of fit has to be evaluated before addressing parameter estimation. The technique to derive the goodness of fit in our method is detailed in Douspis et al. 2001 (DBB). The basics are to use flat–band estimates as published (see table 2 of LDBB) and apply our likelihood approximation instead of a non appropriate minimisation. Our method remains as simple as a fit but is less biased as shown in DBBL. In this paper, we use the most recent results of MAXIMA (Lee et al., 2001), BOOMERanG (Netterfield et al., 2001) and DASI (Halverson et al., 2001). We also use the COBE/DMR data (Tegmark and Hamilton, 1997) and refer to the data set as CBDM. We also upgraded our grid of models, allowing closed models and refining the step and range of the baryon content (), the total density () and the spectral index (). The parameter space explored is given in table 1.
| km/s/Mpc | K | |||||
|---|---|---|---|---|---|---|
| Min. | 20 | 0.7 | 0.0 | 2.78 | 0.70 | 10.0 |
| Max. | 100 | 2.0 | 1.0 | 11.94 | 1.30 | 30.0 |
| step | 10 | 0.1 | 0.1 | 0.83 | 0.03 | 1.0 |
, where is the curvature parameter
(baryon number density)/(photon number density)
(Note: )
primeval spectral index
We do not consider reionisation or gravitational waves nor neutrino contributions to the matter density . Previous analyses showed that these parameters do not play an important role. The present analysis has been done with all the information available in the literature. Unfortunately, some information is still missing (like the window functions); some effects have thus not been taken into account but our previous investigation of these questions indicates that this lack of information is not critical.
The likelihood of each model is calculated as described in LDBB, and the best model is found by maximising the likelihood function over the explored space. The contours are defined in the full six–dimensional space with values of (dashed, in red), corresponding to the 1, 2 and 3 contours for Gaussian distributions when projected onto one of the axes. Identically the 1, 2 and 3 contours in the two parameters space are defined by (filled, in blue), for Gaussian distribution. Since the likelihood is not actually Gaussian, the confidence percentages associated with our contours are actually not known; the technique is however standard practice.
We also would like to emphasise the effect of priors in the analysis. As it has been noticed in the recent literature (Jaffe et al., 2001, Balbi et al., 2000, Lange et al., 2000), the final results on the preferred parameters are very sensitive to priors. Most of the recent work set as a “ghost” parameter, using physical densities () and deriving by:
Then the analysis proceed by putting a prior on like . The representation in one-dimensional plots does not allow to know exactly what is the effect of such technique. We will show in section 2.2 that such a prior puts more severe constraints on as it is expected.
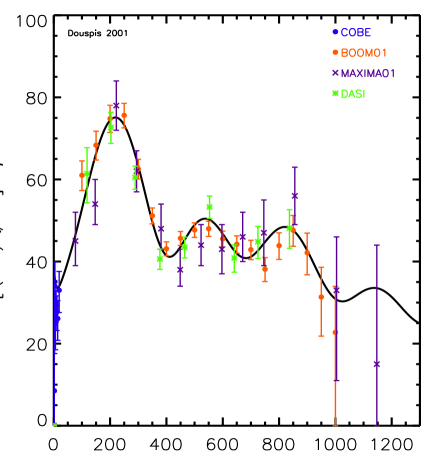
The study of the goodness of fit of “best” models is detailed in DBB. We apply the same technique on the new data and the best model plotted in figure 1. The goodness of fit expressed in terms of generalised is where is the number of degrees of freedom corresponding to the number of experimental points minus the number of investigated parameters. This good value of the goodness of fit allows us to consider confidence intervals on cosmological parameters.
2.2 Constraining the cosmological parameters
The first Doppler peak is one of the main feature of the CMB angular power spectrum. It is clear now that different experiments indicate both a rise in the power at intermediate scale and a fall–off at smaller scales (higher ). The position of the first acoustic peak is strongly related to the curvature of the Universe. A statistical analysis of the CMB data should then give some strong constraint on the total density (or curvature) of the Universe. The confidence intervals on the parameter in different combinations () are shown as 2-D contour plots in figure 2. The plane reveals the stronger constraint that CMB fluctuations lead to: the contours are almost reduced to a line in this plane. The main implication is the exclusion of almost all open cosmologies at high confidence level. Preferred models are closed () and relative maxima are present at lower value (). The models corresponding to the latter are in good agreement with a flat Universe and the inflationary scenario prediction. Within the 95% Gaussian confidence level (95% GCL hereafter), and allowing to be in then range [20,100] we find: . Given our 2-D representation, it is easy to see that the closest models have the lowest value of (cf. figure 2). This is a supplementary information that the 1-D reduction is unable to show.
The fourth plot of figures 2 presents the results in the plane. The constraints on are becoming tight with the present day data set compared to analysis of first generation experiments (LDBB). They point toward a medium value of the baryon content which is well in agreement with the BBN and light elements determination of , contrarily to analysis based on first BOOMERanG and MAXIMA results (Tegmark & Zaldarriaga, 2000, Douspis, 2000, Jaffe et al., 2001). The change in the preferred value of is due to the improved measurements of the second and third peaks. In spring 2000, BOOMERanG and MAXIMA experiments measured the power at scales corresponding to the second acoustic peak. The latter appears to be lower (relative to the first one) than expected in a model with a baryon content compatible with BBN predictions (, Burles et al 2001). The relative heigh between the two peaks favours high values of corresponding to . In spring 2001, BOOMERanG, DASI and MAXIMA teams are publishing new analysis showing the possible existence of a third acoustic peak with the same height as the second. This disfavours high baryon models which predict a higher third peak (see figure 1 of LDBB). The actual value in accordance with our analysis is at 95% GCL and almost independently of the value of .
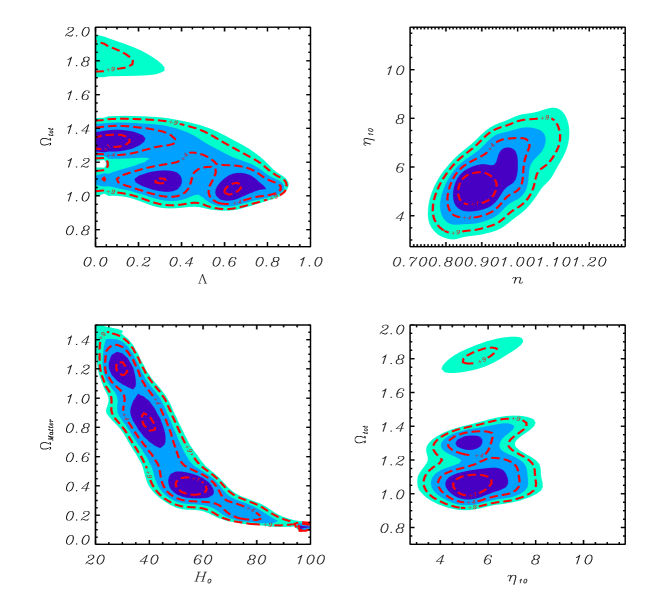
The spectral index of primordial fluctuations, is also a well constrained parameter. We found at 95% GCL. This is in agreement with the inflationary predictions.
The remaining parameters are almost not constrained. We can see in figure 2 the different degeneracies between parameters. There is no constraint on from the CMB. And we can also see that can take almost any value: at 95% GCL. Another contour plot of figure 2 shows a tight degeneracy between and . There again, it is obvious that the lower , the higher . Imposing 45 km/s/Mpc results in a tight constraint on : (99% GCL). Finally, the second plot of figure 2 points out the anticorrelation of the pair (). Increasing (lowering ) will increase the height of the second peak relative to the first. At the opposite, increasing will decrease the second peak.
It is clear that the CMB alone does not directly constrain very tightly without further restriction (or prior) on . Nevertheless it is important to keep in mind that the CMB impose a very narrow region in the plane. Other parameters are not so well constrained. However, the baryon content is now becoming rather well constrained, in agreement with nucleosynthesis and light elements abundances and the primordial index is slightly below 1, close to the value predicted by inflation. It is therefore a fundamental success of Cosmology that the CMB alone does allow such tight constraints. However, it is not possible yet to infer robust constraint on other fundamental parameters like , or . It is therefore vital to have other means to measure these fundamental parameters.
3 Combined analysis
Given the fact that CMB implies degeneracies between the fundamental cosmological parameters , and , it is interesting to look for combination with constraint that do not measure directly any of these parameters. Primordial nucleosynthesis is one of this possibility; we have checked that this does not change much the constraints established in the above section. An other possibility that we investigate below is to use the baryon fraction inferred from cluster observations.
3.1 Baryon fraction in clusters
Clusters provide fundamental observations for cosmology. Historically, they provided the first evidence for the existence of dark matter. Furthermore they now provide us with the best evidence that this dark matter is non baryonic. Indeed, clusters are the only structure for which the total mass, baryon mass and stellar mass can be evaluated simultaneously in a reliable way. Cosmological applications of clusters have been revived with new fundamental tests which provide global constraint on the cosmological parameters: the baryon fraction in clusters trace reliably the ratio between baryons and the total mass in the Universe:
where has been estimated from numerical simulations and is close to in the outer part of clusters (Frenk et al., 1999). Provided that can be estimated from primordial nucleosynthesis and the observed abundance of light elements, this argument can be used to estimate a robust upper limit on (White et al., 1993). In this paper we combine CMB and the sole baryon fraction constraints. This is interesting because the baryon fraction does not constrain by itself any of the cosmological parameters, so that in principle it could leave unchanged the conclusions obtained from the CMB alone.
3.2 Combining constraints
There are some dispersions among values published for the gas fraction in clusters, which mainly reflect the difference in the mass estimator used. Using mass estimators based on numerical simulations a median baryon fraction of was recently found by Roussel et al., 2000, consistently with previous investigations (Arnaud & Evrard, 1999). More recently the standard value has been revisited by Sadat and Blanchard, 2001, showing that the actual baryon fraction could actually be lower. They concluded that a baryon fraction as low as is still consistent with the X–ray data on clusters.
3.2.1 The high baryon fraction case
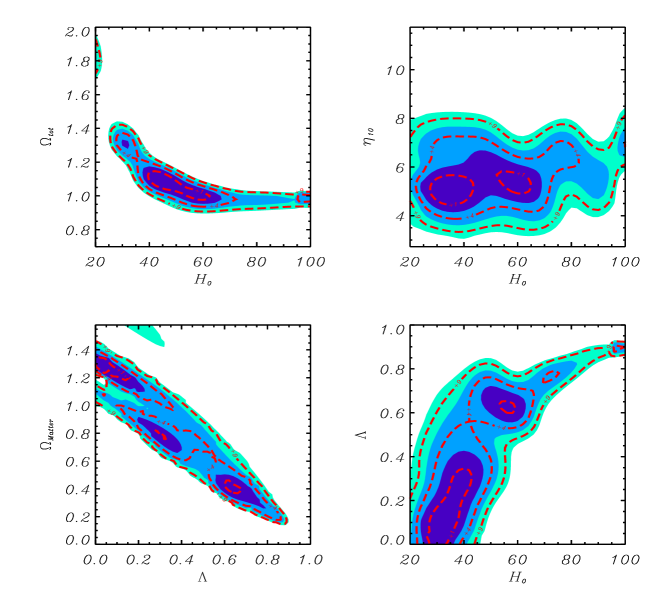
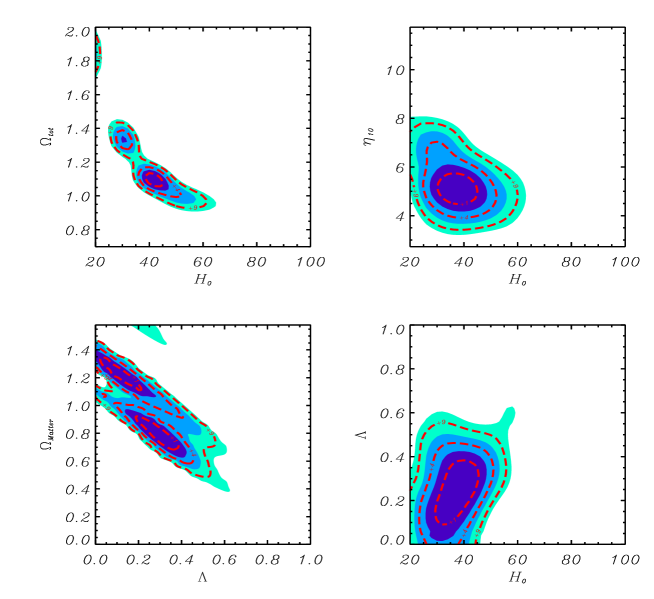
As we have mentioned previously, we have chosen to investigate the combination of the baryon fraction with the CMB data. The baryon fraction is an interesting case because its value can be measured in a rather direct way through observations of X-ray clusters provided the assumption that all the baryons are actually seen (assuming no large quantity of dark baryons). It is worth noticing that without an additional constraint on , there is no trivial reason why the additional information on should further constrain the various cosmological parameters. However, it happens that the additional constraint from the baryon fraction restricts significantly the various contours (see figure 3). This is very clear from the plane: the area of the contours is much reduced, leading to a preferred model which is around km/s/Mpc and . The other two-dimensional plots also reveal that all the contours are significantly reduced: actually most of the one sigma contours are of the order of the grid size so that best model and one sigma ranges should be used with caution. It is highly interesting that the cosmological model is now very well constrained: , (implying , km/s/Mpc, , ). As we mentioned the allowed range have to be interpreted with caution, but we notice that the preferred value of the Hubble constant is rather low and that higher values like 80 km/s/Mpc lie uncomfortably outside of the preferred region.
3.2.2 The low baryon fraction case
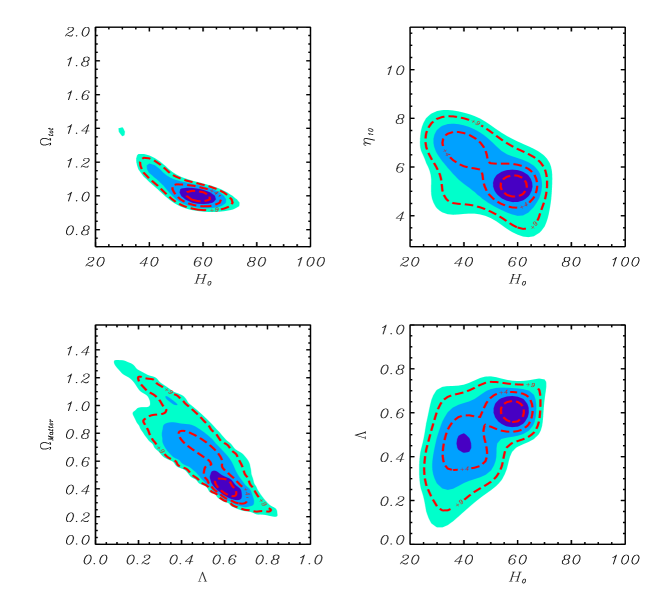
As mentioned above, a baryon fraction significantly lower than current estimates is still consistent with, and actually preferred by existing data on X-ray clusters. Using this low value for the baryon fraction leads similarly to much restricted contours. However the latter differ from the previous ones (see figure 4): the preferred value for is again close to 5., the preferred value of the Hubble constant is now very low ( km/s/Mpc). Although such low values have been argued from time to time (Bartlett et al., 1995), it is worth noticing that values as km/s/Mpc are still at the edge of the 3 sigma contour and for this reason cannot be entirely ruled out. The preferred model is , (implying and , km/s/Mpc, , ).
Finally, we also investigated the additional constraint that can be inferred from the evolution of the abundance of X-ray clusters: the evolution of the abundance of X-ray clusters is known to be a powerful constraint on the matter density of the universe (Oukbir and Blanchard, 1992). The measurement of the temperature of a flux-limited sample of X-ray clusters has allowed the determination of the abundance of clusters at (Henry, 1997; Henry, 2000). Using the updated estimates of local abundance of X–ray clusters a significant level of evolution is found, indicating a high density Universe (Blanchard et al., 2000).
The constraint provided by the addition of the evolution of cluster abundance is essentially a constraint on . Therefore it is rather natural that this additional constraint by itself will not change much the previous contours as the value found by Blanchard et al., 2000, , is almost identical to what is provided by the previous analysis. We can anticipate that using analysis leading to lower with the higher baryon fraction will not change much the contours presented in the previous section.
4 Conclusions
The new CMB data provide impressive evidence in favour of the standard inflationary picture for structure formation with non baryonic dark matter. They also brilliantly confirm previous evidence for a nearly flat Universe. In this paper, we have actually shown that the data provide a very narrow allowed region in the plane. However, it is somewhat frustrating that despite the high quality of the data, degeneracies among the fundamental cosmological parameters ( and ) cannot be broken and that constraints on other parameters are relatively weak. It should also be realised that given the dependency on the power spectrum shape and the possible contribution at some level from topological defects, it will be extremely difficult to obtain entirely reliable constraints on these parameters from CMB alone. Actually, even with the precision anticipated for the Planck mission, the degeneracy problem may not be solved. It is therefore vital to develop new tests that provide additional constraints. Supernova Hubble diagram provide such a test which has be widely advertised. However, the previous use of the Hubble diagram has always been polluted by systematic effects, and therefore we believe that a coherent picture will be firmly established only from further evidence. Clusters offer such additional possibility. We have therefore investigated the complementary information which come from clusters. The most interesting constraint has been found, rather surprisingly, to be the baryon fraction. Indeed with this single additional constraint we found that nearly all the cosmological parameters are well specified. Using a classical value for the baryon fraction of for we obtain as the best model: , , km/s/Mpc, , . Using a more recent result from Sadat and Blanchard, 2001, who infer a lower baryon fraction when several systematics are corrected for, we found that the best model is , , km/s/Mpc, , implying a high density parameter consistent with the determination from cluster abundance evolution by Blanchard et al., 2000. Although the Einstein–de Sitter model is at the edge of the 3 sigma contour, it is probably premature to rule it out on this basis. It is remarkable that in both analyses we found that the preferred primordial baryon content is narrowly constrained and consistent with primordial nucleosynthesis. Identically the primordial index is found to be of the order of in both cases.
References
- Arnaud et al. (1999) Arnaud, M. & Evrard, A.E. 1999, MNRAS 305, 631
- Bartlett, Blanchard, Silk, & Turner (1995) Bartlett, J. G., Blanchard, A., Silk, J., & Turner, M. S. 1995, Science, 267, 980
- (3) Bartlett J.G., Douspis M., Blanchard A. & Le Dour M. 2000, Astronomy and Astrophysics Supplement, v.146, p.507-517, 2000 (BDBL)
- (4) Blanchard A., Sadat R., Bartlett J., Le Dour M. 2000, astro-ph/9908037, A&A 362, 809.
- (5) Bouchet F. R., Peter P., Riazuelo A., Sakellariadou M., astro–ph/0005022
- Burles, Nollett, & Turner (2001) Burles, S., Nollett, K. M., & Turner, M. S. 2001, ApJ Letters, 552, L1
- de Bernardis et al. (2000) de Bernardis, P. et al. 2000, Nature, 404, 955
- (8) Dodelson S. & Knox L. 2000, Phys.Rev.Lett. 84 (2000) 3523
- (9) Douspis M., PhD thesis, 2000
- (10) Douspis M., Bartlett J.G. & Blanchard A. 2001, submitted to A&A, (DBB)
- (11) Douspis M., Bartlett, J.G., Blanchard A. & Le Dour M., Astronomy and Astrophysics, v.368, p.1-14 (2001) (DBBL)
- Frenk et al. (1999) Frenk, C.S, White, S.D.M et al. 1999, ApJ 525, 554
- (13) Halverson et al., astro–ph/0104489
- Hanany et al. (2000) Hanany, S. et al. 2000, ApJ Letters, 545, L5
- Hancock et al. (1997) Hancock, S., Gutierrez, C. M., Davies, R. D., Lasenby, A. N., Rocha, G., Rebolo, R., Watson, R. A., & Tegmark, M. 1997, MNRAS, 289, 505
- Henry (1997) Henry, J.P. 1997, ApJ 489, L1
- Henry (2000) Henry, J. P. 2000, ApJ, 534, 565
- (18) Jaffe et al. 2001, Phys. Rev. Lett., 86, 3475-3479
- (19) Lange A. E., 2000, astro–ph/0005004
- (20) Lee et al., astro–ph/0104459
- Le Dour, Douspis, Bartlett, & Blanchard (2000) Le Dour, M., Douspis, M., Bartlett, J. G., & Blanchard, A. 2000, Astronomy and Astrophysics, 364, 369 (LDBB)
- (22) Lineweaver C., Barbosa D., Blanchard A. & Bartlett J.G. 1997, A&A 322, 365
- (23) Lineweaver C.H. & Barbosa D. 1998b, ApJ 496, 624
- Netterfield et al. (1997) Netterfield, C. B., Devlin, M. J., Jarolik, N., Page, L., & Wollack, E. J. 1997, ApJ, 474, 47
- (25) Netterfield et al., astro–ph/0104460
- Oukbir (1992) Oukbir, J. & Blanchard, A. 1992, A&A 262, L21
- (27) Roussel, H., Blanchard, A., Sadat, R. 2000, A&A 361, 429.
- (28) Sadat, R. & Blanchard, A., A&A in press, astro-ph/0102010
- (29) Tegmark M. & Hamilton A. 1997, astro–ph/9702019
- Tegmark & Zaldarriaga (2000) Tegmark, M. & Zaldarriaga, M. 2000a, ApJ, 544, 30
- (31) Tegmark M. & Zaldarriaga M. 2000b, astro–ph/0004393, Phys. Rev. Lett., 85, 2240
- White et al (1993) White, S.D.M., Navarro, J.F., Evrard, A.E. & Frenk, C. 1993, Nature 366, 429