THE LARGE BRIGHT QUASAR SURVEY. VII. THE LBQS AND FIRST SURVEYS11affiliation: Observations reported here were obtained in part at the MMT Observatory, a joint facility of the Smithsonian Institution and the University of Arizona 22affiliation: Some of the data presented herein were obtained at the W.M. Keck Observatory, which is operated as a scientific partnership among the California Institute of Technology, the University of California and the National Aeronautics and Space Administration. The Observatory was made possible by the generous financial support of the W.M. Keck Foundation
Abstract
The source catalogue for the Large Bright Quasar Survey (LBQS) and the FIRST Survey are compared in their regions of overlap to assess the efficiency of the LBQS selection algorithms. In the 270 deg2 common to both surveys the LBQS contains stellar and non–stellar objects, while the FIRST catalogue contains sources. Cross-correlation of these lists yields 67 positional coincidences between known LBQS quasars and FIRST sources and an additional 19 stellar and 149 non-stellar positional coincidences with the radio catalogue. Spectroscopy of all the stellar matches and two–thirds of the non–stellar matches using the Keck I telescope and the 6.5–m MMT produces eight new quasars. One BL Lac object, previously misclassified during the LBQS survey is also identified. The straightforward fractional incompleteness of the LBQS determined from this sample is , in good agreement with the published estimate of . Furthermore, four of the nine new objects have redshifts in the range , a redshift region where the LBQS selection is known to have decreased efficiency. The distributions of the ratio of radio–to–optical power, apparent magnitude and spectroscopic properties for the new objects are consistent with those of the 67 LBQS–FIRST objects previously known. The consistency of the optical and radio properties of the new objects with those of the known quasars thus supports the conclusion that no new population of objects, constituting more than of quasars detected by FIRST, has eluded the LBQS optical selection techniques. The percentage of radio–detected quasars in the LBQS catalogue is found to be , considerably smaller than the value of advocated by White et al. (2000) based on the First Bright Quasar Survey (FBQS). Apparent differences in the form of the number–redshift relation for the LBQS and FBQS samples are shown to arise in large part from the very different optical passbands used in the compilation of the surveys.
1 INTRODUCTION
The last decade has seen dramatic advances in our ability to compile large samples of quasars according to well–defined quantitative criteria (e.g. Stocke et al. 1991, Schneider, Schmidt and Gunn 1994, Hewett, Foltz and Chaffee 1995). However, progress in addressing a number of longstanding questions concerning the statistical properties of the quasar population continues to be limited by the possibility that unquantified selection effects bias the intrinsic distribution of properties inferred from the observations.
A particularly important recent advance for studies of the quasar population has come about through the availability of the FIRST radio survey (Becker, White & Helfand 1995). The combination of the faint limiting flux density, mJy, at MHz, high–precision astrometry and extensive sky coverage has enabled a well–defined sample of optically bright quasars detected at radio wavelengths to be compiled for the first time (White et al. 2000). Initial investigations have revealed the presence of some Broad Absorption Line (BAL) quasars in the FIRST sample (Becker et al. 2000), apparently contradicting one of the few established differences between the properties of quasars detected at radio wavelengths and those of the quasar population as a whole (Stocke et al. 1992). Quantitative comparison of the spectral energy distributions and the evolutionary behaviour of the FIRST–quasars to results derived from optically–selected samples of bright quasars, such as the Large Bright Quasar Survey (LBQS), offer the prospect of better understanding issues such as the nature of BALs and the physical origin of the very broad spread of radio to optical luminosity exhibited within the quasar population. However, concern still exists that the presence of unrecognised selection effects in optical samples (e.g. White et al. 2000; §5.3) will preclude a rigorous intercomparison.
The recent extension of the FIRST radio survey to areas of sky on the celestial equator provides an overlap with approximately half the area covered by the LBQS, the largest published survey of apparently bright optically–selected quasars. It is possible therefore to perform a direct empirical comparison of the two. In this paper we present a spectroscopic investigation of the optical sources that both fall within the LBQS flux–limits and coincide with radio sources in the FIRST catalogue over an area of deg2.
Section 2 contains a brief overview of the main properties of the LBQS and the FIRST surveys together with the results of the cross–correlation of the FIRST source catalogue with the flux–limited optical catalogue that forms the basis for the LBQS quasar search. Section 3 presents the results of spectroscopic follow–up of those FIRST sources that pair to optical sources and which had not previously been investigated as part of the LBQS. The census of new objects identified during the spectroscopic program that satisfy the LBQS redshift and flux limits is presented in §4. The properties of the new quasars and an assessment of the effectiveness of the LBQS are discussed in §5. A discussion of the implications of the results of the LBQS–FIRST comparison for understanding the apparent differences in the statistical properties of the LBQS and the First Bright Quasar Survey (FBQS) (White et al. 2000) is presented in §6, prior to a summary of the main conclusions of the investigation given in §7.
2 THE CATALOGUE CROSS–CORRELATION
2.1 The Large Bright Quasar Survey
The LBQS is the largest published survey of optically selected quasars at bright, , apparent magnitudes. A full description of the survey is given in Hewett, Foltz and Chaffee (1995; Paper VI) along with positions, magnitudes and redshifts for 1055 quasars in an effective area of deg2 over a total area of deg2 of sky. The source material for the survey consisted of Automated Plate Measuring (APM) machine scans of United Kingdom Schmidt Telescope (UKST) direct and objective–prism plates. The application of a number of search algorithms to the low–resolution, objective–prism spectra of objects in the flux–limited catalogue resulted in the detection of quasars over an extended redshift range, , that possess a broad range of spectral energy distributions. Aspects of the effectiveness of the LBQS are discussed in §5.4 of Paper VI, where it is concluded that, for objects satisfying the broad–band flux limits for inclusion in the survey, no known class of quasar spectral energy distribution would escape detection. However, a significant number of candidate objects remain unobserved, and it is estimated that the survey contains of the total number of quasars satisfying the broad–band flux limits. Attention is also drawn to the likely systematic incompleteness in the survey for quasars with redshifts , where the form of the typical quasar spectral energy distribution results in a relatively red objective–prism spectrum lacking particularly strong emission lines or continuum breaks.
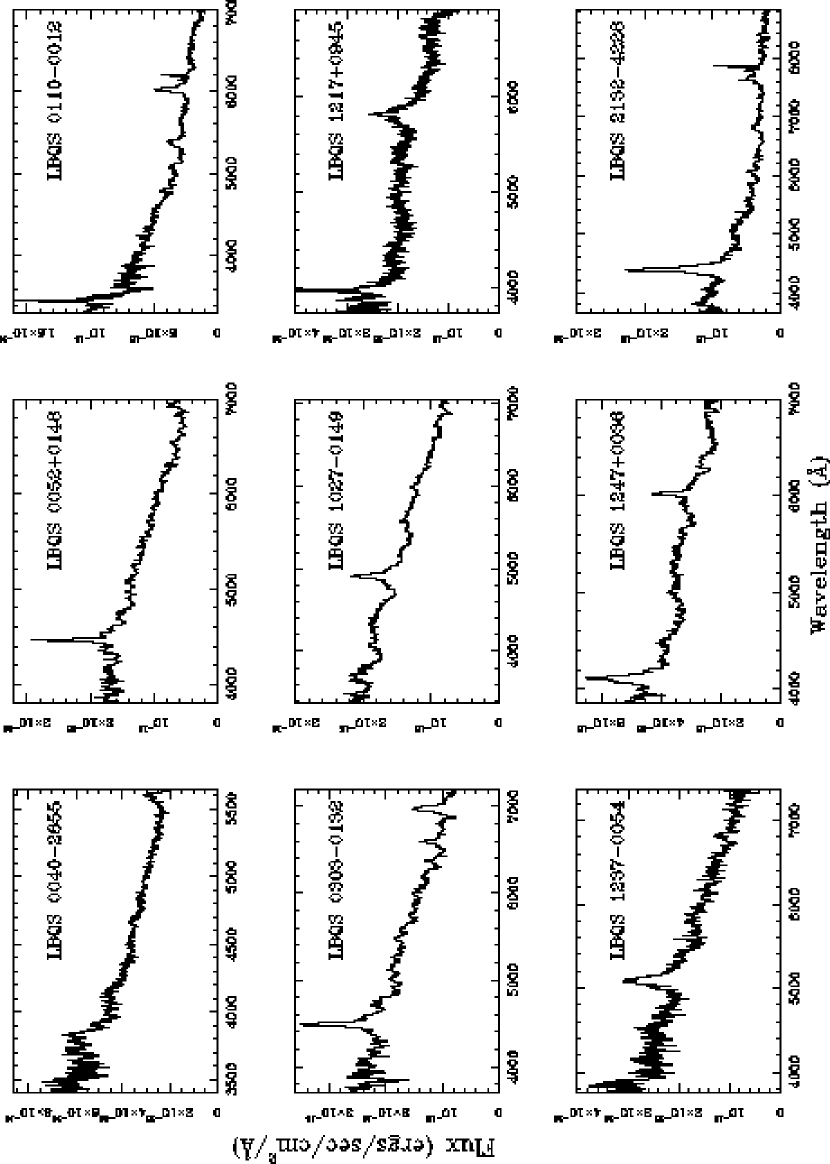
Since the publication of Paper VI, observations of further candidate objects have resulted in the identification of a small number of additional quasars. Similarly, observations by other workers of a small number of objects among the unobserved LBQS candidates have produced additional quasars. The latter group include several objects discussed in Paper VI that were not included in the LBQS catalogue due to book–keeping errors and one erroneous classification resulting from a “private communication”. Table 1 provides coordinates, apparent magnitudes and redshifts of 12 objects that should thus be included with the objects from Table 4 of Paper VI in any analysis of the LBQS quasar catalogue. Optical spectra of 9 of the objects in Table 1 are shown in Figure 1. The extended sample of 1067 quasars, together with the 8 “unknown” objects of Table 6 of Paper VI, which are potential BL Lacs, form the basis of the comparison with the FIRST survey described in this paper, although the results and conclusions are essentially identical if the original catalogue of 1055 quasars from Paper VI is employed.
The published celestial coordinates of LBQS quasars are accurate to arcsec in each ordinate. A significant contribution to the uncertainty arises from the difficulty in defining the celestial reference frame to which the APM–measured X–Y centroids of objects on the photographic plates may be tied. The coordinates published in Paper VI are based on a reference frame defined by the grid of several hundred PPM (Roser and Bastian 1988) stars within each UKST field. A significant improvement over the frame defined using the PPM stars is now possible through the use of the larger number of stars to fainter magnitudes that are included in the TYCHO–2 catalogue (Høg et al. 2000). Employing the celestial coordinates and proper motions of the TYCHO–2 stars within each LBQS UKST field, J2000.0 positions have been rederived for all sources in the APM flux–limited catalogues from which the LBQS quasars were identified. The resulting positions show greatly reduced systematic errors as a function of position on the plates. The root–mean–square positional differences between the catalogued TYCHO–2 star postions and the APM–positions is typically arcsec. In practice, the presence of factors such as nearby fainter images and a variety of emulsion/plate flaws mean that a significant number of “outliers” exist when pairing a large catalogue of APM sources to a reference catalogue, such as FIRST, so a matching radius of arcsec is appropriate (see §2.3).
2.2 Faint Images of the Radio Sky at Twenty–centimetres
The instigation of the FIRST radio survey (Becker et al. 1995), reaching a faint limiting flux density, mJy, at MHz, coupled with the sky coverage of thousands of square degrees, has enabled a number of observational investigations not hitherto possible to be undertaken. In particular, the survey sources include many quasars, not just the small fraction of the population detectable in radio surveys with much higher limiting flux densities. Given the very accurate celestial positions (arcsec) of the FIRST sources (White et al. 1997), identifying a large well–defined sample of optically bright quasars detected at radio wavelengths comparable in size to the largest existing samples of bright, optically–selected quasars has at last proved viable (White et al. 2000).
The availability, in mid–1999, of the FIRST survey catalogue over a substantial area of sky in a strip at declination provides a significant overlap in sky coverage with the LBQS. The FIRST catalogue used in this paper is that available at 1999 July 21 containing sources from FIRST observations made over the period 1993–1998. The sky coverage includes an area of deg2 coincident with the survey area of the LBQS, and includes 566 LBQS quasars and 4 LBQS “unknowns”.
2.3 The LBQS quasars and the FIRST Catalogue
An empirical verification of the appropriate radius to employ for matching the LBQS and FIRST catalogues was made using the existing LBQS quasars and unknown objects. Of the 570 LBQS quasars and unknowns within the area of the FIRST catalogue, 72 LBQS sources possess one or more FIRST sources within a arcsec radius. Sixty–seven of these have a smallest optical to radio source separations of arcsec. The large number of optical–radio coincidences within arcsec accords with expectations based on the astrometric accuracy of the catalogues. The predicted number of such chance coincidences is and all 67 associations almost certainly reflect physical association. In addition, 2 LBQS quasars (B1012+0213, B1313-0142)111To avoid potential confusion we employ the original LBQS object designations derived from the B1950.0 coordinates lie along lines joining two catalogued FIRST sources but the closest optical to radio source separation is arcsec. One LBQS source (B1319+0039) is separated by arcsec from a FIRST source and the quasar lies along a line joining the catalogued FIRST source to a second FIRST source, too faint to be included in the FIRST source catalogue but clearly visible in the FIRST image cutout and almost coincident with the quasar. All three of these LBQS quasars are virtually certain to be associated with the multiple FIRST sources. The predicted number of chance LBQS–FIRST coincidences within a arcsec radius is . Two further LBQS quasars (B1138-0126 and B2359-0216B) have single catalogued FIRST sources with separations between and arcsec and they most likely reflect chance superpositions. No further discussion of these two objects is included in the paper.
Table 2 includes details of the LBQS–FIRST source matches. Column 1, LBQS name, derived from the B1950.0 coordinates; columns 2–3, the J2000.0 right ascension and declination for the LBQS objects derived from the UKST plates; column 4, redshift; column 5, magnitude; column 6; FIRST source associated with the LBQS object; column 7, integrated radio flux from the FIRST catalogue; column 8, associated rms uncertainty in the FIRST maps at the source position; column 9, angular separation between the LBQS and FIRST sources; column 10, the –corrected ratio of radio to optical flux for each optical–radio association. For completeness, the three LBQS sources with optical–radio separations arcsec, denoted by “N” in column 11, are listed in Table 2 but these objects are not included in the assessment of the LBQS–FIRST match statistics.
The values of , the –corrected ratio of radio to optical flux for each optical–radio association, employed herein have been calculated according to the definition of Stocke et al. (1992). To facilitate comparison with the results of the FIRST quasar survey the same values for the assumed power–law spectral energy distributions, , in the radio and optical, and respectively, have been adopted as in White et al. (2000). In calculating White et al. employ the photographic magnitude as a direct estimate of the conventional magnitude employed in the definition. It is possible to make a series of quite complicated corrections to obtain an estimate of the quasar continuum flux at Å from the magnitudes (Hooper et al. 1995; §2.3). However, over the redshift range applicable to this investigation, the mean for a typical quasar is , which results in an increase of only in . Thus, differences in due to bandpass effects are in general very small and the uncertainty in the individual values of are dominated by possible intrinsic variability over the year epoch difference between the acquisition of the radio and optical fluxes and the errors in the radio and optical fluxes. Given these circumstances the raw magnitudes have been adopted as a direct estimate of magnitude.
2.4 Matching the LBQS input catalogue and the FIRST catalogue
Based on the predicted accuracy of the celestial positions of both catalogues, together with the empirical verification provided by the cross–correlation of the known LBQS quasar positions with the FIRST catalogue, a pairing radius of arcsec was adopted as the criterion for a match between an optical and FIRST source. There are FIRST sources in the deg2 of overlap with the LBQS catalogue. The LBQS flux–limited input catalogue contains stellar images and non–stellar images in the region of overlap and the predicted number of chance coincidences between FIRST sources and LBQS stellar and non–stellar sources are and respectively.
The cross–correlation of the two catalogues produces a total of matches within the arcsec pairing radius. Of these, are classified as stellar by the APM and non–stellar. The nature of the objective–prism plate material employed to compile the LBQS catalogue is such that a fraction of the flux–limited object catalogue defined from the APM scans of the UKST direct plates cannot be classified reliably. For example, objects may possess spectra contaminated by spectra of nearby sources. This straightforward loss of objects is responsible for the reduced effective area of the survey relative to the total area of sky surveyed. For the 11 fields included in the LBQS–FIRST overlap the predicted percentage of stellar and marginally resolved objects not included in the LBQS is (Paper VI; Table 2). Of the stellar FIRST–LBQS matches, () are classified as unprocessable, in excellent agreement with the prediction from the effective area calculation. The fraction of low surface brightness galaxies and significantly resolved galaxies with unprocessable spectra is in fact somewhat higher, although this is not relevant for the LBQS quasar catalogue with its low redshift limit of , and of the non–stellar objects () are classified as unprocessable.
Thus, the cross–correlation of the two catalogues produces 83 stellar sources and 380 non–stellar sources that were searched as part of the LBQS survey and that pair to catalogued FIRST sources. Of the 83 stellar sources 64 possess identification spectra obtained as part of the LBQS: 62 quasars and unknowns (Table 2), 1 active galactic nucleus and 1 star. Just 19 stellar objects, of which are expected to be chance coincidences, remain for which identification spectra were not obtained as part of the LBQS.
The large number of non–stellar matches appears to present a less tractable problem but in fact the majority of the objects can be eliminated as potential quasars from consideration of their image profiles on the UKST plates. The LBQS survey was designed to be sensitive to quasars with both unresolved and resolved images on the UKST direct plates. “Resolved quasars” might include objects at relatively low redshift, where the host galaxy is also visible, as well as gravitationally lensed quasars. The objective–prism spectra of objects, whether resolved or unresolved, satisfying the flux limits on the UKST direct plates were searched as part of the LBQS survey. However, the very tight, monotonic, relation between the peak and integrated brightness of unresolved stellar images on the UKST direct plates means it is possible to define a simple criterion that eliminates a large fraction of the resolved images from consideration. Specifically, for a resolved object to contain an unresolved source bright enough to satisfy the LBQS flux limits, the image of the resolved object must contain pixels that achieve a peak brightness at least equivalent to that of an unresolved source at the faint limit of the LBQS flux–limited catalogue (Paper VI: §3.1.3). The non–stellar sources may thus be divided into two categories, i) images with a peak surface brightness too faint to include an unresolved source bright enough for inclusion in the LBQS, 222 objects, and ii) images whose peak surface brightness exceeds that of the faintest unresolved source in the LBQS flux–limited catalogue, 158 objects. Five of the objects in the latter category had been identified as quasars (Table 2) and 4 as active–galactic–nuclei during the LBQS, leaving 149 objects for which identification spectra were not obtained as part of the LBQS.
Given the small predicted number of chance coincidences the majority of the non–stellar optical–radio associations likely reflect physical association. However, the peak surface brightness criterion used in the definition of the sample is extremely conservative. The vast majority of the “high surface brightness” non–stellar objects possess extended morphologies, consistent with galaxies at low redshift, , and no significant unresolved component exists. A significant fraction of the small number of objects with redshifts that exceed the LBQS low–redshift limit of and that show evidence for active–galactic nuclei, will also not possess unresolved components bright enough to be included in the LBQS. The nature of the small number of such non–stellar objects is further discussed in §4, following a description of the spectroscopic observations of the sources.
3 SPECTROSCOPIC OBSERVATIONS
Spectroscopic observations of 11 stellar and 35 non–stellar candidates were obtained using LRIS, the Low Resolution Imaging Spectrograph (Oke et al. 1995), on Keck I during the night of 2000 April 30. A 300 line/millimetre grating, blazed to Å, and a slit–width of arcsec gave a wavelength coverage of at a resolution of Å. Standard bias and flatfield exposures were obtained at the start of the night and comparison lamp exposures were obtained every few hours to monitor the wavelength stability of the spectrograph. Wavelength stability was determined to be Å. The slit was aligned East–West throughout the observations. Exposures of three spectrophotometric standard stars were obtained in order to place the spectra of the candidate objects on a relative flux scale but no attempt was made to obtain absolute spectrophotometry. Transparancy, which was good, and the seeing of arcsec were stable throughout the observations. Exposure times of s for the stellar objects predicted to be quasars and s for the other objects produced spectra of excellent quality, S/N, and the identifications, based on multiple absorption and emission features, are unambiguous. Redshifts for the extragalactic sources were determined by cross-correlation of the quasar spectra with the LBQS composite spectrum (Francis et al, 1991) and by direct measurement of the wavelengths of narrow emission lines, when present, or absorption features for the galaxies.
R. Becker and collaborators provided the spectrum of one stellar candidate identified as a quasar during their follow–up program of FIRST sources. In 1999 November they very generously also undertook LRIS observations on Keck I, employing a set–up very similar to that described above, of 6 of the stellar candidates, confirming their identifications as stars (Becker 1999, private communication).
Further spectroscopic observations of 1 stellar and 26 non–stellar candidates were obtained with the 6.5m MMT on the nights of 2000 November 19–20. The Blue Channel of the MMT Spectrograph was used with a 500 line/millimetre grating, blazed at Å, and a slit–width of arcsec, giving a wavelength coverage of at a resolution of Å. The slit was aligned along a constant azimuth to minimize the effect of atmospheric dispersion. Calibration, data reduction, and measurement of the redshifts followed procedures essentially identical to those for the Keck data.
The 2dF Galaxy Redshift Survey (2dFGRS) (Colless 1999) has a considerable overlap with the 6 LBQS fields that lie along the equatorial strip in the North Galactic Cap. The 2dFGRS Team have kindly made available the redshifts of 31 non–stellar objects listed in their catalogue as of 2000 December. Finally, a “Near Position” search of the NASA Extragalactic Database produced 7 additional galaxy identifications with published redshifts.
Combining the spectroscopic identifications from our own observations, the 2dF Galaxy Redshift Survey, R. Becker (and collaborators) and the NED–search produces identifications for all the stellar sources and for more than two–thirds of the non–stellar sources.
Table 3 contains the positions, radio properties and spectroscopic classifications of the 21 stellar objects in the LBQS flux–limited sample that are not included (as LBQS quasars or BL Lac candidates) in Table 2. Columns 1–2 , the J2000.0 right ascension and declination for the optical source derived from the UKST plates; column 3, magnitude; column 4; FIRST source associated with the LBQS object; column 5, integrated radio flux from the FIRST catalogue; column 6, associated rms uncertainty in the FIRST maps at the source position; column 7, angular separation between the LBQS and FIRST sources; column 8, LBQS classification (if available) of the source prior to observation; column 9, spectroscopic identification; column 10, redshift; column 11, source of the spectroscopic classification.
Table 4 gives the positions and radio properties for all 153 non–stellar objects in the LBQS flux–limited sample that are not included (as LBQS quasars or BL Lac candidates) in Table 2. Spectroscopic identifications are included for 103 objects. Columns 1–2, the J2000.0 right ascension and declination for the optical source derived from the UKST plates; column 3, magnitude; column 4; FIRST source associated with the LBQS object; column 5, integrated radio flux from the FIRST catalogue; column 6, associated rms uncertainty in the FIRST maps at the source position; column 7, angular separation between the LBQS and FIRST sources; column 8, galaxy redshift or spectroscopic classification; column 9, source of the spectroscopic classification. The references for the redshifts of the 7 galaxies identified in the NED–search are indicated.
The information for each non–stellar candidate is identical to that given for the stellar candidates in Table 3 with the following exceptions. None of the non–stellar sources were identified as LBQS quasar candidates and the pre–identification LBQS classification is therefore omitted. The procedure used to generate a close to linear relation between APM instrumental magnitudes and photometric magnitudes is based on the universal profile of the unresolved sources on each UKST plate (Bunclark and Irwin 1983). The scheme is extremely effective for the stellar sources but for resolved objects, whose surface brightness profiles exhibit a very wide range of shape, the derived “photometric” magnitudes possess a large scatter and are systematically too bright, often by as much as a magnitude or more. Thus, while all the objects listed in Table 4 possess instrumental magnitudes that place them within the LBQS flux–limited sample, only in the cases where the image morphology is close to stellar will the photometric magnitudes be reliable. The photometric magnitudes have been included in Table 4 for completeness but for non–stellar objects the values are bracketed and specified to only one decimal place. A discussion of those objects with redshifts exceeding the LBQS low redshift limit of is included in §4.2.
4 NEW LBQS–FIRST QUASARS
4.1 The stellar LBQS–FIRST objects
The identification of 10 objects, most with optical–radio separations arcsec, as Galactic stars accords well with the predicted incidence of chance associations (§2.4). Seven objects have redshifts , placing them above the lower redshift limit of the LBQS, and 1 object has a featureless spectrum consistent with an identification as a BL Lac. The status of two of these objects deserves some comment.
We note with some embarrassment that we acquired a spectrum of J1022–0103 at the MMT in 1990 March, early in the compilation of the LBQS catalogue. On the basis of that spectrum the object was classified as a “star”. While considerable attention was paid to ensuring that “star” classifications were assigned only to objects with positive identifications of stellar features, J1022–0113 was mistakenly so classified and it should have appeared in Paper VI as an “unknown”. The very close optical–radio match and large radio–flux indicate the object is almost certainly a BL Lac. Indeed, identification with the bright ROSAT source RXJ1022.7-0112 (Voges et al. 1999) led Appenzeller et al. (1998) to identify J1022–0103 as a BL Lac.
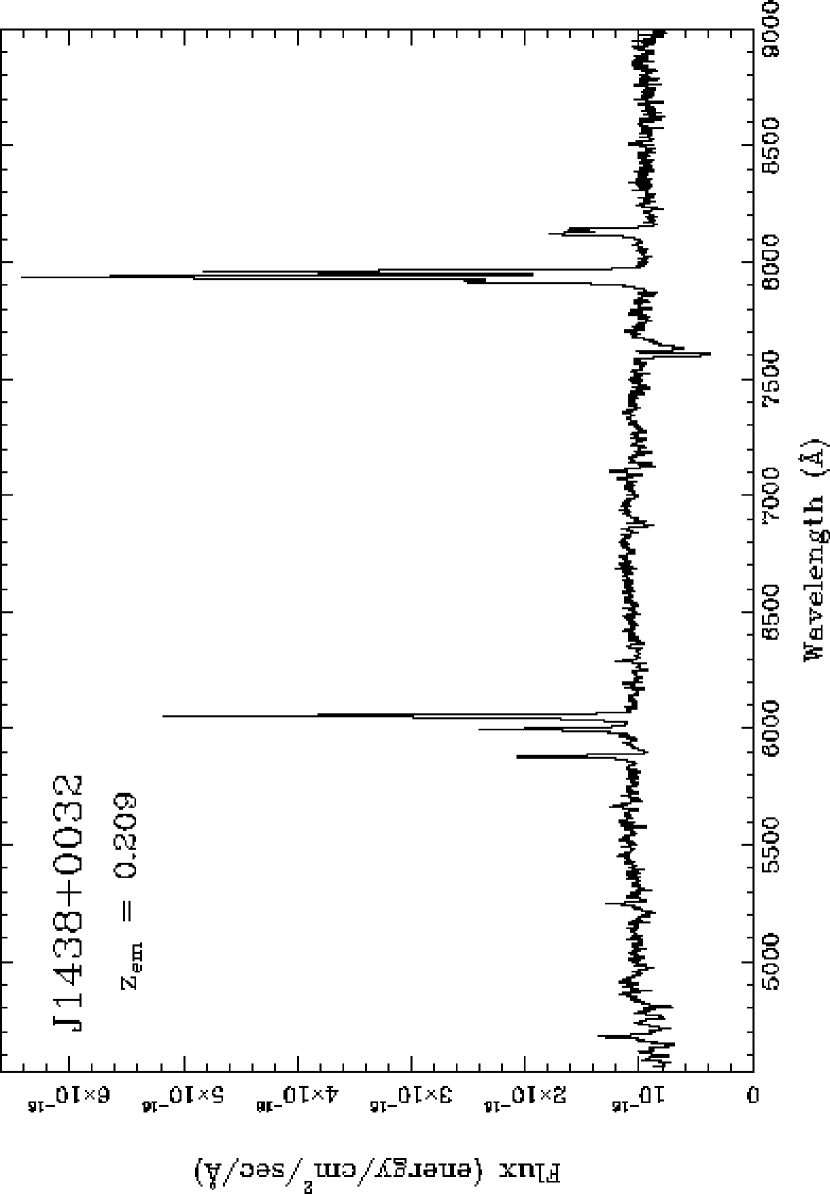
The spectrum of J1438+0032 (), Figure 2, shows a well–defined continuum, of essentially neutral colour, with stellar absorption features, including Ca H+K, G–band and Na D, visible. Strong, narrow and asymmetric emission lines, including H, [O III] 4959,5007, H+N II 6584, [S II] 6716,6731 and the absence of any broad line component are consistent with the presence of a Seyfert 2 nucleus. Notwithstanding the APM–classification of “stellar”, the object on UKST plates is clearly a galaxy with a compact appearance that does not appear to possess an unresolved source bright enough to satisfy the LBQS flux limit. The integrated magnitude is close to the LBQS flux limit of in the field and the magnitude of , based on the peak brightness, places the nuclear component below the LBQS flux limit. The presence of detectable stellar absorption features, in what is essentially a nuclear spectrum (acquired with a arcsec slit), is consistent with the conclusion that a substantial fraction of the integrated light derives from stars. This conclusion is further supported by the form of the objective–prism spectrum, which extends much bluer (Å) than the Å limit of the Keck spectrum. The objective–prism spectrum is dominated by a well–defined component in the wavelength range Å, indicative of a early–type spiral. A definite ultraviolet tail extends to the atmospheric cutoff but it contains only a small fraction of the total flux. We conclude that the active galactic nucleus in J1438+0032 falls significantly below the flux–limit for inclusion in the LBQS. Thus, the complete spectroscopic identification of all “stellar” sources matched to the FIRST catalogue produces 6 new quasars and one (previously misclassified) BL Lac object.
4.2 The non–stellar LBQS–FIRST objects
Five of the 103 non–stellar objects with spectroscopic observations have redshifts , all just above the lower redshift limit of the LBQS. To satisfy the criteria for inclusion in the LBQS an object must also contain an unresolved nuclear component brighter than the faint LBQS flux limit. The morphologies and spectra of three galaxies confirm that any nuclear component is much fainter than the LBQS flux limit in the relevant UKST field: J1027–0216 () possesses a spectrum with significant stellar absorption features (Ca H+K, G–band, Na D…). The presence of strong, narrow, emission lines of [O III] 4959,5007 and [O II] 3727, together with weak H emission indicate the object is experiencing a period of star–formation. The image morphology is extended and any nuclear component must be significantly fainter than the LBQS flux limit of in the field. The 2dFGRS magnitude is , confirming the lack of any bright component. J1334+0102 () also possesses a spectrum with significant stellar absorption features and H and H in absorption. Evidence for a relatively recent episode of star formation comes from the presence of weak [O III] 4959,5007 and H emission along with stronger [O II] 3727 emission. The overall form of the spectrum is consistent with that of an early–type spiral galaxy. The image morphology is significantly extended and there is no evidence for a nuclear component bright enough to satisfy the LBQS flux limit of in the field. The 2dFGRS magnitude of the object is . A brighter galaxy is located arcsec to the south–east. J1449–0116 () has a spectrum completely dominated by an old stellar population. There is no evidence for emission lines or a non–stellar continuum. The morphology of the object is entirely consistent with that of a early–type galaxy and there is no evidence for the presence of an unresolved nuclear component brighter than the LBQS flux limit of in the field. The 2dFGRS magnitude is .
The two other non–stellar objects with , J0100–0200 () and J1334+0102 () are very different in character. Both possess strong blue continua, broad hydrogen lines, weaker narrow oxygen lines and stellar absorption features are not evident. The MMT spectrum of J0100-0200 extends far enough to the blue that strong broad Mg II emission can just be seen. While the objects are by definition non–stellar, their image morphologies are compact on the UKST plates and the presence of bright unresolved components was noted during their acquisition at the telescopes. Magnitudes, estimated from the peak brightness in the images, for both objects are constrained to be . The nuclear component will be several tenths fainter than this bright limit, however, J0100–0200 will certainly satisfy the associated LBQS flux limit of . The magnitude of J1334+0102 will place it very close to the LBQS flux limit of in its field but we shall assume that it does indeed qualify for inclusion in the LBQS. Thus, the spectroscopic identification of two–thirds of all the “non–stellar” sources matched to the FIRST catalogue produces 2 new quasars.
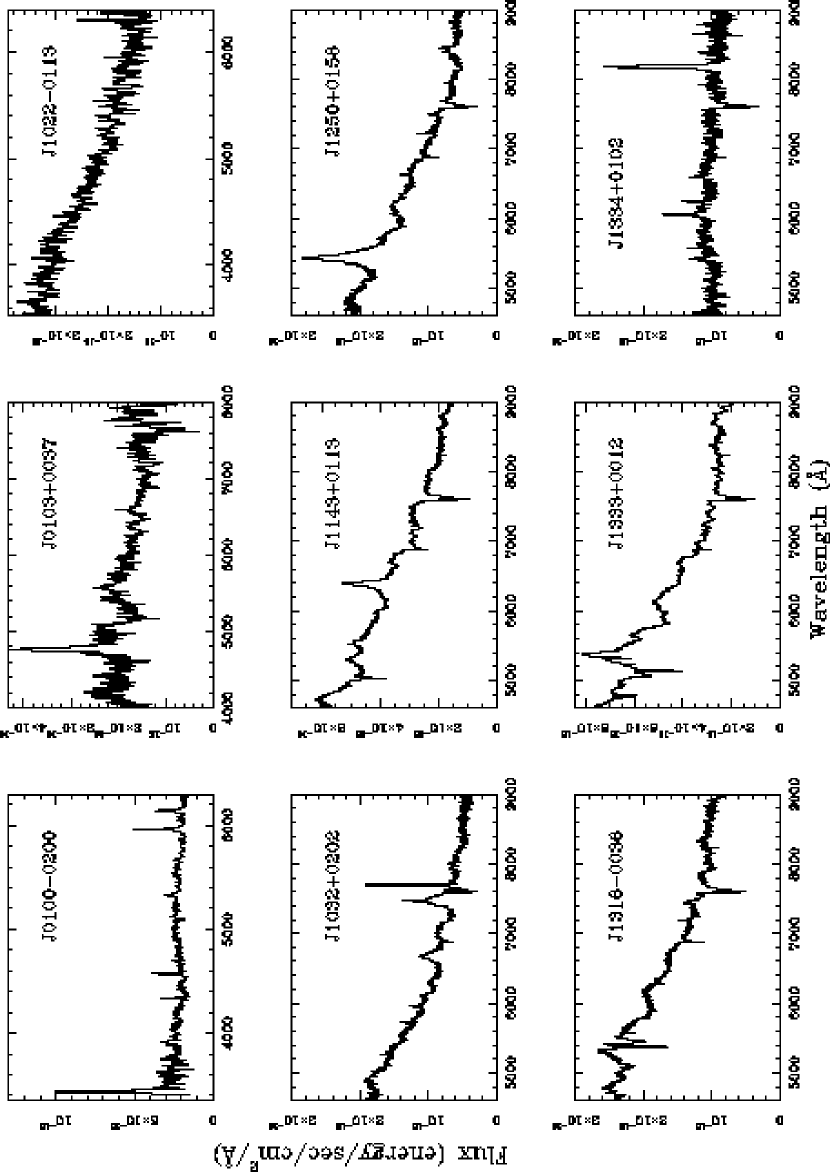
The optical and radio properties of the total of 9 new objects satisfying the LBQS redshift and flux selection criteria are listed in Table 5. Column 1, name, derived from the J2000.0 coordinates; columns 2-3, the J2000.0 right ascension and declination from the UKST plates; column 4, redshift; column 5, magnitude; column 6; FIRST source associated with the LBQS object; column 7, integrated radio flux from the FIRST catalogue; column 8, associated rms uncertainty in the FIRST maps at the source position; column 9, angular separation between the LBQS and FIRST sources; column 10, the –corrected ratio of radio to optical flux for each optical–radio association; column 11, LBQS classification (if available) of the source prior to observation; column 12, spectroscopic identification. The LBQS candidates were classified on a scheme indicating decreasing probability an object was a quasar, specifically: “QSO”, “QSO?”, “QSO??”, “Star??”, “Star?”, “Star”. Thus 6 of the 9 new objects were identified as quasar candidates during the compilation of the LBQS survey. The optical spectra of all 9 objects are shown in Figure 3.
The spectra of the 9 new objects are largely unremarkable, with continuum and emission line properties very similar to a number of existing LBQS quasars. However, 2 objects possess absorption features of some note: J1316–0038: shows two strong and moderately broad absorption troughs near the peak of the Mg II emission line. The presence of this absorption affects the redshift derived from cross–correlation, . A narrow emission feature, seen at at , could be due to [O II] . Assuming this identification is correct, the systemic redshift of the quasar is and the longer wavelength absorption trough has . J1333+0012: two narrow Mg II absorption doublets are seen within km s-1 blueward of the Mg II emission line peak.
5 EFFECTIVENESS OF THE LBQS
The discussion concerning the effectiveness of the LBQS survey given in Paper VI concluded that the survey contained of the total number of quasars satisfying the redshift and flux–limits of the survey. The majority of the quasars not included in the published survey were believed to lie among the lower–probability candidates (objects classified Star??, QSO?? or QSO?) and for which spectroscopic observations had yet to be made. Attention was also drawn to the redshift interval , in which the properties of typical quasar SEDs produce objective–prism spectra that are relatively red and largely featureless and where the survey was therefore predicted to be less effective than average. Consideration of the nature of the candidate selection algorithms and empirical comparison with surveys and compilations of existing quasars led to the conclusion that only very red, essentially featureless objects, such as red BL Lacs, would escape detection.
The direct comparison of the entire LBQS flux–limited source catalogue with the FIRST survey over more than half the LBQS survey area, summarised in Table 6, provides a stringent test of the optical survey and the conclusions made concerning its effectiveness. Based on the confirmation of 2 quasars among the 103 non–stellar objects with spectroscopic identifications we assume that one further quasar will be confirmed among the 50 remaining non–stellar objects without spectroscopic observations listed in Table 4. Based on this assumption, the total number of FIRST–detected quasars (and BL Lacs) in the LBQS flux–limited catalogue is 77 (67 objects from Table 2, 9 objects from Table 5 and the 1 object inferred to lie among the non–stellar objects without spectroscopic redshifts in Table 4). The straightforward fractional incompleteness is thus , in good agreement with the prediction from Paper VI.
The radio properties of the new objects can be compared to those of the 67 LBQS–FIRST objects previously known. Figure 4 shows as a function of redshift for the objects from Table 2 and Table 5. A Student t–test and Kolmogorov–Smirnov test give probabilities of 0.20 and 0.12, respectively that the samples are drawn from the same distribution. The similarity of the apparent magnitude distributions also supports the conclusion that there is no significant difference in the gross properties of the two samples: A Student t–test and Kolmogorov–Smirnov test for the distribution of apparent magnitudes give probabilities of 0.52 and 0.63 respectively that the samples are drawn from the same distribution.
The consistency of the distributions of and apparent magnitude is not surprising given the status of the 9 new LBQS–FIRST objects within the LBQS candidate list. Six of the 9 objects appear in the LBQS candidate list, indeed one of the objects (J1022-0113) was observed spectroscopically. J1143+0113 (), for example, is an extremely blue object that was identified at an early stage of the LBQS but the noise in the only moderate signal–to–noise ratio objective–prism spectrum conspires to produce apparent absorption lines at wavelengths corresponding to H and H, suggesting classification as a hot white dwarf, and the object was therefore not assigned a high priority for spectroscopic follow–up. Figure 5 illustrates the colours of the objects from both Tables 2 and 5, along with colours for all the remaining LBQS quasars, as a function of redshift. The definition of the colour–measure, the Half–Power Point (HPP) of the objective–prism spectra, is described in §3.1.1 of Paper VI. In this representation, the dashed–line at HPP=0 indicates the boundary below which objects satisfy the basic colour selection criterion for inclusion in the LBQS candidate list. The substantial spread in colour at fixed redshift is well illustrated by the distribution of the LBQS quasars as a whole. The systematic variation in the location of the mid–point of the distribution as a function of redshift is directly analogous to the well–established variation in colour as a function of redshift exhibited by quasars. The extent of the spread in colour does not vary significantly as a function of redshift, although a small fraction of pathological objects does exist. The conclusion drawn in Paper VI regarding the likely reduction of the effectiveness of the LBQS selection in the redshift region about was based on noting that, assuming an essentially constant dispersion in HPP as a function of redshift, a number of the redder quasars at would fail to satisfy the colour selection and in many cases their spectra do not possess other characteristic features that would allow their identification as high–probability candidates. The confirmation that 4 of the 9 new LBQS–FIRST objects have redshifts in the range thus accords well with expectations.
The other redshift interval where increased difficulty in identifying quasars is not unexpected is close to the low–redshift limit, , of the survey. The low–redshift cutoff of for the LBQS was chosen with some care. While the candidate selection algorithms are applied to objects irrespective of morphology, the presence of a significant contribution of stellar light from the host galaxy causes the fainter quasars at to appear increasingly red. A discussion of the problem in the context of identifying quasars in bright host galaxies, including the results of simulations of quasar+host–galaxy spectra, is contained in Hooper et al. (1995; Appendix B). Figure 9 of Hooper et al. illustrates how rapidly the colour of quasar+host systems moves to the red at . The restriction of the LBQS survey selection function to nuclear components that satisfy the faint flux limit of the LBQS, combined with the continuity in the amplitude of the spread of HPP as a function of redshift seen in Figure 5, means that it is extremely unlikely that a significant population of quasars at have been excluded from the LBQS. However, the number of objects in the flux–limited source catalogue with HPP values close to the selection boundary is large and the detection of 2 new LBQS–FIRST objects with likely reflects a genuine decrease in the effectiveness of the selection right at the redshift limit. As is evident from Figure 5, any such effect is confined to as the locus of the HPP distribution moves rapidly blueward, dropping below the HPP=0 line boundary, even by redshift .
In summary, the small number of additional LBQS–FIRST objects possess gross optical and radio properties entirely consistent with those of the quasars previously identified in the LBQS. The number and redshift distribution of the additional LBQS–FIRST objects also accords well with the predictions of the effectiveness of the LBQS selection criteria. The conclusion that no new population of objects with significantly different properties has eluded the LBQS optical selection is borne out by consideration of the spectra of the 9 LBQS–FIRST objects shown in Figure 3. In the context of the LBQS survey the spectra are unremarkable both individually and taken together as a sample. For each object, examples of quasars with essentially identical SEDs at comparable redshifts exist within the LBQS survey.
6 DISCUSSION
Notwithstanding advances in the application of quantitative techniques to the selection of quasars at optical wavelengths, suggestions that optical surveys suffer from significant biases against the detection of certain types of quasar persist. For example, in §5.3 of their presentation of the FIRST Bright Quasar Survey (FBQS), White et al. (2000), discuss such a bias in the context of the detection of low–ionization BAL QSOs. The surface density of the recently–detected “radio–loud” BALs among the FBQS quasars is too low for the LBQS–FIRST match presented in this paper to provide interesting constraints. However, the essentially complete census of 76 radio–detected objects within the LBQS flux limits presented here demonstrates conclusively that there is no significant bias against any class of quasar, constituting of the FIRST radio–detected population222The limit of is derived by noting that the detection of no such objects constrains the true incidence of any such population in the survey area to be objects. The same constraint applies to any hypothetical bias at particular redshifts or magnitudes, other than the previously reported reduction in the efficiency of the LBQS at . Furthermore, the FIRST–LBQS comparison offers no support for Usher & Mitchell’s (2000) contention that the LBQS is unsuitable for the estimate of the quasar luminosity function at low redshifts. Sample limits of redshift and magnitude should be adopted for such statistical analyses (Hewett, Foltz & Chaffee 1993, Paper VI). To facilitate quantitative comparison between the properties of the LBQS catalogue and other surveys we have adopted a completeness as a function of redshift as tabulated in Table 7. The numerical values are based on adopting a global incompleteness of with an increase in the loss of objects at redshifts and at the low redshift limit, , of a factor of two.
Perhaps most importantly, the results of the LBQS–FIRST comparison offers the prospect of utilising both the LBQS and FBQS, with their very large numbers of quasars, to better understand the physical origin of the very broad range of SEDs within the quasar population. The analysis of composite spectra from the two surveys by Brotherton et al. (2001) signals the start of this process. However, the optical bandpasses employed in the selection of the two samples, (Å, Å) for the LBQS and Palomar (Å, Å) for the FBQS, are significantly different and a careful treatment of the effects of the different bandpasses used to define the optical flux limits is required when interpreting the statistical properties of the quasar samples.
The potential importance of the passband differences is evident from the very different fraction of radio–detected objects found to the respective optical flux limits in the two surveys. White et al. (2000) suggest that at the brightest optical magnitudes the surface density of optically–detected and radio–detected quasars are essentially identical. Even at the faint optical limit of the FBQS, , White et al. conclude that the radio–detected fraction is . The FIRST–LBQS comparison in this paper provides a hard upper limit to the fraction of the quasar population with optical magnitudes detected in the FIRST survey. Based on the total of 570 previously–known LBQS quasars and “unknowns” within the FIRST survey area and the statistics of the LBQS–FIRST match (67 radio–detected objects among the 570 LBQS quasars and “unknowns” and 10 new radio–detected objects), the fraction of quasars detected by FIRST is (i.e., 77/(570+10)). An improved estimate is obtained by applying an incompleteness correction to allow for the fraction of quasars not included in the LBQS. Adopting a survey completeness of for the number of LBQS quasars which are not detected in the radio (i.e., 503 objects), reduces the percentage of radio–detected objects to , very different from the figure of of objects with magnitudes deduced by White et al. (2000). Dividing the LBQS into magnitude bins containing quasars, Table 8, shows a trend in the same sense as that found by White et al. but the fraction of radio–detected objects333The true fractions, allowing for the incompleteness in the census of LBQS quasars only detected in the optical, will decrease by is significantly smaller than they find at all magnitudes. For the very brightest LBQS objects, , where the statistics are poor (14 quasars, 6 radio–detected, fraction 0.43), the radio–detected surface density approaches half the optical surface density. So we conclude that only for the optically very brightest quasars, , can White et al.’s claim that the radio–detected surface density matches that of optically–selected quasars be true.
The explanation for the large differences in the radio–detected fraction of quasars may be due to a combination of two factors: (i) radio–detected quasars possess somewhat redder SEDs compared to the population as a whole and the –magnitude limit therefore results in a larger fraction of radio–detected objects compared to the LBQS sample limited by the much bluer passband, (ii) the form of the conversion employed by White et al. to relate published quasar surface densities from flux–limited samples at blue wavelengths to the FBQS surface–densities determined in the –passband. Employing a large database of broadband colours, though , we intend to present a detailed investigation of differences in the SEDs of sub–samples of quasars from the LBQS and FBQS in a future paper. However, preliminary indications of the origin of the difference in radio–detected fractions can be drawn using composite spectra for the two samples. We have used the FBQS composite spectrum derived from 657 FBQS quasars and the LBQS composite employed by Brotherton et al. (2000). Observed–frame spectra over the redshift range were generated using both composites. These were then transformed to simulate their appearance on the objective–prism plates employed in the LBQS survey. The procedure is based on an empirical transformation derived from flux–calibrated quasar and stellar spectra and their associated spectra on the objective–prism plates. The HPP values for the two composite spectra are shown in Figure 6 (solid line – LBQS composite; dashed line – FBQS composite).
The extremely good match between the centroid of the distribution of HPP values for the individual LBQS quasars and the synthetic locus of the LBQS composite is evident. The only significant difference between the loci of the LBQS and FBQS composites occurs in the redshift interval where the stronger Ly emission discussed by Brotherton et al. causes the FBQS composite to become bluer than the LBQS composite. The FBQS composite is marginally redder than the LBQS composite at redshifts but the difference is small relative to the intrinsic spread among the individual quasars and relative to the distance of the loci from the LBQS colour–selection boundary. There is no evidence for any significant difference in the distribution of colours of the 76 radio–detected quasars compared to the LBQS quasars as a whole. If the SEDs of the radio–detected objects were significantly redder (over the observed–frame wavelength interval Å) the objects would possess larger HPP values at a given redshift. The similarity of the LBQS and FBQS composite spectra, coupled with the very similar distributions of quasars with and without radio detections in the LBQS colour–selection space, suggests that systematic differences between the SEDs of radio–detected quasars and the population as a whole are not large.
The availability of the FBQS and LBQS composite spectra allows a more direct estimate of the surface density of radio–detected quasars for a sample flux–limited in the Palomar passband. Table 9 lists the and colours for the FBQS and LBQS composite spectra as a function of redshift. The maximum redshifts are set by the point at which the Lyman– forest begins to affect the flux in the and passbands significantly. The composite spectra are, by their nature, made up from quasars with an extended range of redshift and the depression of the continuum at rest–frame wavelengths Å does not reproduce the behaviour seen in actual quasars at the higher redshifts. The colours were calculated using the Palomar and sensitivity curves of Minkowski & Abell (1963) and our own determination of the sensitivity. The filter plus emulsion sensitivity curves were combined with one reflection off aluminium and atmospheric absorption and extinction appropriate for observations made at an airmass of 1.3 for a relatively low–altitude site such as Siding Spring or Mount Palomar. The synthetic photometry was performed using the synphot package in the Space Telescope Science Data Analysis System.
The colours show significant variations with redshift, including a prominent redward excursion at where [O III] 4959,5007 and H emission moves through the narrow –passband. Additional redshift increments have been included in Table 9 to quantify the rapid change in the colours at . The magnitude reddening in the colours coincides exactly with the excess of quasars seen at this redshift in the FBQS redshift distribution (White et al. 2000; Figure 12).
Taking a redshift range of , with the lower limit set by the LBQS low–redshift boundary and the upper limit taken so that the FBQS colour–selection criterion of is not a significant factor, we estimate the true surface density of FBQS quasars at as follows. The 565 quasars in Table 2 of White et al., within an area of deg2 give a surface density of deg-2. This number is reduced by a factor of 1.09 to take account of the Eddington–bias (Eddington 1913) due to an rms magnitude error of , giving a final surface density estimate of deg-2.
For the LBQS, we take the quasars in the extended sample, calculate the magnitudes using the original magnitudes and the colours for the FBQS composite in Table 9, weighting each quasar by the reciprocal of the completeness estimate as a function of redshift (Table 7). the number of quasars with magnitudes is then calculated. A reduction of a factor 1.02 is made to account for Eddington–bias due to an rms magnitude error of . The calculation was repeated using the colours for the LBQS composite spectrum. The resulting surface density estimates are deg-2 (FBQS composite colours) and deg-2 (LBQS composite colours), giving a radio–detected fraction of .
The calculation is far from ideal as no account is taken of the dispersion of SEDs among the quasars, i.e., all quasars are assumed to possess the same SED. However, the insensitivity of the surface density estimate to which of the two composite spectra are used to calculate the colours is encouraging and the resulting radio–detected fraction is much closer to the direct estimate of found in this paper (c.f., the fraction of advocated by White et al.).
The importance of establishing the transformation between magnitude bands for studies of the luminosity function and evolution of the quasar populations is evident from consideration of the redshift distributions of the LBQS and FBQS samples. Figure 6a shows the redshift histogram of the 565 FBQS quasars with redshifts and magnitudes from Table 2 of White et al. (2000). The redshift histogram of the 1067 quasars in the extended LBQS sample, after application of the redshift completeness factors listed in Table 7, normalised to the same number of quasars as in the FBQS is also shown. Compared to the LBQS redshift distribution the FBQS exhibits a significant excess of objects in the bin and a much steeper decline in the number of quasars over the range . Brotherton et al. (2001) suggest that the larger number of quasars at low redshift in the FBQS may be due to the inclusion of very bright sources in the FBQS. In fact, whether the small number (13) of very bright () FBQS–sources are included makes no significant change to the differences evident between the two histograms. Figure 6b reproduces the FBQS redshift histogram together with error bars based on the number of objects per bin. Also shown is the redshift histogram for the sub–sample of LBQS quasars with , where the –magnitudes have been calculated according to the procedure described above, together with associated error bars. The LBQS histogram shown in Figure 6b was derived using the colours for the FBQS composite spectrum but there is no discernible difference if colours from the LBQS composite are employed instead. Note the increased frequency of low–redshift, , quasars and the much steeper decline in the number of quasars at in the transformed LBQS–histogram. Indeed, the form of the redshift histograms over the full redshift range, , are very similar and we conclude that comparison of the distribution of quasars in the FBQS and LBQS as a function of redshift adds further support to the conclusions regarding the effectiveness of the LBQS and modern optically–selected quasar surveys in general.
7 CONCLUSIONS
The principal results of this study can be summarised as follows:
1. Cross–correlation of the source catalogues for the LBQS and the First Survey in of sky common to both surveys yields 67 positional coincidences between FIRST sources and known LBQS quasars. In addition, 19 stellar and 149 non–stellar coincidences are found. Optical spectroscopy of all of the stellar and two–thirds of the non–stellar sources reveals eight new quasars and one BL Lac object that was observed but misclassified during the LBQS.
2. The fractional incompleteness of the LBQS determined from this sample is , in good agreement with the published estimate of . Furthermore, four of the new objects have redshifts where the LBQS selection techniques are known to have decreased efficiency.
3. The distributions of radio–to–optical power, apparent magnitude and spectroscopic properties of the new objects are consistent with the 67 previously–known LBQS–FIRST objects. This essentially complete census of 76 radio–selected objects within the LBQS flux limits demonstrates conclusively that there is no significant bias in the LBQS selection against any class of quasar constituting more than of the FIRST radio–detected population.
4. The fraction of radio–detected quasars in the LBQS catalogue is found to be , considerably smaller than the value of found by White et al. (2000) for the FBQS. To facilitate comparison of the two surveys we present colours as a function of redshift for the published LBQS and FBQS composite spectra. Applying corrections for the bandpass differences between the LBQS and FBQS surveys we predict a radio–detected fraction of for the FBQS sample, which is limited at , close to the direct estimate of found for the LBQS sample in this paper.
5. After correction for passband–dependent effects, the redshift histogram over the redshift range for the sub–sample of LBQS quasars with is very similar to that of the FBQS. This adds further support to our conclusions regarding the effectiveness of the LBQS and modern optically–selected quasar surveys in general.
We are particularly grateful to Bob Becker and collaborators for undertaking spectroscopic observations on our behalf and allowing us to reproduce their spectrum of J0103+0037. The generosity of Matthew Colless and the 2dF Galaxy Redshift Survey Team in providing galaxy redshifts prior to publication and allowing us to include their redshifts in this paper is greatly appreciated. This research has made use of the NASA/IPAC Extragalactic Database (NED) which is operated by the Jet Propulsion Laboratory, California Institute of Technology, under contract with the National Aeronautics and Space Administration. We are pleased to acknowledge the continued support provided for the LBQS through NSF grant AST 98–03072. Data and analysis facilities at the Institute of Astronomy were provided by the Starlink Project which is run by CCLRC on behalf of PPARC. The authors wish to extend special thanks to those of Hawaiian ancestry on whose sacred mountain we are privileged to be guests. Without their generous hospitality, many of the observations presented herein would not have been possible.
References
- Appenzeller et al. (1998) Appenzeller, I., et al. 1998, ApJS, 117, 319
- Becker et al. (2000) Becker, R. H., White, R. L., Gregg, M. D., Brotherton, M. S., Laurent-Muehleisen, S. A., & Arav, N. 2000, ApJ, 538, 72
- Becker, White & Helfand (1995) Becker, R. H., White, R. L., & Helfand, D. J. 1995, ApJ, 450, 559
- Boyle et al. (1990) Boyle, B. J., Fong, R., Shamks, T., & Peterson, B. A. 1990, MNRAS, 243, 1
- Brotherton et al. (2001) Brotherton, M. S., Tran, H. D., Becker, R. H., Gregg, M. D., Laurent–Muehleisen, S. A., & White, R. L. 2001, ApJ, 546, 775
- Bunclark & Irwin (1983) Bunclark, P. S., & Irwin, M. J. 1983, in Proceedings of the Statistical Methods in Astronomy Symposium, ESA Special Publication No. SP–201 (ESA, Noordwijk), p. 195
- Clements et al. (1996) Clements, D. L., Sutherland, W. J., Saunders, W., Efstathiou, G. P., McMahon, R. G., Maddox, S., Lawrence, A., & Rowan-Robinson, M. 1996, MNRAS, 279, 459
- Colless (1999) Colless, M. M. 1999, Phil. Trans. Roy. Soc. Lond. A, 357, 105
- Cristiani et al. (1995) Cristiani, S., et al. 1995, A&AS, 112, 347
- Eddington (1913) Eddington, A. S. 1913, MNRAS, 73.359
- Francis et al. (1991) Francis, P. J., Hewett, P. C., Foltz, C. B., Chaffee, F. H., Weymann, R. J., & Morris, S. L. 1991, ApJ, 373, 465
- Goldschmidt (1993) Goldschmidt, P. 1993, Ph.D. thesis, University of Edinburgh
- Hawkins and Veron (1995) Hawkins, M. R. S., & Véron, P. 1995, MNRAS, 275, 1102
- Hewett et al. (1993) Hewett, P. C., Foltz, C. B., & Chaffee, F. H. 1995, ApJ, 406, L43
- Hewett et al. (1995) Hewett, P. C., Foltz, C. B., & Chaffee, F. H. 1995, AJ, 109, 1498
- Høg et al. (2000) Høg, E., Fabricius, C., Makarov, V. V., Bastian, U., Schwekendiek, P., Wicenec, A., Urban, S., Corbin, T., & Wycoff, G. 2000, A&A, 357, 367
- Hooper et al. (1995) Hooper, E. J., Impey, C. D., Foltz, C. B., & Hewett, P. C. 1995, ApJ, 445, 62
- Minkowski & Abell (1963) Minkowski, R.L., & Abell, G.O. 1963, Stars and Stellar Systems Vol III, Basic Astronomical Data, University of Chicago Press, 481
- Oke et al. (1995) Oke, J. B., Cohen, J. G., Carr, M., Cromer, J., Dingizian, A., Harris, F. H., Labrecque, S., Lucinio, R., Schall, W., Epps H., and Miller, J. 1995, PASP, 107, 375
- (20) Roser, S., & Bastian, U. 1988 A&AS, 74, 449
- Shectman et al. (1996) Shectman, S. A., Landy, S. D., Oemler, A., Tucker, D. L., Lin, H., Kirshner, R. P., & Schechter, P. L. 1996, ApJ, 470, 172
- Schneider et al. (1994) Schneider, D. P., Schmidt, M., & Gunn, J. E. 1994, AJ, 107, 1245
- Stocke et al. (1991) Stocke, J. T., Morris, S. L., Gioia, I. M., Maccacaro, T., Schild, R., Wolter, A., Fleming, T. A., & Henry, J. P. 1991, ApJS, 76, 813
- Stocke et al. (1992) Stocke, J. T., Morris, S. L., Weymann, R. J., & Foltz, C. B. 1992, ApJ, 396, 487
- Suntzeff et al. (1996) Suntzeff, N., et al. 1996, IAU Circ., 6490, 1
- Usher & Mitchell (2000) Usher, P. D., & Mitchell, K. J. 2000, AJ, 120, 1683
- Voges et al. (1999) Voges, W., et al. 1999, A&A, 349, 389
- Warren et al. (1991) Warren, S. J., Hewett, P. C., & Osmer, P. S. 1991, ApJS, 76, 23
- White et al. (2000) White, R. L. et al. 2000, ApJS, 126, 123
- White et al. (1997) White, R. L., Becker, R. H., Helfand, D.J., & Gregg, M. D. 1997, ApJ, 475, 479
- Wills and Wills (1974) Wills, D., & Wills, B.J. 1974, ApJ, 190, 271
| LBQS Name | R.A. | Dec. | R.A. | Dec. | Field | Notes | ||
|---|---|---|---|---|---|---|---|---|
| (B1950.0) | (B1950.0) | (J2000.0) | (J2000.0) | |||||
| B0040-2655 | 00 40 55.17 | -26 55 31.4 | 00 43 22.76 | -26 39 06.1 | 0.999 | 17.40 | SGP | aaObvious candidate. Observed in 1991 November but not included in Paper VI due to book keeping error. See also Cristiani et al. (1995) |
| B0049-3024 | 00 49 43.78 | -30 24 12.4 | 00 52 08.94 | -30 07 54.8 | 0.471 | 17.75 | SGP | bbObvious candidate. Not observed due to erroneous information, via Private Communication, that objects was a star. Redshift from Cristiani et al. (1995) |
| B0052+0148 | 00 52 55.70 | +01 48 13.7 | 00 55 29.99 | +02 04 28.1 | 0.595 | 18.66 | F826 | |
| B0059-2853 | 00 59 10.62 | -28 53 37.6 | 01 01 34.83 | -28 37 29.9 | 0.620 | 18.44 | SGP | ccCandidate. Redshift from Warren et al. (1991) |
| B0303-0132B | 03 03 16.80 | -01 32 16.4 | 03 05 49.35 | -01 20 41.9 | 0.604 | 17.93 | F832 | |
| B0110-0012 | 01 10 21.20 | -00 12 40.7 | 01 12 54.93 | +00 03 13.0 | 0.235 | 18.19 | F826 | |
| B1027-0149 | 10 27 13.99 | -01 49 29.1 | 10 29 46.86 | -02 04 52.6 | 0.755 | 18.33 | F854 | |
| B1217+0945 | 12 17 55.19 | +09 45 06.8 | 12 20 28.01 | +09 28 28.0 | 1.078 | 18.54 | VSW | |
| B1237-0054 | 12 37 25.85 | -00 54 16.6 | 12 39 59.82 | -01 10 44.6 | 0.820 | 18.11 | F861 | ddCandidate. See also Boyle et al. (1990) |
| B1247+0036 | 12 47 56.84 | +00 36 19.4 | 12 50 30.48 | +00 20 00.1 | 1.155 | 18.23 | F861 | eeObvious candidate. Not in Paper VI sample due to book keeping error (in Goldschmidt 1993) |
| B2132-4228 | 21 32 15.07 | -42 28 28.0 | 21 35 25.11 | -42 15 02.8 | 0.569 | 17.18 | F287 | |
| B2132-4516 | 21 32 13.39 | -45 16 50.3 | 21 35 27.17 | -45 03 25.0 | 0.507 | 17.69 | F287 | ffObvious candidate. Redshift from Hawkins and Veron (1995) |
| LBQS Name | R.A. | Dec. | FIRST Source | Separation | Notes | |||||
|---|---|---|---|---|---|---|---|---|---|---|
| (J2000.0) | (J2000.0) | (mJy) | (mJy) | (arcsec) | ||||||
| B2359-0021 | 00 02 22.48 | -00 04 43.4 | 0.810 | 18.56 | J000222.4-000443 | 3.89 | 0.151 | 0.1 | 1.23 | |
| B0002-0149 | 00 05 07.06 | -01 32 45.2 | 1.710 | 18.72 | J000507.0-013245 | 63.87 | 0.145 | 0.1 | 2.42 | |
| B0004+0036 | 00 07 10.00 | +00 53 28.9 | 0.317 | 17.79 | J000710.0+005328 | 1.44 | 0.115 | 0.4 | 0.56 | |
| B0009-0148 | 00 12 14.83 | -01 31 28.7 | 1.072 | 17.77 | J001214.8-013128 | 1.08 | 0.149 | 0.4 | 0.33 | nsnsClassified as a non–stellar source on the UKST direct plate |
| B0012-0016 | 00 14 44.03 | -00 00 18.6 | 1.559 | 18.21 | J001444.0-000017 | 1.51 | 0.138 | 0.9 | 0.60 | |
| B0012-0024 | 00 15 07.00 | -00 08 00.9 | 1.701 | 18.65 | J001507.0-000800 | 13.53 | 0.151 | 0.3 | 1.72 | |
| B0019+0022A | 00 21 41.04 | +00 38 41.5 | 0.314 | 18.64 | J002141.0+003841 | 1.38 | 0.171 | 0.2 | 0.88 | |
| B0020-0202 | 00 22 44.30 | -01 45 51.0 | 0.691 | 18.37 | J002244.2-014551 | 9.48 | 0.152 | 0.0 | 1.55 | |
| B0021-0100 | 00 24 11.66 | -00 43 47.8 | 0.771 | 18.18 | J002411.6-004349 | 0.99 | 0.143 | 1.4 | 0.49 | |
| B0024+0020 | 00 27 17.38 | +00 37 23.2 | 1.228 | 17.97 | J002717.3+003723 | 3.73 | 0.152 | 0.7 | 0.93 | |
| B0029-0152 | 00 31 36.48 | -01 36 21.6 | 2.383 | 18.65 | J003136.4-013622 | 14.06 | 0.138 | 0.4 | 1.69 | |
| B0048+0025 | 00 51 30.48 | +00 41 50.0 | 1.188 | 18.16 | J005130.4+004149 | 13.78 | 0.152 | 0.2 | 1.58 | |
| B0049+0019A | 00 52 05.55 | +00 35 38.2 | 0.399 | 16.46 | J005205.5+003538 | 87.95 | 0.140 | 0.2 | 1.80 | |
| B0052-0015 | 00 54 41.22 | +00 01 10.5 | 0.648 | 17.72 | J005441.1+000110 | 2.69 | 0.145 | 0.6 | 0.75 | nsnsClassified as a non–stellar source on the UKST direct plate |
| B0056-0009 | 00 59 05.52 | +00 06 51.4 | 0.717 | 17.73 | J005905.5+000651 | 2415.95 | 0.409 | 0.3 | 3.70 | |
| B0059-0206 | 01 02 05.60 | -01 50 38.5 | 1.321 | 18.00 | J010205.6-015038 | 1.81 | 0.150 | 0.4 | 0.62 | |
| B0107-0235 | 01 10 13.17 | -02 19 52.5 | 0.958 | 18.11 | J011013.2-021950 | 147.45 | 0.138 | 2.0 | 2.61 | |
| B0249+0044 | 02 51 56.30 | +00 57 06.6 | 0.470 | 18.46 | J025156.3+005706 | 8.14 | 0.150 | 0.3 | 1.55 | nsnsClassified as a non–stellar source on the UKST direct plate |
| B0251-0001 | 02 53 40.93 | +00 11 10.0 | 1.682 | 18.36 | J025340.9+001110 | 7.64 | 0.149 | 0.5 | 1.36 | |
| B0256-0206 | 02 58 38.06 | -01 54 10.7 | 0.406 | 18.46 | J025838.0-015411 | 1.14 | 0.131 | 0.7 | 0.71 | |
| B0256-0000 | 02 59 05.66 | +00 11 22.3 | 3.364 | 18.22 | J025905.6+001122 | 2.59 | 0.141 | 0.7 | 0.72 | |
| B0256-0031 | 02 59 28.54 | -00 19 59.7 | 1.995 | 17.59 | J025928.5-001959 | 224.97 | 0.275 | 0.4 | 2.49 | |
| J025927.9-002004 | 9.63 | 0.275 | 9.8 | |||||||
| J025929.0-001956 | 12.69 | 0.276 | 8.4 | |||||||
| B0257+0025 | 02 59 37.48 | +00 37 36.5 | 0.532 | 16.81 | J025937.4+003735 | 0.78 | 0.152 | 0.7 | -0.13 | |
| B1012+0213 | 10 15 15.67 | +01 58 52.8 | 1.378 | 17.63 | J101515.5+015851 | 213.47 | 0.161 | 2.6 | 2.54 | NNOptical–radio separation arcsec. Object not included in LBQS–FIRST statistical sample. |
| J101516.0+015852 | 516.70 | 0.161 | 5.1 | |||||||
| B1013+0124 | 10 15 57.08 | +01 09 13.6 | 0.779 | 16.62 | J101557.0+010913 | 132.66 | 0.147 | 0.4 | 1.99 | |
| B1015+0147 | 10 17 42.40 | +01 32 17.2 | 1.455 | 18.30 | J101742.3+013217 | 6.33 | 0.154 | 0.4 | 1.27 | |
| B1016-0248 | 10 19 00.86 | -03 03 50.3 | 0.717 | 18.46 | J101900.8-030350 | 3.29 | 0.156 | 0.2 | 1.13 | |
| B1017-0009 | 10 19 56.77 | -00 24 10.0 | 1.127 | 17.50 | J101956.7-002409 | 8.05 | 0.156 | 0.4 | 1.09 | |
| B1025+0145 | 10 28 15.96 | +01 30 06.5 | 1.055 | 18.39 | J102815.8+013006 | 69.79 | 0.136 | 2.0 | 2.39 | |
| B1026-0045B | 10 28 37.02 | -01 00 27.4 | 1.530 | 18.42 | J102837.0-010027 | 156.41 | 0.144 | 0.2 | 2.70 | |
| B1130+0032 | 11 33 03.00 | +00 15 48.8 | 1.173 | 18.62 | J113303.0+001548 | 224.21 | 0.149 | 0.7 | 2.97 | |
| B1137-0048 | 11 40 04.35 | -01 05 27.5 | 0.347 | 18.00 | J114004.3-010527 | 9.73 | 0.142 | 0.2 | 1.47 | |
| B1137+0110 | 11 40 16.70 | +00 53 51.4 | 1.138 | 18.20 | J114016.7+005351 | 160.30 | 0.388 | 0.5 | 2.66 | |
| B1138+0003 | 11 41 17.64 | -00 12 50.4 | 0.500 | 17.90 | J114117.6-001250 | 16.73 | 0.153 | 0.3 | 1.64 | |
| B1148-0007 | 11 50 43.88 | -00 23 54.5 | 1.976 | 17.25 | J115043.8-002354 | 2816.39 | 0.635 | 0.6 | 3.46 | |
| J115044.1-002354 | 58.78 | 0.635 | 4.1 | |||||||
| B1148-0033 | 11 50 52.29 | -00 50 16.5 | 0.800 | 17.69 | J115052.2-005016 | 0.99 | 0.164 | 0.7 | 0.29 | |
| B1229-0207 | 12 32 00.03 | -02 24 04.8 | 1.045 | 17.65 | J123159.9-022405 | 1381.17 | 0.172 | 1.2 | 3.39 | |
| B1230-0015 | 12 33 04.02 | -00 31 34.2 | 0.470 | 17.00 | J123304.0-003134 | 75.67 | 0.141 | 0.5 | 1.94 | |
| B1234-0212 | 12 36 39.87 | -02 28 35.9 | 0.305 | 18.01 | J123639.8-022836 | 1.16 | 0.152 | 0.7 | 0.55 | |
| B1236-0043 | 12 38 56.12 | -00 59 30.9 | 1.843 | 18.46 | J123856.1-005930 | 14.04 | 0.145 | 0.2 | 1.65 | |
| B1240+0224 | 12 42 47.17 | +02 08 17.4 | 0.790 | 17.92 | J124247.1+020816 | 15.56 | 0.154 | 1.3 | 1.58 | |
| B1243-0026 | 12 46 13.12 | -00 42 33.0 | 0.644 | 17.00 | J124613.1-004232 | 2.15 | 0.140 | 0.4 | 0.37 | |
| B1308-0111 | 13 10 55.58 | -01 27 25.3 | 1.004 | 18.71 | J131055.5-012724 | 4.56 | 0.142 | 0.5 | 1.34 | |
| B1308+0051 | 13 11 06.46 | +00 35 10.1 | ? | 18.65 | J131106.4+003510 | 22.75 | 0.151 | 0.1 | 2.04 | aaBL Lac candidate without confirmed redshift. Redshift z=0.75 adopted in calculation of |
| B1308-0214 | 13 11 14.92 | -02 30 46.0 | 2.885 | 18.68 | J131114.9-023045 | 55.40 | 0.155 | 0.4 | 2.26 | |
| B1308+0109 | 13 11 21.15 | +00 53 19.6 | 1.075 | 18.07 | J131121.1+005319 | 144.57 | 0.156 | 0.5 | 2.57 | |
| B1310+0216 | 13 13 30.12 | +02 01 05.5 | ? | 18.60 | J131330.1+020105 | 52.89 | 0.139 | 0.3 | 2.39 | aaBL Lac candidate without confirmed redshift. Redshift z=0.75 adopted in calculation of |
| B1313-0142 | 13 15 38.71 | -01 58 46.0 | 1.498 | 18.79 | J131538.5-015846 | 113.11 | 0.157 | 3.2 | 2.71 | NNOptical–radio separation arcsec. Object not included in LBQS–FIRST statistical sample. |
| J131539.0-015845 | 155.44 | 0.157 | 4.5 | |||||||
| B1313+0107 | 13 16 30.46 | +00 51 25.5 | 2.393 | 18.13 | J131630.4+005125 | 2.20 | 0.135 | 0.1 | 0.67 | |
| B1314-0216 | 13 17 26.12 | -02 31 50.6 | 1.090 | 18.52 | J131726.1-023150 | 22.04 | 0.149 | 0.4 | 1.93 | |
| B1317-0033 | 13 19 38.76 | -00 49 39.6 | 0.892 | 18.21 | J131938.7-004939 | 1536.50 | 0.422 | 0.6 | 3.68 | |
| B1317-0142 | 13 19 50.35 | -01 58 03.7 | 0.225 | 17.26 | J131950.3-015803 | 1.38 | 0.138 | 0.3 | 0.34 | |
| B1319+0039 | 13 21 39.57 | +00 23 57.9 | 1.619 | 17.89 | J132139.7+002356 | 179.01 | 0.148 | 3.0 | 2.54 | NNOptical–radio separation arcsec. Object not included in LBQS–FIRST statistical sample. |
| B1323-0248 | 13 26 15.16 | -03 03 57.9 | 2.120 | 17.36 | J132615.1-030357 | 5.48 | 0.155 | 0.6 | 0.78 | |
| B1324+0039 | 13 27 12.84 | +00 24 14.4 | 1.061 | 18.22 | J132712.8+002414 | 84.27 | 0.136 | 0.6 | 2.40 | |
| B1325+0027 | 13 27 50.43 | +00 11 57.0 | 2.534 | 18.72 | J132750.4+001156 | 24.99 | 0.147 | 0.7 | 1.96 | |
| B1331-0108 | 13 34 28.05 | -01 23 48.8 | 1.881 | 17.87 | J133428.0-012349 | 2.99 | 0.144 | 0.3 | 0.74 | |
| B1331-0123 | 13 34 33.23 | -01 38 25.2 | 0.290 | 18.32 | J133433.2-013825 | 1.80 | 0.145 | 0.6 | 0.87 | nsnsClassified as a non–stellar source on the UKST direct plate |
| B1332-0045 | 13 35 26.00 | -01 00 28.3 | 0.672 | 17.41 | J133526.0-010026 | 1.00 | 0.152 | 1.7 | 0.20 | |
| B1335+0222 | 13 37 39.65 | +02 06 57.1 | 1.354 | 18.36 | J133739.6+020657 | 194.94 | 0.151 | 0.3 | 2.79 | |
| B1338-0038 | 13 41 13.93 | -00 53 15.1 | 0.236 | 17.91 | J134113.9-005314 | 5.35 | 0.153 | 0.3 | 1.19 | |
| B1429-0053 | 14 32 29.27 | -01 06 16.2 | 2.078 | 17.68 | J143229.3-010614 | 0.93 | 0.161 | 1.6 | 0.14 | |
| B1430-0046 | 14 32 44.41 | -00 59 15.3 | 1.023 | 17.75 | J143244.4-005914 | 16.53 | 0.145 | 1.0 | 1.51 | |
| B1438+0210 | 14 40 59.48 | +01 57 44.2 | 0.797 | 18.37 | J144059.4+015743 | 214.21 | 0.142 | 0.3 | 2.90 | |
| B1443-0100 | 14 45 59.51 | -01 13 17.3 | 1.794 | 18.30 | J144559.5-011317 | 2.79 | 0.154 | 1.3 | 0.89 | |
| B1446-0035 | 14 49 30.51 | -00 47 46.0 | 0.254 | 18.07 | J144930.5-004745 | 2.36 | 0.145 | 0.5 | 0.90 | nsnsClassified as a non–stellar source on the UKST direct plate |
| B2231-0048 | 22 33 59.96 | -00 33 15.3 | 1.209 | 17.57 | J223400.0-003315 | 1.03 | 0.145 | 1.2 | 0.21 | |
| B2235+0054 | 22 37 34.17 | +01 10 34.6 | 0.529 | 18.55 | J223734.1+011035 | 1.14 | 0.136 | 1.1 | 0.73 | |
| B2245-0055 | 22 47 39.31 | -00 39 52.6 | 0.801 | 17.43 | J224739.3-003953 | 1.58 | 0.155 | 1.1 | 0.39 | |
| B2351-0036 | 23 54 09.16 | -00 19 48.1 | 0.460 | 18.47 | J235409.1-001947 | 346.10 | 0.140 | 0.5 | 3.19 |
| R.A. | Dec. | FIRST Source | Separation | LBQS Sp. | Class Sp. | Source | ||||
|---|---|---|---|---|---|---|---|---|---|---|
| (J2000.0) | (J2000.0) | (mJy) | (mJy) | (arcsec) | ||||||
| 00 13 01.28 | -00 27 12.3 | 18.24 | J001301.3-002714 | 3.58 | 0.151 | 2.1 | Star | Becker | ||
| 00 13 56.17 | -01 42 29.8 | 16.35 | J001356.2-014229 | 6.08 | 0.150 | 1.9 | Star | Becker | ||
| 00 17 01.43 | -00 13 09.7 | 17.75 | J001701.3-001308 | 2.04 | 0.189 | 1.7 | Star | Becker | ||
| 01 03 52.47 | +00 37 39.9 | 17.54 | J010352.4+003739 | 2.22 | 0.143 | 0.2 | Quasar | 0.704 | Becker | |
| 03 06 56.29 | +00 44 31.5 | 16.72 | J030656.2+004431 | 0.79 | 0.143 | 0.7 | Star | Becker | ||
| 10 22 43.73 | -01 13 02.1 | 16.54 | J102243.7-011302 | 37.96 | 0.183 | 0.2 | QSO? | BL Lac | LBQS | |
| 10 32 42.44 | +02 02 28.9 | 18.67 | J103242.5+020229 | 1.73 | 0.148 | 1.4 | QSO? | Quasar | 0.537 | Keck |
| 11 43 54.02 | +01 13 43.3 | 17.54 | J114354.0+011343 | 0.80 | 0.162 | 0.5 | QSO? | Quasar | 1.282 | Keck |
| 11 46 31.44 | -02 20 42.4 | 15.99 | J114631.3-022042 | 1.38 | 0.141 | 1.1 | Star | Keck | ||
| 12 40 35.84 | -00 29 19.6 | 17.74 | J124035.7-002920 | 1.29 | 0.150 | 1.9 | AGN | 0.081 | Keck | |
| 12 50 06.82 | +01 58 03.8 | 18.45 | J125006.8+015803 | 155.93 | 0.153 | 0.7 | QSO? | Quasar | 0.941 | Keck |
| 13 13 27.48 | -02 32 32.8 | 18.03 | J131327.4-023232 | 1.67 | 0.148 | 0.2 | QSO?? | AGN | 0.174 | Keck |
| 13 16 37.25 | -00 36 35.8 | 18.37 | J131637.2-003635 | 1.94 | 0.135 | 0.3 | QSO?? | Quasar | 0.895 | Keck |
| 13 22 11.94 | +01 30 34.5 | 17.58 | J132211.9+013034 | 1.01 | 0.135 | 0.3 | QSO?? | AGN | 0.190 | LBQS |
| 13 33 56.01 | +00 12 29.1 | 17.64 | J133356.0+001229 | 2.07 | 0.141 | 0.9 | QSO? | Quasar | 0.918 | Keck |
| 13 36 16.84 | -00 15 14.2 | 16.61 | J133616.8-001515 | 65.68 | 0.152 | 1.6 | Star | Keck | ||
| 14 38 06.79 | +00 32 20.1 | 18.33 | J143806.7+003220 | 2.30 | 0.152 | 0.7 | AGN | 0.209 | Keck | |
| 14 50 13.18 | +00 35 35.3 | 18.01 | J145013.1+003535 | 8.16 | 0.151 | 0.9 | Star | Keck | ||
| 22 37 23.97 | -00 09 53.3 | 16.79 | J223724.0-000953 | 9.54 | 0.135 | 1.8 | Star | Becker | ||
| 22 43 53.32 | +00 03 18.8 | 17.99 | J224353.1+000318 | 4.34 | 0.149 | 1.8 | Star | MMT | ||
| 22 51 21.11 | +01 24 13.1 | 17.95 | J225121.1+012414 | 1.14 | 0.149 | 1.5 | Star | Becker |
| R.A. | Dec. | FIRST Source | Separation | Notes | ||||
|---|---|---|---|---|---|---|---|---|
| (J2000.0) | (J2000.0) | (mJy) | (mJy) | (arcsec) | ||||
| 00 02 58.62 | +00 08 30.8 | (16.2) | J000258.5+000830 | 0.84 | 0.146 | 0.7 | 0.090 | MMT |
| 00 03 32.27 | +00 52 58.2 | (16.0) | J000332.2+005257 | 1.42 | 0.130 | 0.7 | ||
| 00 04 58.56 | +00 51 34.5 | (18.1) | J000458.6+005135 | 0.93 | 0.127 | 1.3 | ||
| 00 05 21.22 | -01 32 30.4 | (16.7) | J000521.2-013230 | 1.76 | 0.152 | 0.5 | 0.110 | MMT |
| 00 08 13.22 | -00 57 53.2 | (17.2) | J000813.1-005751 | 2.74 | 0.150 | 1.6 | 0.139 | MMT |
| 00 11 27.08 | +00 09 32.4 | (16.2) | J001127.0+000932 | 0.77 | 0.153 | 0.1 | 0.108 | MMT |
| 00 11 55.47 | +01 14 28.8 | (16.9) | J001155.4+011428 | 4.40 | 0.134 | 0.6 | ||
| 00 12 26.85 | -00 48 19.3 | (16.2) | J001226.8-004819 | 5.31 | 0.139 | 0.3 | 0.073 | aaClements et al. (1996) |
| 00 12 47.57 | +00 47 15.9 | (16.6) | J001247.6+004715 | 5.46 | 0.143 | 1.7 | ||
| 00 15 08.44 | +00 13 16.7 | (17.5) | J001508.4+001315 | 0.72 | 0.154 | 0.9 | ||
| 00 16 13.09 | +00 20 06.4 | (16.1) | J001613.0+002006 | 1.43 | 0.142 | 0.8 | ||
| 00 16 30.41 | +01 22 05.1 | (17.6) | J001630.4+012205 | 2.37 | 0.125 | 0.0 | ||
| 00 20 16.13 | +00 04 46.1 | (17.5) | J002016.1+000445 | 55.02 | 0.203 | 0.3 | ||
| 00 20 43.95 | -00 26 23.7 | (16.5) | J002043.9-002624 | 1.11 | 0.135 | 1.3 | ||
| 00 21 06.47 | -01 39 20.3 | (16.9) | J002106.4-013920 | 1.83 | 0.138 | 0.9 | 0.084 | MMT |
| 00 22 56.88 | +01 15 55.6 | (17.1) | J002256.8+011557 | 2.20 | 0.127 | 1.4 | ||
| 00 23 45.09 | -01 00 29.4 | (16.6) | J002345.0-010029 | 3.01 | 0.145 | 0.6 | 0.067 | aaClements et al. (1996) |
| 00 25 02.85 | -02 14 46.3 | (17.7) | J002502.8-021445 | 13.08 | 0.148 | 0.4 | ||
| 00 25 26.33 | -00 55 12.5 | (17.4) | J002526.3-005512 | 4.48 | 0.148 | 0.5 | 0.139 | MMT |
| 00 26 48.40 | +01 17 37.7 | (17.3) | J002648.3+011737 | 2.10 | 0.133 | 0.3 | ||
| 00 28 33.41 | +00 55 10.8 | (16.6) | J002833.4+005511 | 237.22 | 0.115 | 0.3 | 0.105 | bbWills and Wills (1974) |
| 00 29 29.54 | -00 09 13.1 | (17.7) | J002929.5-000911 | 1.06 | 0.164 | 1.5 | 0.168 | MMT |
| 00 32 30.92 | -00 24 40.1 | (16.1) | J003230.9-002440 | 27.74 | 0.141 | 0.1 | 0.081 | MMT |
| 00 50 59.37 | -00 14 54.0 | (16.4) | J005059.4-001453 | 2.95 | 0.147 | 0.7 | 0.135 | MMT |
| 00 52 52.38 | -00 04 27.7 | (16.1) | J005252.3-000426 | 1.64 | 0.146 | 1.1 | 0.120 | ccSuntzeff et al. (1996) |
| 00 53 25.47 | -02 12 29.8 | (17.5) | J005325.4-021231 | 3.00 | 0.145 | 1.6 | 0.117 | MMT |
| 00 55 28.82 | +00 34 52.5 | (16.1) | J005528.8+003452 | 1.44 | 0.134 | 0.5 | ||
| 00 55 38.31 | -02 11 27.1 | (16.7) | J005538.3-021127 | 3.12 | 0.157 | 0.4 | ||
| 00 56 47.87 | +00 04 26.0 | (17.5) | J005647.8+000427 | 1.43 | 0.137 | 2.0 | 0.116 | MMT |
| 00 59 16.93 | -01 50 17.7 | (17.5) | J005916.9-015017 | 13.38 | 0.163 | 0.1 | ||
| 01 00 32.22 | -02 00 46.3 | (18.0) | J010032.2-020046 | 5.95 | 0.152 | 0.1 | 0.227 | MMT |
| 01 04 00.87 | -00 19 16.9 | (16.1) | J010400.8-001916 | 1.51 | 0.148 | 0.5 | 0.051 | MMT |
| 01 05 25.13 | +00 57 57.6 | (16.4) | J010525.0+005757 | 0.84 | 0.146 | 0.9 | ||
| 01 06 22.65 | +00 58 51.9 | (16.2) | J010622.6+005852 | 1.92 | 0.143 | 0.4 | ||
| 01 06 24.86 | -01 41 47.2 | (17.1) | J010624.9-014147 | 0.53 | 0.139 | 0.5 | ||
| 01 06 40.53 | -00 02 35.4 | (17.0) | J010640.4-000235 | 0.80 | 0.148 | 0.9 | ||
| 01 09 39.02 | +00 59 50.6 | (16.7) | J010939.0+005949 | 1.19 | 0.166 | 0.8 | ||
| 01 10 36.24 | -00 28 06.2 | (16.4) | J011036.2-002805 | 2.49 | 0.149 | 0.6 | 0.110 | MMT |
| 02 55 57.12 | -01 16 39.9 | (17.2) | J025557.2-011639 | 1.51 | 0.153 | 1.7 | 0.080 | MMT |
| 03 00 15.98 | +01 18 50.6 | (17.6) | J030015.9+011850 | 1.46 | 0.141 | 0.5 | 0.155 | MMT |
| 03 03 26.86 | -02 02 10.3 | (16.3) | J030326.8-020209 | 3.62 | 0.146 | 0.8 | 0.119 | MMT |
| 03 03 35.01 | +00 44 40.0 | (17.7) | J030335.0+004439 | 1.06 | 0.149 | 1.1 | ||
| 03 08 32.68 | -02 15 28.8 | (16.5) | J030832.6-021529 | 2.31 | 0.151 | 0.7 | 0.121 | MMT |
| 03 09 15.57 | +00 25 08.3 | (16.2) | J030915.5+002508 | 2.82 | 0.132 | 0.8 | ||
| 03 09 48.07 | -02 16 02.5 | (17.3) | J030948.0-021603 | 4.61 | 0.153 | 1.0 | 0.107 | MMT |
| 10 10 44.51 | +00 43 31.7 | (16.5) | J101044.5+004331 | 0.77 | 0.139 | 0.7 | 0.180 | LBQS |
| 10 11 41.08 | -01 50 44.2 | (17.7) | J101141.1-015043 | 0.74 | 0.152 | 1.4 | ||
| 10 12 02.08 | +00 52 52.4 | (18.0) | J101202.1+005251 | 1.08 | 0.136 | 1.4 | 0.123 | 2dFGRS |
| 10 15 32.75 | -00 45 28.4 | (16.1) | J101532.7-004528 | 1.57 | 0.152 | 0.2 | 0.063 | 2dFGRS |
| 10 15 36.25 | +00 54 59.3 | (17.1) | J101536.2+005458 | 2.50 | 0.151 | 0.7 | 0.121 | 2dFGRS |
| 10 16 15.92 | -03 02 46.2 | (16.7) | J101615.9-030246 | 0.80 | 0.156 | 0.4 | 0.158 | 2dFGRS |
| 10 17 17.94 | +01 06 56.6 | (17.9) | J101717.9+010656 | 0.82 | 0.154 | 0.4 | 0.078 | 2dFGRS |
| 10 17 33.23 | -00 01 45.5 | (16.3) | J101733.2-000145 | 2.19 | 0.139 | 0.4 | ||
| 10 20 18.32 | +01 27 11.3 | (17.2) | J102018.3+012712 | 0.93 | 0.153 | 1.0 | 0.115 | 2dFGRS |
| 10 21 00.09 | +00 07 50.9 | (17.2) | J102100.0+000751 | 5.15 | 0.142 | 0.4 | 0.112 | 2dFGRS |
| 10 21 08.22 | -00 51 19.1 | (16.4) | J102108.1-005119 | 1.13 | 0.142 | 1.1 | ||
| 10 22 17.84 | -01 55 59.3 | (17.7) | J102217.8-015559 | 2.92 | 0.144 | 0.5 | ||
| 10 23 09.04 | -01 55 37.8 | (16.5) | J102309.0-015538 | 8.83 | 0.155 | 0.8 | ||
| 10 24 01.47 | +00 00 38.8 | (16.5) | J102401.5+000039 | 6.01 | 0.132 | 0.7 | 0.127 | 2dFGRS |
| 10 24 27.48 | -02 53 20.9 | (16.8) | J102427.5-025321 | 2.97 | 0.151 | 0.6 | 0.164 | ddShectman et al. (1996) |
| 10 26 07.01 | +01 31 45.4 | (18.2) | J102607.0+013145 | 26.17 | 0.144 | 0.8 | ||
| 10 26 35.17 | -00 01 58.0 | (17.5) | J102635.2-000157 | 1.41 | 0.141 | 1.0 | 0.110 | 2dFGRS |
| 10 27 23.27 | -02 32 28.8 | (18.3) | J102723.2-023227 | 16.30 | 0.143 | 0.9 | ||
| 10 27 35.27 | -02 16 12.7 | (18.2) | J102735.3-021612 | 4.06 | 0.152 | 0.5 | 0.218 | 2dFGRS |
| 10 28 18.60 | -01 22 07.8 | (16.0) | J102818.6-012208 | 0.71 | 0.176 | 1.3 | 0.127 | 2dFGRS |
| 10 31 56.77 | +01 30 45.3 | (17.2) | J103156.8+013046 | 7.98 | 0.138 | 1.1 | ||
| 11 30 34.67 | +00 52 51.3 | (16.8) | J113034.6+005251 | 7.83 | 0.148 | 0.6 | ||
| 11 31 22.66 | +01 08 05.9 | (17.2) | J113122.6+010805 | 15.81 | 0.139 | 0.5 | ||
| 11 32 37.03 | +01 49 14.8 | (17.1) | J113236.9+014914 | 0.85 | 0.143 | 0.4 | ||
| 11 32 38.83 | -01 31 48.7 | (17.0) | J113238.8-013147 | 1.86 | 0.156 | 1.0 | 0.100 | 2dFGRS |
| 11 32 52.17 | +01 18 28.2 | (17.6) | J113252.1+011830 | 1.74 | 0.138 | 1.8 | ||
| 11 32 58.74 | +00 55 28.3 | (17.1) | J113258.7+005528 | 2.97 | 0.141 | 0.3 | ||
| 11 37 45.33 | -02 51 53.9 | (16.1) | J113745.2-025152 | 2.60 | 0.141 | 2.0 | ||
| 11 39 41.62 | -01 04 59.7 | (16.8) | J113941.5-010500 | 68.85 | 0.155 | 1.0 | ||
| 11 42 36.96 | +01 55 53.4 | (16.7) | J114236.9+015552 | 2.88 | 0.185 | 0.7 | 0.120 | LBQS |
| 11 43 06.72 | +01 01 15.8 | (17.3) | J114306.7+010115 | 3.95 | 0.171 | 0.3 | ||
| 11 43 40.09 | -01 26 27.6 | (17.7) | J114340.1-012628 | 1.25 | 0.140 | 1.0 | 0.124 | 2dFGRS |
| 11 43 43.01 | -02 14 06.7 | (16.5) | J114343.0-021406 | 2.10 | 0.149 | 0.7 | 0.121 | 2dFGRS |
| 11 44 04.80 | -02 02 26.9 | (16.0) | J114404.8-020226 | 1.71 | 0.150 | 0.7 | 0.068 | 2dFGRS |
| 11 44 48.40 | -01 09 30.7 | (16.5) | J114448.4-010930 | 17.98 | 0.148 | 0.6 | ||
| 11 45 13.87 | -02 59 39.1 | (16.6) | J114513.8-025939 | 108.93 | 0.144 | 0.2 | 0.107 | 2dFGRS |
| 12 33 37.65 | -00 22 28.3 | (16.8) | J123337.6-002228 | 0.91 | 0.151 | 0.3 | ||
| 12 35 27.12 | -02 29 02.8 | (16.7) | J123527.1-022903 | 0.64 | 0.150 | 0.4 | 0.081 | 2dFGRS |
| 12 37 12.02 | +02 03 09.3 | (17.4) | J123712.0+020309 | 2.02 | 0.145 | 0.1 | ||
| 12 38 29.90 | -02 28 18.9 | (16.5) | J123829.9-022819 | 0.78 | 0.149 | 0.5 | 0.084 | 2dFGRS |
| 12 38 49.06 | -01 35 55.0 | (17.9) | J123849.1-013553 | 6.87 | 0.145 | 1.6 | ||
| 12 39 51.26 | +01 01 12.7 | (17.3) | J123951.2+010112 | 3.48 | 0.158 | 0.6 | ||
| 12 46 08.66 | -02 25 51.3 | (16.4) | J124608.7-022551 | 1.29 | 0.141 | 0.5 | ||
| 12 46 17.50 | -00 16 57.8 | (16.1) | J124617.4-001657 | 1.06 | 0.139 | 0.5 | 0.127 | 2dFGRS |
| 13 10 42.81 | -01 55 01.3 | (16.4) | J131042.7-015500 | 3.90 | 0.140 | 0.6 | 0.082 | Keck |
| 13 11 40.29 | -02 04 22.3 | (17.4) | J131140.2-020420 | 1.56 | 0.144 | 1.6 | 0.082 | Keck |
| 13 16 44.95 | +00 23 13.5 | (16.9) | J131644.8+002312 | 0.86 | 0.147 | 1.2 | 0.160 | Keck |
| 13 17 49.71 | -01 19 04.8 | (17.9) | J131749.6-011906 | 1.36 | 0.136 | 1.9 | 0.079 | Keck |
| 13 19 29.86 | -01 08 43.1 | (17.1) | J131929.8-010843 | 6.04 | 0.570 | 0.1 | 0.140 | Keck |
| 13 20 58.25 | -02 14 15.3 | (16.8) | J132058.2-021415 | 3.22 | 0.139 | 0.0 | 0.094 | Keck |
| 13 21 00.50 | +01 16 09.7 | (17.5) | J132100.4+011609 | 11.08 | 0.138 | 0.0 | 0.148 | Keck |
| 13 21 23.35 | +01 23 29.8 | (16.7) | J132123.3+012329 | 1.05 | 0.145 | 0.6 | 0.136 | Keck |
| 13 21 46.04 | -00 01 51.4 | (16.7) | J132146.0-000151 | 0.86 | 0.153 | 0.5 | 0.155 | Keck |
| 13 21 52.38 | -01 31 45.5 | (16.2) | J132152.4-013145 | 0.72 | 0.146 | 1.2 | 0.101 | Keck |
| 13 22 32.04 | -01 42 50.2 | (16.9) | J132232.0-014250 | 1.64 | 0.150 | 0.6 | 0.084 | Keck |
| 13 24 39.80 | +00 22 16.5 | (16.9) | J132439.8+002216 | 2.90 | 0.151 | 0.2 | 0.109 | Keck |
| 13 25 06.33 | +01 51 44.8 | (16.0) | J132506.2+015145 | 2.85 | 0.141 | 1.0 | 0.058 | 2dFGRS |
| 13 26 32.19 | +00 28 00.8 | (17.5) | J132632.2+002800 | 1.15 | 0.141 | 0.6 | 0.086 | Keck |
| 13 26 56.96 | +01 11 54.8 | (16.6) | J132656.9+011155 | 2.43 | 0.140 | 0.8 | 0.067 | Keck |
| 13 28 32.56 | -02 33 21.2 | (17.6) | J132832.5-023320 | 0.97 | 0.150 | 0.6 | 0.184 | Keck |
| 13 28 34.15 | -01 29 17.5 | (16.6) | J132834.1-012917 | 15.59 | 0.143 | 0.5 | ||
| 13 28 34.40 | -03 07 44.4 | (17.6) | J132834.3-030745 | 8.81 | 0.147 | 0.8 | 0.150 | LBQS |
| 13 28 38.94 | +00 32 53.8 | (16.9) | J132838.9+003253 | 5.06 | 0.140 | 0.3 | 0.105 | 2dFGRS |
| 13 29 23.48 | -03 15 02.5 | (16.2) | J132923.4-031502 | 0.97 | 0.158 | 0.2 | 0.076 | LBQS |
| 13 30 25.41 | +01 29 41.1 | (16.1) | J133025.4+012941 | 1.23 | 0.154 | 0.8 | 0.083 | Keck |
| 13 31 55.14 | -02 51 45.0 | (16.9) | J133155.1-025143 | 1.92 | 0.144 | 1.5 | 0.084 | ddShectman et al. (1996) |
| 13 34 50.44 | +01 02 18.7 | (18.2) | J133450.4+010220 | 1.70 | 0.140 | 1.5 | 0.246 | Keck |
| 13 35 48.04 | -03 04 02.7 | (17.5) | J133548.0-030402 | 1.95 | 0.140 | 0.4 | 0.113 | Keck |
| 13 38 22.59 | +02 16 47.6 | (16.1) | J133822.5+021649 | 3.16 | 0.151 | 1.7 | 0.111 | Keck |
| 13 38 30.72 | -00 42 05.7 | (16.1) | J133830.7-004205 | 1.97 | 0.154 | 0.3 | 0.072 | Keck |
| 13 41 01.66 | -00 42 44.2 | (18.0) | J134101.6-004245 | 0.81 | 0.148 | 0.9 | 0.113 | Keck |
| 13 42 12.21 | -00 17 37.7 | (16.1) | J134212.2-001737 | 1.50 | 0.146 | 0.1 | 0.087 | 2dFGRS |
| 13 43 05.89 | +00 48 24.7 | (16.8) | J134305.8+004824 | 2.02 | 0.151 | 0.2 | 0.145 | Keck |
| 13 43 21.33 | -02 52 55.1 | (16.3) | J134321.3-025253 | 1.98 | 0.135 | 1.7 | 0.149 | ddShectman et al. (1996) |
| 13 44 28.33 | +00 01 46.6 | (16.7) | J134428.3+000146 | 8.01 | 0.146 | 0.3 | 0.135 | 2dFGRS |
| 13 45 29.89 | -01 40 02.2 | (16.1) | J134529.9-014003 | 3.98 | 0.145 | 1.1 | 0.088 | Keck |
| 13 46 29.43 | +02 09 39.0 | (16.3) | J134629.4+020939 | 31.21 | 0.152 | 0.2 | 0.138 | Keck |
| 13 49 28.08 | -00 45 07.5 | (16.3) | J134928.0-004508 | 0.75 | 0.142 | 0.9 | 0.143 | Keck |
| 13 50 02.05 | +00 01 51.4 | (17.6) | J135002.0+000152 | 1.67 | 0.156 | 0.8 | 0.203 | 2dFGRS |
| 14 32 09.60 | -02 11 36.2 | (17.2) | J143209.6-021136 | 46.30 | 0.157 | 0.2 | 0.123 | 2dFGRS |
| 14 32 37.23 | +01 20 51.0 | (17.3) | J143237.2+012050 | 3.09 | 0.142 | 0.3 | 0.138 | Keck |
| 14 33 28.36 | -00 02 01.5 | 16.6 | J143328.4-000202 | 2.85 | 0.139 | 1.1 | Star | Keck |
| 14 35 27.71 | +02 19 40.2 | (16.8) | J143527.7+021939 | 1.46 | 0.155 | 0.3 | 0.084 | Keck |
| 14 35 46.97 | +02 01 55.1 | (17.1) | J143546.9+020154 | 0.79 | 0.146 | 0.4 | 0.120 | Keck |
| 14 36 33.54 | -02 04 16.4 | (17.0) | J143633.5-020416 | 10.80 | 0.149 | 0.6 | 0.133 | Keck |
| 14 37 43.38 | -00 27 45.8 | (17.1) | J143743.3-002746 | 2.30 | 0.154 | 1.0 | 0.141 | 2dFGRS |
| 14 38 37.80 | -00 22 50.0 | 18.2 | J143837.8-002251 | 1.27 | 0.143 | 1.9 | Star | Keck |
| 14 39 19.04 | +00 38 19.4 | (16.7) | J143919.0+003819 | 14.22 | 0.157 | 0.4 | 0.151 | Keck |
| 14 40 14.62 | -02 46 09.8 | (16.8) | J144014.6-024609 | 3.35 | 0.138 | 0.3 | 0.130 | 2dFGRS |
| 14 47 07.50 | -02 08 44.8 | (16.3) | J144707.5-020845 | 2.79 | 0.156 | 0.5 | 0.071 | 2dFGRS |
| 14 47 24.02 | -00 24 11.4 | (16.9) | J144724.0-002411 | 3.36 | 0.163 | 0.8 | 0.175 | 2dFGRS |
| 14 47 26.28 | +00 50 16.1 | (17.0) | J144726.3+005016 | 2.35 | 0.147 | 0.7 | 0.172 | 2dFGRS |
| 14 49 28.61 | -01 16 16.8 | (17.0) | J144928.6-011615 | 40.16 | 0.151 | 1.0 | 0.202 | 2dFGRS |
| 14 50 08.30 | +01 51 59.3 | (16.0) | J145008.3+015200 | 3.86 | 0.148 | 0.9 | 0.113 | Keck |
| 14 52 42.64 | +01 40 59.0 | (17.5) | J145242.7+014059 | 2.77 | 0.151 | 1.5 | 0.150 | Keck |
| 14 53 05.74 | +01 55 01.2 | (17.6) | J145305.7+015501 | 2.58 | 0.150 | 0.9 | 0.098 | Keck |
| 22 31 12.06 | -01 01 11.1 | (17.0) | J223112.0-010111 | 1.38 | 0.138 | 0.5 | ||
| 22 35 36.03 | -00 49 24.6 | (17.3) | J223536.0-004924 | 1.28 | 0.138 | 0.4 | 0.131 | MMT |
| 22 37 29.21 | -00 49 08.5 | (16.1) | J223729.2-004908 | 3.76 | 0.148 | 0.6 | 0.129 | MMT |
| 22 39 18.95 | -01 04 39.9 | (17.9) | J223918.9-010440 | 1.31 | 0.153 | 0.8 | 0.129 | MMT |
| 22 42 12.95 | -01 55 06.7 | (16.7) | J224212.8-015507 | 2.83 | 0.149 | 0.9 | 0.178 | MMT |
| 22 45 54.95 | +00 23 09.6 | (16.3) | J224554.9+002310 | 5.19 | 0.153 | 0.5 | ||
| 22 50 47.05 | -01 41 16.4 | (16.5) | J225047.0-014117 | 16.81 | 0.135 | 1.0 | 0.110 | MMT |
| 22 51 08.55 | -00 53 43.5 | (16.7) | J225108.6-005343 | 1.89 | 0.137 | 1.4 | 0.162 | MMT |
| 22 53 23.56 | +00 38 29.4 | (16.7) | J225323.6+003828 | 0.91 | 0.155 | 1.3 | ||
| 23 54 20.52 | +00 33 26.9 | (16.6) | J235420.5+003327 | 1.00 | 0.175 | 0.9 | ||
| 23 57 21.75 | +00 26 05.8 | (16.1) | J235721.7+002606 | 1.28 | 0.137 | 0.8 | ||
| 23 59 48.54 | -00 04 25.7 | (16.3) | J235948.5-000425 | 1.63 | 0.131 | 0.5 | 0.061 | MMT |
| Name | R.A. | Dec. | FIRST Source | Separation | LBQS Sp. | Class Sp. | |||||
|---|---|---|---|---|---|---|---|---|---|---|---|
| (J2000.0) | (J2000.0) | (mJy) | (mJy) | (arcsec) | |||||||
| J0100-0200 | 01 00 32.22 | -02 00 46.3 | 0.227 | 18.2aamagnitude estimated using peak intensity from APM scan of UKST plate. | J010032.2-020046 | 5.95 | 0.152 | 0.1 | 1.39 | Quasar | |
| J0103+0037 | 01 03 52.47 | +00 37 39.9 | 0.704 | 17.54 | J010352.4+003739 | 2.22 | 0.143 | 0.2 | 0.63 | Quasar | |
| J1022-0113 | 10 22 43.73 | -01 13 2.1 | ? | 16.54 | J102243.7-011302 | 37.96 | 0.183 | 0.2 | 1.46bbBL Lac candidate without confirmed redshift. Redshift z=0.75 adopted in calculation of . | QSO? | BL Lac |
| J1032+0202 | 10 32 42.44 | +02 02 28.9 | 0.537 | 18.67 | J103242.5+020229 | 1.73 | 0.148 | 1.4 | 1.00 | QSO? | Quasar |
| J1143+0113 | 11 43 54.02 | +01 13 43.3 | 1.282 | 17.54 | J114354.0+011343 | 0.80 | 0.162 | 0.5 | 0.12 | QSO? | Quasar |
| J1250+0158 | 12 50 06.82 | +01 58 03.8 | 0.941 | 18.45 | J125006.8+015803 | 155.93 | 0.153 | 0.7 | 2.81 | QSO? | Quasar |
| J1316-0036 | 13 16 37.25 | -00 36 35.8 | 0.895 | 18.37 | J131637.2-003635 | 1.94 | 0.135 | 0.3 | 0.88 | QSO?? | Quasar |
| J1333+0012 | 13 33 56.01 | +00 12 29.1 | 0.918 | 17.64 | J133356.0+001229 | 2.07 | 0.141 | 0.9 | 0.61 | QSO? | Quasar |
| J1334+0102 | 13 34 50.44 | +01 02 18.7 | 0.246 | 18.2aamagnitude estimated using peak intensity from APM scan of UKST plate. | J133450.4+010220 | 1.70 | 0.140 | 1.5 | 0.85 | Quasar |
| Stellar | Non-Stellar | |
|---|---|---|
| Number of LBQS source catalogue objects: | ||
| Cross-correlation matches with FIRST sources: | 101 | 495 |
| Unprocessable objective prism spectra: | 18 | 115 |
| LBQS/FIRST matches: | 83 | 380 |
| Eliminated due to low peak surface brightness: | 222 | |
| Observed in LBQS (through Paper VI): | 64 | 9 |
| Unobserved matches: | 19 | 149 |
| Predicted number of chance coincidences: | ||
| New Observations | ||
| Keck Spectra: | 11 | 35 |
| MMT Spectra: | 1 | 26 |
| Becker Spectra: | 7 | |
| 2dfGRS Spectra: | 31 | |
| NED Identifications: | 7 | |
| Total : | 19 | 99 |
| New Quasars: | 7aa6 quasars + 1 BL Lac (previously observed but misclassified). | 2 |
| Redshift | Fractional Completeness |
|---|---|
| 0.20 | 0.840 |
| 0.30 - 0.65 | 0.920 |
| 0.70 | 0.865 |
| 0.75 - 0.85 | 0.840 |
| 0.90 | 0.890 |
| 0.95 - 3.00 | 0.920 |
| Magnitude Range | Total | Radio–detected | Fraction |
|---|---|---|---|
| 16.00 - 17.50 | 61 | 12 | 0.20 |
| 17.51 - 18.00 | 114 | 20 | 0.18 |
| 18.01 - 18.25 | 104 | 14 | 0.13 |
| 18.26 - 18.50 | 157 | 16 | 0.10 |
| 18.51 - 18.80 | 143 | 14 | 0.10 |
| Redshift | FBQS Composite | LBQS Composite | ||
|---|---|---|---|---|
| 0.20 | 0.41 | 0.27 | 0.28 | 0.13 |
| 0.25 | 0.52 | 0.36 | 0.36 | 0.18 |
| 0.30 | 0.66 | 0.50 | 0.45 | 0.28 |
| 0.35 | 0.49 | 0.35 | 0.36 | 0.21 |
| 0.40 | 0.36 | 0.24 | 0.27 | 0.14 |
| 0.50 | 0.31 | 0.21 | 0.24 | 0.14 |
| 0.60 | 0.27 | 0.20 | 0.22 | 0.14 |
| 0.70 | 0.35 | 0.30 | 0.32 | 0.26 |
| 0.80 | 0.40 | 0.37 | 0.39 | 0.34 |
| 0.90 | 0.49 | 0.44 | 0.46 | 0.41 |
| 1.00 | 0.54 | 0.47 | 0.51 | 0.43 |
| 1.10 | 0.52 | 0.46 | 0.47 | 0.39 |
| 1.20 | 0.62 | 0.52 | 0.56 | 0.45 |
| 1.30 | 0.72 | 0.59 | 0.67 | 0.53 |
| 1.40 | 0.58 | 0.45 | 0.53 | 0.39 |
| 1.50 | 0.52 | 0.41 | 0.47 | 0.36 |
| 1.60 | 0.51 | 0.42 | 0.47 | 0.38 |
| 1.70 | 0.46 | 0.38 | 0.42 | 0.35 |
| 1.80 | 0.43 | 0.29 | 0.38 | 0.27 |
| 1.90 | 0.40 | 0.21 | 0.36 | 0.20 |
| 2.00 | 0.38 | 0.36 | ||
| 2.10 | 0.34 | 0.35 | ||
| 2.20 | 0.30 | 0.34 | ||
| 2.30 | 0.33 | 0.40 | ||
| 2.40 | 0.39 | 0.48 | ||
| 2.50 | 0.38 | 0.47 | ||
FIGURE CAPTIONS
Spectra of 9 (of 12 in total) new LBQS quasars not included in Paper VI. Most observations were taken through narrow slits so the units on the flux scale are arbitrary.
Spectra of the 9 additional LBQS–FIRST objects. J1022–0113 is a BL Lac object observed as part of the LBQS and mis–identified as a star. The remaining 8 objects were discovered from the cross–correlation of the LBQS and FIRST source catalogues.
Spectrum of J1438+0032 (). The narrow emission lines and the presence of stellar absorption features are consistent with the identification as a Seyfert 2 nucleus.
Distribution of versus redshift for the known LBQS–FIRST objects from Table 2 () and the 9 new LBQS–FIRST objects () from Table 5. The BL Lac object, J1022–0113, has been plotted at redshift .
Distribution of the Half-Power Point (HPP) of the objective–prism spectra for LBQS quasars as a function of redshift. The 67 previously known LBQS–FIRST objects () and the 9 additional LBQS–FIRST objects () are also shown. The horizontal dash–dot line at HPP=0 indicates the boundary of the LBQS colour–selection algorithm; objects faling below the line being defined as of unusually blue colour. The loci of the LBQS and FBQS composite spectra are shown as the solid and dashed lines respectively.
Redshift distribution of FBQS and LBQS quasars. (a): distribution of the 565 FBQS quasars with redshifts and magnitudes from Table 2 of White et al. (2000) (solid line). The distribution of the full LBQS sample, adopting the redshift completeness factors listed in Table 7, over the same redshift range is shown as the dotted line. The LBQS histogram has been normalised to the same total area as the FBQS histogram. (b): the distribution of the 565 FBQS quasars shown in panel (a) is reproduced (solid line) together with associated error bars. The redshift distribution of the LBQS sample limited at is shown as the dotted line, together with associated error bars. The LBQS histogram has been normalised to the same total area as the FBQS histogram and the x–coordinate of the error bars displaced to slightly larger redshifts for clarity.