Modeling the Dust Shell of V4334 Sgr
Abstract
The central star V4334 Sgr (Sakurai’s Nova) of the planetary nebula PN G010.4+04.4 underwent in 1995-1996 the rare event of a very late helium flash. It is only one of two such events during the era of modern astronomy (the second event was V605 Aql = Nova Aql 1919). All other prominent objects of that type originate from events several thousands of years ago (e.g. A30, A78). Hence, only snapshots can be modeled for those objects. V4334 Sgr allows for the first time a dynamic consideration of the formation of the dust shell from the beginning. We present here a model which is able to describe the complete photometric behavior of the object, including the fine structure dips of the optical light curve during the first two years of the mass loss and the dust formation.
1 Introduction
V4334 Sgr, discovered 1996 February 20 (Nakano et al. 1996), was first identified as a nova. The nature of the object has been clarified by Duerbeck & Benetti (1996) as the rare event of a very late helium flash shell burning (Iben et al. 1983; Iben 1984). For a review on this object see Duerbeck et al. (2000). It is only one of two such events during the era of modern astronomy (the second event was V605 Aql = Nova Aql 1919, reviewed by Clayton & de Marco 1997). Older prominent objects of that type, were the event occurred several thousands of years ago, are A30 (Borkowski et al. 1994) and A78 (Kimeswenger et al. 1998). The rapid formation of a dust shell, discovered in March 1997 (Kimeswenger et al. 1997), started in the end of 1996. Several snapshot models of this object were published (Kerber et al. 1998, Kipper , Kipper , Kerber et al. 1999). They all suffer from the fact that a snapshot allows only the use of an average dust formation rate. Thus, they are unable to describe the visual photometry and give only crude estimates for the density distribution and for the mass of the shell. The model we present here only uses the visual light curve to determine the variations of the dust formation rate. It applies a complete dust grain size distribution and transiently heated grains (Koller & Kimeswenger , ). Only the input from the fitting of the visual light curve gives us a complete spectral energy distribution (SED) model, assuming closed spherical geometry.
2 Input Data and Assumptions
A set of data over the whole range of wavelengths
is needed to perform a reliable modeling of the SED.
But the main input is obtained from wavelengths of 0.3 to 15 m.
While there are numerous optical and near infrared (NIR) photometries, there is a lack of
data in the mid infrared range (MIR).
The data used here for the MIR were mainly obtained by our work group
using the ISO satellite (Kerber et al. 1999).
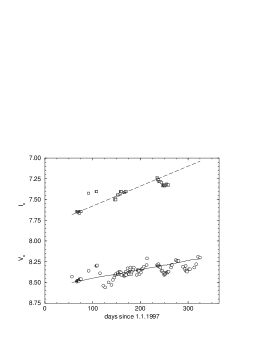
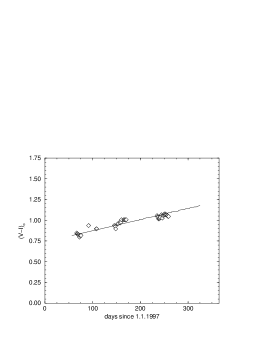
The optical photometry were taken from Duerbeck et al. (1997,
2000) but
corrected for some errors (1997 was shifted by about 60 days in figure 4 in the
2000 paper).
The NIR photometries were taken from Kimeswenger et al.
(1997) and Kamath & Ashok (1999).
We assume spherical geometry of the dust shell and a variation of the dust formation
rate at timescales not faster than 5 days.
The grain size distribution was assumed to be like those found in the
numerical simulations by Gauger et al. (1990) and
Patzer et al. (1998) for winds
of C-rich stars.
For computations the numerical code NILFISC (Koller & Kimeswenger
, ) was used.
A distance and an interstellar foreground extinction has to be assumed.
We used here, employing a weighted average from the literature,
the somehow ”canonical” values of kpc (Kimeswenger 2001, this volume) and
EB-V = 08 (Kerber et al. 2000).
3 The Model
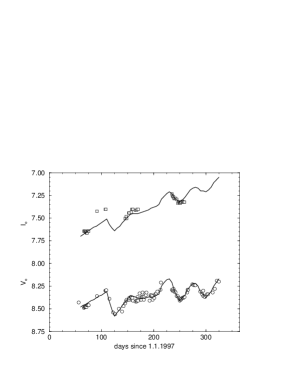
The stellar luminosity is the main input parameter for the dust shell model. As the shell hides the star efficiently since the beginning of 1997, we had to derive it indirectly. We know the effective temperature in 1996 rather well. Later we have lower limits by the excitation of the C2 bands. A change of the effective temperature from 4800 to 6200 K results only in small changes of the model parameters. We assume a continuation of the temperature decline seen in 1996. This results in 6150 K in February and 5700 K in October 1997. In this temperature range V-I and the bolometric correction for giants and supergiants are entirely constant (Bessel 1990). This allows us to derive the increase of the luminosity and the rise of the total shell extinction independently. The visual photometry gives a linear incline of the luminosity with time.
Usually a single expanding shell model is assumed. This model is described by 3 free parameters, the inner and the outer radius and the density at the inner edge. We assume a set of episodic mass loss changes. The main mass loss episode started in August 1996. This is defined by the observations. On the one hand there is the absence of major extinction features in the late 1996. On the other hand there is the dust shell giving the strong IR excess in February 1997. The inner radius of the condensation (respectively the condensation temperature) and the grain size distribution (power law ) is taken from theoretical models for the formation of carbon rich dust in fast stellar winds (Dominik et al. 1993, Patzer et al. 1998, 1999). We assume that the conditions are constant throughout the whole period. This appears reasonable since the physical and chemical environment hardly changed. Thus, the inner radius is directly bound to the stellar luminosity. The dust formation occurs in a relatively small region. A further reprocessing of the dust behind this region is impossible (Dominik et al. 1993) and, therefore, we are fixed to a density law during one outflow episode. If the mass loss rate changes, the shell detaches from the formation region and moves outwards without changing its initial velocity. A new shell is formed inside. This defines strictly the outer radius of the shells. The density (respectively the mass loss rate as function of time) is now the only ”free” parameter to be derived. As shown before, the visual photometry allows us to fit this parameter. A sudden outburst of the mass loss rate leads to ”triangle shaped declines” of the visual light. They peak at the end of the episode and then quickly recover to the normal value. Those ”triangle shaped declines” are typically for the whole light curve of V4334 Sgr in 1997 and 1998. They last always about 15 days. This allows us to model the mass loss rate as a function of time very accurately. In 1997 major outbursts were on days 110, 235 and 280 and a weak but longer one starting on day 155 (45 days long).


Exactly these model inputs, without any further changes, were used to derive complete spectral energy distributions for 3 epochs where ISO measurements are available. The resulting spectral energy distributions fit very well to the data.


These promising results convinced us that the self–consistent access to the problem works. As we derive the optical density along the line of sight from the central star to the observer only, we can’t verify the assumption of spherical geometry with these results. Tests with cylindrical geometries (open at the poles) show that the SED - especially at long wavelengths, can’t be reproduced. We conclude that we have at least a completely closed geometry. The integrated dust mass evolved rapidly and increased by more than a factor of 3 during 1997. The dust formation rate goes nearly linear with the stellar luminosity. This implies the consequence that the dust formation rate is bound to the mass loss rate (respectively the dust to gas ratio is more or less constant). The outer shell radius increased between February 1997 until October 1997 from m to m. Although the stellar luminosity raised by a factor of 2.7, the inner shell radius expanded only from to m. This is significantly below the expected case for thermodynamic equilibrium for dust grains.


4 Conclusions
We showed that a complete dynamic model of the early phase of dust formation of this peculiar object is possible by only applying the optical data to fit the parameters. The only free parameter is the distance to V4334 Sgr. The resulting model is completely self consistent. The dust formation rate increased during 1997 (at an assumed distance of kpc) steadily from to about M⊙/year during this first year. As the dust/gas ratio cannot be determined from measurement in this system, this also cannot be used to derive the total mass loss straight forward. Assuming a gas to dust ratio of 10 - 30, the mass loss would be about M⊙/year which is not unusually high. The extremely carbon rich atmosphere will produce a stellar wind where the nucleation rate per unit mass is much higher than in case of normal abundance. A lower gas to dust ratio than found in the ISM has to be expected. The stellar luminosity increased from about 3000 to about 8000 L⊙. The dust formation rate ( mass loss rate) is correlated about linearly to the stellar luminosity. All the luminosities, provided here, are directly proportional to . The masses are proportional to . With decreasing or increasing the free distance parameter , the derived mass would strongly change, too.
Acknowledgements.
This project was supported by the Austrian FWF project P11675-AST.References
- (1) Bessel M.S. 1990, PASP 102, 1181
- (2) Borkowski K.J., Harrington J.P., Blair, W.P., Bregman J.D. 1994, ApJ 235, 722
- (3) Clayton G.C., deMarco O. 1997, AJ 114, 2679
- (4) Dominik C., Sedlmayr E., Gail H.P. 1993, A&A 277, 578
- (5) Dürbeck H.W., Benetti S. 1996, ApJ 468, L111
- (6) Dürbeck H.W., Benetti S., Gautschy A., et al. 1997, AJ 114, 1657
- (7) Dürbeck H.W., Liller W., Sterken C., et al. 2000, AJ 119, 2360
- (8) Gauger A., Sedlmayr E., Gail H.-P. 1990, A&A 235, 345
- (9) Iben I. 1984, ApJ 277, 333
- (10) Iben I., Kaler J.B., Truran J.W., Renzini R. 1983, ApJ 264, 605
- (11) Kamath U.S., Ashok N.M. 1999, MNRAS 302, 512
- (12) Kerber F., Gratl H., Kimeswenger S., Roth M. 1998, Ap&SS 255, 279
- (13) Kerber F., Blommaert J.A.D.L., Groenewegen M.A.T., et al. 1999, A&A 350, L27
- (14) Kerber F., Palsa R., Köppen J., Blöcker T., Rosa M.R. 2000, The Messenger, 101, 27
- (15) Kimeswenger S., Gratl H., Kerber F., et al. 1997, IAUC 6608
- (16) Kimeswenger S., Kerber F., Weinberger R. 1998, MNRAS 296, 614
- (17) Kipper T. 1999a, IBVS 4707
- (18) Kipper T. 1999b, Baltic Astronomy 8, 483
- (19) Koller J., Kimeswenger S. 2000, ASPConf. Ser. 196, 23
- (20) Koller J., Kimeswenger S. 2000, Ap&SS, in press
- (21) Nakano S., Benetti S., Dürbeck H.W. 1996, IAUC 6322
- (22) Patzer A.B.C., Gauger A., Sedlmayr E. 1998, A&A 337, 847
- (23) Patzer A.B.C., Helling Ch., Winters J.M., Sedlmayr E. 1998, Astron. Ges. Abstr. Ser. 15, P41