The Properties of the Radio-Selected 1Jy Sample of BL Lacertae Objects
Abstract
We present new optical and near-IR spectroscopy as well as new high dynamic range, arcsecond-resolution VLA radio maps of BL Lacs from the complete radio-selected “1 Jansky” (1Jy) sample (RBLs) for which such data were not previously available. Redshift information is now available for all but six of the 37 BL Lacs in the 1Jy sample. Of the 31 with redshift information, four redshifts are only minimum values based upon absorption lines and four other objects have uncertain redshifts based upon the detection of only a single emission line. Unlike BL Lacs from the complete X-ray-selected Einstein Medium Sensitivity Survey (EMSS) sample (XBLs), most RBLs possess weak but moderately luminous emission lines. The emission-line luminosities of RBLs are several orders of magnitude lower than flat-spectrum radio quasars (FSRQs); however, there is significant overlap in the luminosity distributions of the two classes. All but one object in the 1Jy sample has now been observed with the VLA; and extended flux was detected for all but three of the observed objects. Whereas nearly all XBLs have extended power levels consistent with FR–1s, more than half of the RBLs have extended radio power levels too luminous to be beamed FR–1 radio galaxies. In fact, we find evidence for and examples of three distinct mechanisms for creating the BL Lac phenomenon in the 1Jy sample: beamed FR–1s, beamed FR–2s and possibly a few gravitationally-lensed quasars. The determined for the 1Jy sample is , which is markedly different from the negative evolution seen in the EMSS and other XBL samples. A correlation between logarithmic X-ray to radio flux ratio and is observed across the EMSS and 1Jy samples, from negative evolution in the more extreme XBLs to positive evolution in the more extreme RBLs. There is evidence that the selection criteria chosen by Stickel et al. eliminates some BL Lac objects from the 1Jy sample, although how many is unknown. And several objects currently in the sample have exhibited strong emission lines in one or more epochs, suggesting they should be reclassified as FSRQs. However these selection effects cannot account for the observed discrepancy in XBL and RBL properties. From these observational properties we conclude that RBLs and XBLs cannot be related by viewing angle alone, and that RBLs are more closely related to FSRQs.
Subject headings:
BL Lacertae objects — AGN — Unification Models1. Introduction
BL Lacertae objects are an extreme type of Active Galactic Nuclei (AGN), whose hallmark is their “featureless” optical spectra. They are a member of the blazar class; and like other blazars, their observed properties are due largely to bulk relativistic outflows. The characteristic broadband spectral energy distribution (SED) of BL Lac objects and other blazars is double-peaked, with synchrotron radiation dominating at lower energies and a second peak at hard X-ray and -ray energies. The second peak is likely due to inverse-Compton scattering, however other mechanisms are possible (e.g., Mannheim 1998). The overall properties of BL Lacs are still not well known, due in part to the difficulty in obtaining redshifts for many of these objects, but also because detailed studies of complete BL Lac samples have been sparse. For many years there were only two statistically-complete samples of BL Lacs: the X-ray-selected Einstein Medium Sensitivity Survey (EMSS) sample (Morris et al. 1991, hereafter M91; Rector et al. 2000, hereafter R00) and the radio-selected 1Jy sample (Stickel et al. 1991, hereafter S91), each sample containing 40 objects. Since the writing of S91 three objects have been added to the 1Jy sample. New radio and X-ray surveys, e.g., the VLA Faint Images of the Radio Sky at Twenty centimeters (FIRST; Laurent-Muehleisen et al. 1998) and the NRAO VLA Sky Survey (NVSS; Condon et al. 1998), the ROSAT All-Sky Survey (RASS; Nass et al. 1996) and the Deep X-Ray Blazar Survey (DXRBS; Perlman et al. 1998) are now discovering BL Lacs in prodigious numbers. These new surveys are invigorating BL Lac research, however they have not yet been studied in as great detail as the 1Jy and EMSS samples.
The dominant paradigm for BL Lac objects is that they are “highly-beamed” FR–1 (Fanaroff & Riley 1974) radio galaxies which are seen nearly along the line of sight of the relativistic jet (Blandford & Rees 1978; Urry & Padovani 1995). This hypothesis, known as the “unification model,” accounts for many of the observed properties of BL Lacs, e.g., rapidly-varying polarized continuum emission seen at all wavelengths (Angel & Stockman 1980); highly core-dominated kpc-scale radio structure (e.g., Antonucci & Ulvestad 1985; Perlman & Stocke 1994); and compact parsec-scale radio core structure, often exhibiting superluminal motion (Zensus 1989).
Alternatively, Ostriker & Vietri (Ostriker 1989; Ostriker & Vietri 1985, 1990) suggested that BL Lacs may be gravitationally-lensed background quasars. Stars associated with a foreground galaxy could selectively amplify the continuum emission from the compact nucleus relative to the extended emission line regions, thus creating the low- emission-line spectra which is a BL Lac hallmark. This hypothesis has been ruled out as an explanation for all BL Lacs, but it may be an explanation for a few. So far only one proven example of a lensed BL Lac is known, the “smallest Einstein ring” object S4 0218+357 (O’Dea et al. 1992). However, several examples have been noted of BL Lacs which are potentially gravitationally lensed quasars (e.g., Scarpa et al. 1999, Stocke, Wurtz & Perlman 1995, Stickel et al. 1988a,b). A preliminary accounting of the present work given in Stocke & Rector (1997; hereafter SR97) finds evidence for a substantial excess of intervening MgII absorption systems in the 1Jy BL Lac sample when compared to quasars. This result requires a correlation between the nearly featureless spectra of BL Lacs (i.e., low- emission lines) and the presence of foreground absorbing gas. The most obvious interpretation of such a correlation is gravitational lensing, thereby raising the question of the importance of this mechanism for producing BL Lacs in the 1Jy sample.
Historically BL Lacs have been divided into radio-selected (RBLs) and X-ray-selected (XBLs) based upon the method of discovery. Interestingly, optical surveys have not been efficient in discovering BL Lacs; e.g., only 6 have been found in the optical PG survey (Fleming et al. 1993), and other attempts have not been successful (Jannuzi 1990). In recent years this terminology has given way to classification based upon the overall SED. In “low-energy-peaked” blazars (LBLs), the peak of the synchrotron radiation occurs at IR wavelengths, whereas in “high-energy-peaked” blazars (HBLs) this peak occurs in the UV/X-ray, with an approximate dividing line defined by log(), the logarithmic flux density ratio from 1 keV to 5 GHz (e.g., Wurtz et al. 1996). For the most part XBLs are HBLs and RBLs are LBLs, although exceptions do exist (e.g., Mkn 501 is an HBL in the 1Jy sample). New surveys (e.g., the ROSAT-Green Bank sample; Laurent-Muehleisen et al. 1999) are finding BL Lacs intermediate between HBLs and LBLs, indicating a continuum of SEDs in BL Lacs and likely rendering the LBL/HBL terminology obsolete. We choose to retain the term RBL to describe the 1Jy sample because it is a radio-selected sample; neither X-ray emission nor the overall SED is considered in the selection process.
Previous studies of XBLs have shown that their properties are less extreme than RBLs; e.g., XBLs show less extreme optical variability (Jannuzi, Smith & Elston 1993, 1994), lower maximum percentages of optical polarization and less polarization variability with preferred position angles (Jannuzi et al. 1994), less core dominated radio structure (Perlman & Stocke 1993) and significant fractions of starlight in their optical spectra (M91). The unified model therefore was generalized to suggest that XBLs are viewed further from the jet axis than RBLs (e.g., Jannuzi et al. 1994; Perlman & Stocke 1993). Thus, in the unification model, RBLs, XBLs and FR–1s represent the low-luminosity population of radio-loud AGN, with each class seen increasingly further off the jet axis. Similarly, radio-loud quasars are believed to be beamed, high-luminosity FR–2 radio galaxies (e.g., Barthel 1989), wherein steep-spectrum radio quasars (SSRQs) are seen further off-axis than flat-spectrum radio quasars (FSRQs). Alternatively, it has been suggested that the difference lies not in orientation but in the high-energy cutoff in their energy distributions, where XBLs and RBLs represent a single family of objects with a smooth energy distribution followed by a sharp cutoff. For RBLs this cutoff occurs in the near-IR/optical and for XBLs this cutoff is at UV/X-ray energies (Giommi & Padovani 1994; Padovani & Giommi 1995; Sambruna, Maraschi & Urry 1996).
There are important observations that bear upon these hypotheses. First, the values for the 1Jy and EMSS BL Lac samples are different. XBLs show “negative” evolution whereas RBLs evolve “positively” (i.e., greater numbers and/or luminosities in the past), suggesting that RBLs and XBLs are two distinct classes of AGN. The values for XBLs are similar to FR–1s; and the values for RBLs are more like FR–2 galaxies and quasars. However for both samples the value is consistent with a no-evolution result to 2; and prior measurements of the for the 1Jy sample (S91) were based upon incomplete redshift information, raising some doubt as to the validity of the discrepancy. Second, the extended radio structure of some 1Jy RBLs were known to be too luminous to be that of an FR–1 radio galaxy, suggesting that some RBLs are instead beamed FR–2s (Kollgaard et al. 1992). A detailed understanding of the 1Jy RBL sample has been hampered by two major impediments: (1) a lack of high-quality optical spectra for many 1Jy BL Lacs prevented the detection of weak spectral lines and the determination of redshifts, hence their absolute properties; and (2) dynamic range limited VLA observations were unable to detect faint, extended radio flux near the bright core. Without complete sample data both of the aforementioned problems with BL Lac unification remained unverified.
Here we present high-SNR optical and moderate-SNR near-IR spectroscopy as well as high dynamic-range 20cm, A-array VLA maps of BL Lacs from the 1Jy sample of S91 for which emission-line redshifts and faint extended radio structure had not been detected in previous observations. In §2 we present our observations and discuss the data reduction. We also discuss the overall status of observations of the 1Jy sample. In §3 we discuss individual sources and how our observations affect other results for these sources. In §4 we discuss reasons why the 1Jy sample may be incomplete. In §5 we discuss the overall properties of the 1Jy BL Lac sample and compare them to the complete EMSS XBL samples (R00), discussing the impact on unified schemes. In §6 we summarize the conclusions of our work. Throughout this paper we assume a standard cosmology with km s-1 Mpc-1 and .
2. Observations and Reduction
2.1. Optical and Near-IR Spectroscopy
The optical spectroscopy presented here was completed during four observing runs: two at the KPNO 2.1m during 4–7 April 1995 and 18–21 November 1995 and one each at the Multiple Mirror Telescope Observatory (MMTO) 4.5m during 15–16 August 1996 and the upgraded MMTO 6.5m during 22–23 November 2000. The log of observations are shown in Table 1. The columns are: [1] the 1Jy object name; [2] dates of observation; and [3] the SNR (continuum flux density/ RMS) for each spectrum at 5000Å. At the 2.1m we used the “Goldcam” spectrograph with a 300 line mm-1 grating to give a dispersion of 2.4Å pixel-1 and a resolution (FWHM) of 8.4Å with a 2″ slit over the spectral range of 4000-8000Å. At the MMTO 4.5m we used the blue-channel spectrograph, also with a 300 line mm-1 grating, to give a 2.4 Å pixel-1 dispersion and a resolution of 7.4 Å with a 1.25″ slit for a spectral coverage over 3200-7500Å. At the MMTO 6.5m we used the blue-channel spectrograph with the 500 line mm-1 and 800 line mm-1 gratings to achieve higher resolution in the near-UV. The 500 line mm-1 grating gave a 1.2Å pixel-1 dispersion and 3.6Å resolution with a 1.5″ slit for spectral coverage over 3500-6500Å. The 800 line mm-1 grating gave a 0.75Å pixel-1 dispersion and 2.2Å resolution with a 1.5″ slit for spectral coverage over 3200-5200Å. Unfortunately, due to contamination of the MMTO 6.5m primary mirror coating, sensitivity in the near-UV was poor, with a 60% loss of light blueward of 4500Å(Foltz, private communication).
In an effort to improve the flat-fielding and sky subtraction as well as to remove the effects of detector defects, we observed each target at two locations along the slit. Although we achieved excellent removal of telluric absorption features, weak Na “D” absorption is present in most spectra as well as the oxygen absorption bands at varying strengths depending on the object observed. Also, weak “emission” bumps just blueward of telluric absorption features are common. Features caused by imperfect telluric correction are marked.
The spectra were extracted with IRAF111IRAF is distributed by NOAO, which is operated by AURA, Inc., under contract to the National Science Foundation. using the optimal extraction routines. The error in the wavelength calibration is Å from 4000Å to 9000Å. The solution is slightly poorer at shorter wavelengths. Flux calibration was performed using observations of flux standards at similar airmass. No correction was made for the loss of light at the slit; thus the derived flux density values are probably uncertain by a factor of 2. Most objects were observed on multiple runs. These spectra were not combined but rather were used to confirm any features detected.
The flux calibration of the KPNO 2.1m spectra suffer from the presence of second-order blue light redward of 7000Å, causing an incorrect continuum slope redward of 6500Å. Our attempts to correct for the order overlap introduced small-scale artifacts that could have been misinterpreted as real spectral features; thus we present the uncorrected spectra in Figure 1. Many of these spectra also suffer from poor flux calibration blueward of Å. Thus the detailed spectral slopes of the 2.1m spectra should not be trusted. The MMTO 6.5m spectra also suffered from minor flux calibration problems. Spectra taken with the 500 line mm-1 grating exhibits an artificial drop in flux redward of 6000Å. Spectra taken with the 800 line mm-1 grating show a weak 400Å oscillation in the continuum shape. To correct for this oscillation, each spectrum was divided by a smoothed and normalized spectrum of 0716+714, a high-SNR, featureless spectrum. The spectrum of 0716+714 itself is shown in its uncorrected state.
Near-IR spectroscopy in the (m), (m), (m) and (m) bands was also attempted on several objects which remained featureless after extensive optical spectroscopy. Two observing runs were completed on the KPNO 2.1m during 24-26 November 1996 and 15-16 February 1997. We used the IR Cryogenic Spectrometer (CRSP) with a low-resolution 75 line mm-1 grating to give a dispersion of 18-35Å per CCD pixel and a resolution (FWHM) of 50-100Å (depending on the band) with a 1.7″ slit. Each object was observed in as many bands as possible, to moderate SNRs resulting in minimum equivalent width limits of 10–50Å for each band. Atmospheric corrections were made in a manner similar to those described in Maiolino et al. (1996). Unfortunately due to numerous hardware and weather problems we were unable to obtain many high-SNR spectra; and no emission lines were detected above the minimum values quoted in Table 2. Table 2 includes by column: [1] the object name; [2] dates of observation; [3] the observed IR band(s); [4] the typical SNR (continuum flux / RMS) for each spectra; and [5] the minimum limit for any emission line (assuming a detection limit). Most of the near-IR spectra are of poor quality for the purposes of this work and put only very loose constraints on any emission lines present; in all cases the weak (Å) emission lines often seen in BL Lacs would be undetectable.
With our new spectra emission-line redshifts are now determined for 27 of the 37 BL Lacs; four of which are in need of confirmation due to the detection of only one line. Redshift lower limits for four more sources have been determined by absorption systems (e.g. SR97). The remaining five sources show no certain emission nor absorption features, however a lower limit of can be inferred because all five are optically unresolved in ground-based images (Stickel, Fried & Kühr 1993; hereafter SFK93). Redshifts for the entire 1Jy sample are given in Table 3. The columns are: [1] the 1Jy object name; [2] and [3] the emission and absorption redshifts. An absorption redshift is listed only if it is different from the emission redshift. Redshifts followed by a colon are not confirmed; and [4] the reference from which the redshift was obtained; RS01 refers to this paper. Table 4 lists the observed spectral line properties for the objects observed. Average values are reported when more than one spectrum is available. The columns are: [1] the 1Jy object name; [2] the average redshift of the lines observed. An average is given for the emission lines; absorption lines are listed separately if they are at different redshifts; [3], [4], [5] and [6] are the line identifications, their rest and observed wavelengths (in Å) and the redshift of the line; [7] and [8] are the observed full-width half-maximum and observed equivalent of each line (in Å); for emission lines [9] is the observed flux density of the line in 10-16 erg s-1 cm-2 and [10] is the line luminosity in 1041 erg s-1 in the object rest frame.
With our new spectra as well as with a review of spectra available in the literature, the classification of several BL Lacs must be called into question due to the presence of emission lines with substantial . Stocke et. al (1991) proposed a Å classification limit for BL Lacs; S91 later modified this definition to accommodate higher redshift candidates by requiring that the rest Å. Neither of these criteria have any physical basis but are supported by the observed paucity of quasars with rest Å (Stocke et al. 1991). Further, the spectral range over which an object must be featureless has not been specified; e.g., our spectrum of PKS 2029+121 taken with the MMT blue-channel spectrograph discovered strong CIV emission at Å, a line which was not detectable in our 2.1m spectra because the Goldcam spectrograph is not sensitive blueward of Å. We mark with an asterisk in Table 3 all objects whose spectra have been observed to have had at any time emission lines with rest Å. For most of these objects the high– emission lines are transient (e.g., BL Lac itself; Vermeulen et al. 1995, OJ 287; Sitko & Junkkarinen 1985 and B2 1308+326; S91). In addition, strong (Å) emission lines have also been detected on at least one occasion in PKS 0537-441 (Wilkes 1986), B2 1308+326 (SFK93), PKS 1749+096 (Scarpa & Falomo 1997) and PKS 2029+121 (this paper), so the BL Lac classification for these objects is questioned.
2.2. Radio Continuum Imaging
Ten 1Jy BL Lacs were observed with the NRAO222The National Radio Astronomy Observatory is operated by Associated Universities, Inc., under cooperative agreement with the National Science Foundation. VLA on 5 August 1995. We chose to observe with the A-array at 20cm with a 50MHz bandwidth to maximize sensitivity to extended, steep-spectrum structure while achieving 1.5″ resolution. Approximately eight 6-minute scans, each bracketed by a 90–second scan on a primary VLA flux calibrator, were made to obtain 100,000 “visibilities” for each source. Scans were widely spaced to optimize coverage in the plane; allowing dynamic ranges (peak flux density to RMS) of 10,000 : 1 to be achieved for most objects.
Epoch 1995.2 VLA values were used to flux calibrate the maps using multiple observations of 3C 286. Since these sources are highly core dominated, a point source model was assumed to start the self-calibration process, followed by clean component models. Phase-only self-calibration in decreasing solution intervals was used for the first four iterations. Amplitude and phase self-calibration were then used until the maximum dynamic range was achieved, usually requiring only one or two more iterations. The AIPS task IMAGR was used to generate the maps and clean components. Robust weighting (ROBUST = 0.5; see Briggs 1995 for an explanation) was used to achieve a smaller beam FWHM with only a 10–12% increase in noise over natural weighting. The maps are shown in Figure 2.
The core flux densities were measured by fitting the core with a single Gaussian with the synthesized beam’s parameters. The extended flux was determined by measuring the total flux density with a box enclosing the entire source and then subtracting the core flux density. The luminosity is calculated with the standard cosmology, with - and bandpass corrections applied. A power-law continuum of the form is assumed where is assumed for extended flux densities and is assumed for the core (values typical of BL Lacs; PS93).
We do not account for cosmological surface-brightness dimming and beam dilution effects. These effects decrease the amount of extended flux observed, especially so for edge-dimmed FR–1 sources at redshift . FR–2 sources are not greatly affected because their extended flux is often dominated by high surface-brightness hotspots. PS93 describe a method for correcting for these biases, but the corrections are strongly dependent on the source structure and redshift. It is not clear how to account for the unusual, highly distorted morphologies seen in the 1Jy sample because many are not clearly FR–1 or FR–2 in morphology. Thus we do not attempt to correct for these effects.
A concern with observing with the A-array is that extended structure will be “overresolved” and that the extended flux will be underestimated. We do not believe this to be a significant concern because arcminute-scale radio emission in BL Lacs is rare (Ulvestad & Johnston 1984; Kollgaard et al. 1992). 3C 371 is a notable exception (Wrobel & Lind 1990) but it is at a much lower redshift than most of the sources presented herein.
With these observations all but two 1Jy BL Lacs have been imaged with the VLA A-array at 20cm to a dynamic range . Curiously, we were unable to locate a deep 20cm A-array map of BL Lac itself; thus we used the 20cm B-array map from Antonucci (1986). PKS 2005–489 is too far south to be observed with the VLA. We are now able to look at the radio properties of the 1Jy sample at a single frequency and array configuration, as summarized in Table 5. Columns include: [1] object name; [2] and [3] the uncorrected core and extended flux densities at 20cm (mJy); [4] and [5] the - and bandpass-corrected core and extended logarithmic radio power in W Hz-1; [6] the ratio of core to extended flux; [7] the physical size of the source (see discussion below); [8], [9] and [10] the Fanaroff-Riley (1974) classification based upon the extended radio structure (R), optical emission line properties (O) and a final (F) classification based upon both (see §4.1 for discussion); and [11] is the reference for the radio map. Absolute quantities assume either the emission line redshift from Table 3 or a lower limit on the redshift from either the presence of an absorption system in the spectrum or an optically unresolved image. Tentative values are marked with a colon. Values in parenthesis are highly uncertain because they are based upon an upper limit on extended flux density and a lower limit or redshift.
We had difficulty choosing an appropriate means for measuring the largest-angular size for each source. For example, Murphy et al. (1993; hereafter M93) chose to measure from the core to a single peak, or “hotspot,” in the extended emission because many of the objects in their sample show only one-sided emission. This definition is not precise because many 1Jy BL Lacs have diffuse extended emission without clear hotspots. For consistency with PS93 and Laurent-Muehleisen et al. (1993) we choose to define the largest angular size as the sum of two straight lines from the core to the outermost 3 contours, with each line intersecting the brightest hotspot, if any, in the extended structure. By doing so we are assuming that BL Lacs are intrinsically “triple” sources consisting of a core and two outer lobes, which may not be the case. For sources without a clear “triple” morphology a best guess is made; these values are thus questionable and are marked with a colon in Table 5. S5 0454+844 and PKS 1749+096 remain unresolved at 1 arcsecond resolution and at the 0.1 mJy beam-1 level; and PKS 1519-273 is unresolved at the 0.5 mJy beam-1 level (Cassaro et al. 1999, hereafter C99). Extended flux is tentatively measured in PKS 1144-379 (C99) and PKS 0823+033 (a weak eastern component shown in the map of M93 is most likely not real). Unresolved sources are given an upper flux density limit based upon the limit on extended flux shown in Table 5. The estimates for S5 0454+844 and PKS 1519-273 are very uncertain because they are unresolved and have only a lower limit on redshift.
2.3. Observational Status of the 1Jy Sample
All of our optical spectra are of sufficient quality to determine whether or not these objects should be classified as BL Lacs based upon the rest Å criterion. However several faint objects (S4 0828+493, PKS 1519-273 and PKS 2150+173) are in need of higher-SNR spectra to determine if weak (Å) emission lines, often found in BL Lac spectra, are present. The spectra of four of these objects (PKS 0118–272, S4 0218+357, S5 0454+844 and PKS 0735+178) detect only absorption systems, thus giving a lower redshift limit, and are also in need of additional observations to search for emission features from the AGN or absorption features from the host galaxy. Four bright BL Lacs (PKS 0048-097, S5 0716+714, S4 0814+425 and B2 1147+245) have no confirmed spectral features despite numerous high-SNR observations by us and by others.
All but three of the 1Jy BL Lacs have been mapped with the VLA to a dynamic range of 1000:1. PKS 2005–489 is too far south to be observed with the VLA; it is in need of synthesis-array observations. The 20cm B-array map from Antonucci (1986) marginally resolves BL Lac (S4 2200+420); therefore it should be deeply mapped with the A-array. PKS 2254+074 is also in need of high-dynamic range mapping to confirm weak extended structure detected by Antonucci & Ulvestad (1985).
3. Notes on Individual Sources
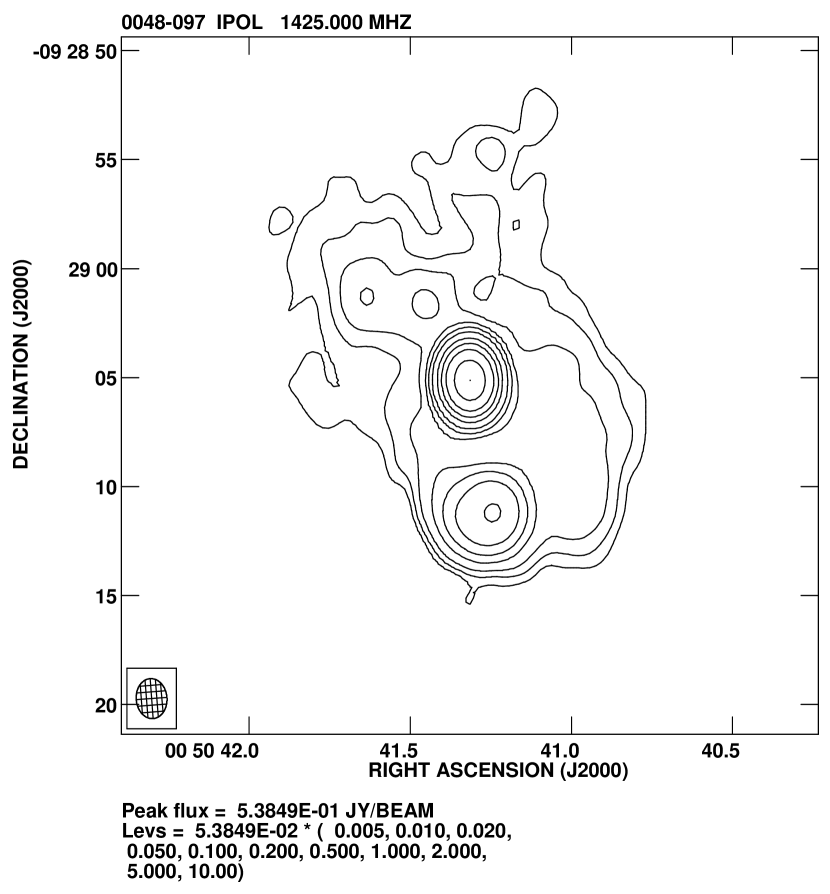
PKS 0048–097: A very weak emission line may be detected at 6092Å in both our MMTO 4.5m and 2.1m spectra. It is plausibly [OIII] 5007 at because Ly may be present in the IUE spectra at this redshift (Lanzetta, Turnshek & Sandoval 1993). Alternatively, there is evidence that the redshift for this source is higher. Falomo (1996) reports that it is optically unresolved and, assuming a host elliptical of , sets a lower limit to the redshift of . The presence of a hotspot near the leading edge makes this source a plausible “dogleg” FR–2 similar to 3C 270.1 and 3C 275.1 (Stocke, Burns & Christiansen 1985). The radio structure sets no firm limits on the distance to this object, however its FR–2-like radio structure does suggest that [OII] 3727 at is a more likely identification for the weak emission line at 6092Å. At this redshift PKS 0048-097 would have an extended radio luminosity more commensurate with an FR–2 (log ). This redshift is also in agreement with Falomo (1996). However, because both lines are so weak, we choose not to adopt either redshift. Because it is unresolved by ground-based, optical observations (SFK93), we assume for luminosity and linear size calculations rather than either tentative redshift.
PKS 0138–097: SFK93 report an absorption feature at 4200Å, identified as MgII 2798 at , which we confirm. We also detect MgII 2798, [NeV] 3426 and [OII] 3727 in emission and CaII 3933,3968 in absorption at . An MMTO spectrum of this object is also presented in SR97. Deep R- and K’-band imaging reveal four nearby nonstellar objects, one or more of which may be the absorbing galaxy (Heidt et al. 1996). At the extended radio structure is too luminous for an FR–1 (see Figure 2). The morphology appears to be that of a “dogleg” FR–2 source (Stocke et al. 1985); and is confirmed by C99.
S5 0454+844: Lawrence et al. (1996; hereafter L96) first identified an absorption feature at Å to be Na “D” at . However our 2.1m observations resolve this feature into the MgII doublet 2796,2802 at . A discussion of this source is presented in SR97. S5 0454+844 is unresolved at radio and optical wavelengths, which is consistent with a high redshift. This new redshift lower limit makes this the most distant object in the 1Jy sample. The MMTO 6.5m spectrum shows evidence of a broad hump at 4855Å. If real, this may be CIII] at , although CIV is not detected at this redshift. Alternatively, the hump at 4855Å may be CIV at . A potential feature at 3790Åmay be identified with Ly at this redshift, although there is no evidence for CIII] . The hump is unlikely to be Ly at as no depression from a Ly forest is present, nor is CIV present at that redshift.
S5 0716+714 (DA 237): This object is remarkably featureless in our 2.1m and MMTO 6.5m spectra. This well-studied source (e.g. Vermeulen & Taylor 1995; SFK93) has yet to show any spectral features. The weak 400Å oscillation in the continuum shape and the small absorption feature at 4380Å in our MMTO 6.5m spectrum are due to flux calibration errors. Because its has a high-SNR and is featureless, the MMTO 6.5m spectrum of 0716+714 was used to correct for the same calibration errors in other MMTO 6.5m spectra taken with the 800 line mm-1 grating. 0716+714 is optically unresolved (SFK93), suggesting .
PKS 0735+178: We confirm the strong absorption feature at 3985Å first identified as MgII 2798 at by Carswell et al. (1974). Our MMTO 6.5m spectra resolves the MgII doublet as well as detects MgI 2852 and FeII 2344, 2383, 2587 and 2600 at this redshift. Galactic CaII 3933,3968 is also detected. We do not confirm a second, tentative absorption system suggested by Carswell et al. (1974). No other features are clearly apparent. The radio source is marginally resolved (M93, Perlman & Stocke 1994), suggesting a high redshift.
S4 0814+425 (OJ 425): Wills & Wills (1976) suggested a highly uncertain redshift of based upon two weak emission lines identified as MgII 2798 and [OII] 3727. However, our observations and others (SFK93, Dunlop et al. 1989) find no evidence for spectral features at this or any other redshift. Falomo et al. (1997) report this object to be unresolved by HST/WFPC-2 observations and, assuming a host elliptical of , suggest . L96 detect very weak features which they identify as either MgII at or CIV 1549, CIII] 1909 and [OII] 3727 at . Both are very speculative; and the former redshift is probably ruled out by Falomo et al. (1997). We note the possible detection of a weak line at 4262Å, which is potentially seen in both our KPNO 2.1m spectra but not in our MMTO 6.5m spectrum. A better spectrum blueward of 4500Å is required for this object.
S4 0828+493: This object was observed twice at the 2.1m. Both spectra confirm the narrow emission line seen at 5770Å by SFK93, which they identify as [OII] 3727 at . [NeV] 3426 is also possibly present at this redshift in our spectrum. However, given that only one emission line is definitely detected, there is no compelling argument for this redshift. Indeed, at MgII emission should be visible in our spectrum and that of SFK93 and it is not observed. The radio structure shown in Figure 2 appears to be that of an edge-darkened twin jet source, typical of FR–1s; and yet at the extended power is too luminous to be an FR–1, suggesting a lower redshift. Therefore the redshift of this object remains in doubt. A better spectrum blueward of 5000Å is required for this object.
S4 0954+658: L96 measure a firm redshift of with the detection of [OII] 3727, [OIII] 5007 and H. SFK93 and our spectra confirm this redshift by detecting CaII 3933,3968 in absorption and [OII] in emission. The one-sided radio emission resembles an FR–1 morphology and has an extended radio power consistent with that morphology at this redshift.
B2 1147+245: This object remains stubbornly featureless, in agreement with SFK93. It is optically unresolved (SFK93), suggesting . Its FR–2 radio morphology (Antonucci & Ulvestad 1985; C99) suggests it is a high- object.
PKS 1519–273: No spectral features are present, in agreement with SFK93 and White et al. (1988). However, due to its low declination, we were unable to obtain a high-quality spectrum. Further observations are needed. It is optically unresolved (SFK93), suggesting .
S4 1749+701: SFK93 report an emission feature which they have detected on two occasions and which they identify as [OII] 3727 at . L96 confirm this redshift with the detection of [OII] as well as CIII] 1909. Our spectra do not confirm the [OII] line and CIII] is outside of our wavelength range. The VLA map is only marginally resolved, consistent with a high-. At the extended radio power level is only consistent with this source being an FR–2.
PKS 1749+096 (4C 09.57): SFK93 report as confirmed independently by Stickel et al. (1988a) and White et al. (1988) by detecting [OII], H and [OIII] emission. The host galaxy of this BL Lac is easily resolved on the CFHT image of Wurtz et al. (1996) and has an absolute magnitude consistent with BL Lac hosts at that redshift. However, despite its moderate redshift the radio emission is completely unresolved at a dynamic range of . The absence of extended flux for this relatively nearby source is unusual, although very faint, diffuse extended radio cannot be completely ruled out. Nonetheless the extended radio power for this source is very low, and most likely lower than any other 1Jy BL Lac. This anomaly is similar to PKS 1413+135 (Perlman et al. 1996) and should be investigated further.
S5 1803+784: Our spectrum confirms the broad emission feature identified by SFK93 as MgII 2798 at . We also detect H at this redshift. L96 confirm this redshift.
S4 1823+568 (4C 56.27): L96 detect MgII 2798, [OII] 3727, H and [OIII] 5007 at . Our MMTO spectrum confirms the MgII and [OII] lines as well as detects [OIII] 2321 and CaII H&K in absorption at that redshift.
PKS 2029+121: Stickel & Kühr (1993) first found the intervening MgII system at and suggested an emission redshift of based upon broad MgII. SR97 present our spectrum which confirms both redshifts (although at a slightly different emission redshift of based upon the detection of CIV, CIII] , MgII 2798 and [OII] 3727). Our VLA map shows a one-sided, edge-brightened source consistent with an FR–2 level of extended radio power. The rest equivalent width of the CIV emission line ( Å) exceeds the criterion proposed by S91.
PKS 2131–021 (4C -02.81): Wills & Lynds (1978) suggested a redshift of ; however, our spectrum shows [OII] 3727, MgII 2798 and CIII] 1909 in emission at . These emission lines are at the upper limit in for BL Lac objects. Drinkwater et al. (1997) independently confirm our redshift. In addition, there are very weak absorption features at which are more apparent in a subset of our 2.1m spectra. These very tentative detections require confirmation and suggest that MgII absorption should be searched for at Å. Surprisingly the extended radio structure resembles a wide-angle tail but with the extended radio power and leading-edge hotspots like an FR–2. This unusual radio morphology is suggestive of a gravitationally-lensed source; however 0.1 arcsecond-resolution maps reveal a jet to the southeast of the core which bisects the lobes to the south and east (Rector & Stocke 2002).
PKS 2150+173: Our 2.1m and MMTO spectra show no evidence for any lines, in agreement with Stickel, Kühr & Fried (1993). The very extended narrow-angle tail radio morphology suggests a low to moderate redshift (i.e., assuming an upper limit on extended radio power for an FR–1 of log W Hz-1 requires that for this source).
4. Completeness of the 1Jy Sample
Browne and Marchã (1993; hereafter BM93) and Marchã and Browne (1995; hereafter MB95) describe optical selection effects which can make BL Lacs difficult to recognize, thus introducing the possibility that such samples are incomplete. A “low-luminosity BL Lac” (i.e., a BL Lac object which is either intrinsically less luminous or not as strongly Doppler boosted) would be difficult to identify optically because the weak nonthermal continuum from the AGN could be strongly diluted by starlight from the luminous host elliptical galaxy, thus causing the object to be misidentified as either a radio galaxy or, in the X-ray case, as a cluster of galaxies (Rector, Stocke & Perlman 1999), rather than as a BL Lac. The magnitude cutoff of the 1Jy sample () will bias against these objects, as they are intrinsically faint optically. MB95 predict that the percentage of missing objects in the 1Jy sample is 22%, 18% of which are missing due to galaxy dilution and 4% due to the magnitude cutoff. MB95 estimate that most of these misidentified BL Lacs are at low (). Although significant, this effect probably cannot explain the discrepancy between the EMSS and 1Jy samples (MB95).
The predictions of BM93 and MB95 are based only upon selection effects due to the optical selection criteria for BL Lacs. It is also possible that the 1Jy sample is incomplete due to selection effects at radio wavelengths. In particular, the flat radio-spectrum criterion ( between 11 and 6cm; S91) for BL Lacs effectively biases the 1Jy sample against lobe-dominated radio sources, as the spectral index for the extended radio structure is typically steeper than the core. A BL Lac whose core is not strongly Doppler boosted may thus be eliminated.
A study of eight XBLs from the EMSS and HEAO-1 samples by Stocke et al. (1985) found that three of the objects showed a steep radio spectrum which exceed this criterion, and two more were marginally steep. Furthermore, a spectral analysis of the EMSS sample using the discovery 6cm flux and the NVSS 20cm flux find that about 30% of the objects show a spectrum steeper than . However, it is certainly possible that XBLs have radio spectral indices that are significantly different than RBLs. Further, the flux density measurements were not simultaneous, and therefore variability may affect the results. Simultaneous, multi-frequency observations of EMSS XBLs are underway to address this issue (Cavallotti et al. 2001).
However, the primary point to be made here is that flat radio-spectrum criterion is arbitrary. The distribution of spectral indices in the entire 1Jy survey can be described as marginally bimodal, with a minimum between the peaks at roughly (Figure 3). There is no indication that should be considered as an intrinsic break between flat and steep spectral objects in the 1Jy survey. Almost half (216 of 518) of the objects in the 1Jy survey have steep radio spectra (); and 115 of these objects have spectral indices which are near the flat radio-spectrum criterion (). Of these, 66 of these objects are galaxies and 32 are quasars. As spectral variability of is not unusual for RBLs (e.g., 0716+714; Wagner et al. 1996), many of these objects may be RBLs which were observed in the wrong epoch to be classified as such.
What number of 1Jy objects have been misclassified because of the flat radio spectrum criterion, or because of the optical selections effects described in BM93, is unknown. However, there is already evidence that these criteria do eliminate some BL Lac objects. Rector et al. (1999) identify 3C 264, a narrow-angle tail radio galaxy in Abell 1367 and a member of the 1Jy survey (1Jy 1142+198), as a low-luminosity BL Lac object. Its marginally-steep radio spectrum (; Kühr et al. 1981) eliminated it from consideration for the 1Jy BL Lac sample. It is at a low redshift (; Zabludoff et al. 1993) and has a relatively high radio flux ( Jy; Kühr et al. 1981), giving it a . The flat radio-spectrum criterion biases the 1Jy sample towards BL Lacs which are more strongly Doppler boosted, hence the BL Lacs which are most extreme in their properties. If objects such as 3C 264 are abundant in the 1Jy sample, the range of observed properties for 1Jy BL Lacs, including the sample , could be different.
5. Properties of the 1Jy Sample and Impact on Unified Schemes
In recent years the unification picture for BL Lac objects has become increasingly complex. In contrast to the unified model, several authors have suggested (e.g., Brinkmann et al. 1996; Scarpa & Falomo 1997) that RBLs may be more closely related to other blazars, i.e. FSRQs, than to XBLs. Here we compare the properties of 1Jy RBLs to the complete XBL sample of M91 as well as to complete samples of radio galaxies (FR–1s and FR–2s) and FSRQs drawn from the 2Jy sample of Wall & Peacock (1985).
5.1. Radio Power Levels
If BL Lacs are simply a highly-beamed population of FR–1 radio galaxies their, presumably unbeamed, extended radio flux densities should be similar. R00 find that BL Lacs from the EMSS have extended radio powers almost completely consistent with that of FR–1s. Based upon the VLA maps and updated redshifts presented here and in R00, a comparison of the extended luminosities of the complete 1Jy and EMSS samples reveal that they are very different (Figure 4). The 1Jy luminosities are nearly two orders of magnitudes more luminous: log W Hz-1 for the 1Jy sample, as compared to log W Hz-1 for the complete EMSS “M91” sample (R00). Note that the former value is considered a lower limit as many 1Jy BL Lacs have only a lower limit in redshift; and the latter value is an upper limit as extended radio flux was not detected in roughly half of the objects in the M91 sample. A Kolmogorov-Smirnov (K-S) test on the distributions of extended radio power of the 1Jy and EMSS samples finds that the probability these two samples are drawn from the same parent population is %. While the extended radio luminosities for 1Jy RBLs are more luminous than XBLs, they are however significantly lower than 2Jy FSRQs (Padovani 1992).
If RBLs are highly-beamed radio galaxies we expect them to have extended radio structures that are more compact and distorted due to projection effects. As can be seen in Figure 2 the extended radio morphologies of RBLs do tend to be compact and highly distorted, often with a “halo” structure around the core. Their compact, distorted morphology makes it difficult, if not impossible, to classify a BL Lac object as being FR–1 or FR–2-like based solely upon its morphology. Thus we have relied primarily upon the extended radio luminosity to make this classification. Figure 4 shows the distribution of extended radio powers for RBLs in the 1Jy sample and XBLs in the EMSS (R00) which have been mapped by the VLA to a high dynamic range. Owen & Laing (1989) find that almost all radio galaxies with extended radio powers log 24.5 W Hz-1 are morphologically FR–1s; and those with log W Hz-1 are morphologically FR–2s; thus we use these dividing lines for our classification. RBLs with intermediate powers ( log W Hz-1) are given a Fanaroff-Riley classification based upon the radio morphology where possible. Uncertain classifications are marked with a colon in Table 5. PKS 2005–489 has no radio FR-classification due to the lack of a sufficient radio map. We find that many RBLs have extended radio powers which are too luminous to be FR–1s; and several have extended radio morphologies similar to FR–2s (e.g., PKS 0048–097 and PKS 2131–021; Figure 2). Our classifications are roughly in agreement with the radio luminosity-based classifications of Kollgaard et al. (1992).
We also classify each object by its optical spectral properties. Objects with broad (FWHM km s-1), luminous emission lines typical of FR–2s (e.g., Urry & Padovani 1995) are classified as such. Objects with only narrow (FWHM km s-1), weak emission lines or stellar absorption lines (i.e., not intervening absorption systems) are classified as FR–1s. Six objects with no detectable emission or absorption lines are not classified in this manner. These two classification schemes are in agreement for most objects (Table 5); seven objects have only one classification available and two have conflicting classifications that are not tentative. We classify PKS 0851+202 as a tentative FR–1 based upon its radio structure, despite the detection of broad H in its spectra (Sitko & Junkkarinen 1985); and we classify SR 1749+701 as a tentative FR–1 despite its relatively luminous extended radio power because only weak, narrow emission lines are seen in its spectrum (L96). Based upon these criteria we classify 11 RBLs as being FR–1-like and 15 as FR–2-like; 5 and 6 more are tentatively classified as FR–1 and FR–2 respectively.
Thus we conclude that the 1Jy sample contains roughly equal amounts of FR–1 and FR–2-like sources. Why this is the case depends on several factors: (1) the radio luminosity function (RLF) at 5 GHz for FR–1s and FR–2s over ; (2) selection effects induced by Doppler boosting, which depend on the jet Lorentz factors and physical opening angles for the two radio galaxy classes; and (3) the importance of gravitational microlensing in the 1Jy (SR97). Unfortunately, none of these factors are well known. The RLFs for FR–1s and FR–2s are well-known for (Urry et al. 1991; Padovani & Urry 1992), but their evolution is poorly constrained at higher redshift and virtually unknown at . Further, the Lorentz factors in radio galaxy jets have been measured in only a few instances (e.g., Lara et al. 1997). And a problem with the unification model is that radio galaxies do not show apparent superluminal motion as often as expected for a relatively unbeamed BL Lac population (Urry & Padovani 1995, and references therein), implying that they have smaller Lorentz factors than BL Lacs. A possible explanation for this discrepancy is that the motion of reverse shocks observed within the jet can be much slower than the actual flow velocity (Bicknell 1994). Thus, the Lorentz factors for radio galaxies are not necessarily inconsistent with BL Lacs, but they are also not well-constrained. Finally, as is discussed below, the number of gravitationally-lensed BL Lacs in the 1Jy sample is not known; nor do we know the source amplification, which is necessary to correctly determine for each lensed source.
Can the number of FR–1- and FR–2-like BL Lacs found the 1Jy sample be understood as a subset of the beamed counterparts of FR–1 and FR–2 radio galaxies, a subset which also includes SSRQs and FSRQs? Or is another mechanism (e.g., gravitational lensing) necessary to account for the surprisingly large number of FR–2-like BL Lacs? By using the observed RLFs of FR–1s and FR–2s as well as their evolutionary constraints (albeit with large errors; Urry & Padovani 1995), it is possible to construct RLFs for Doppler-boosted FR–1s and FR–2s using the formalism originally developed by Urry & Shafer (1984). By assuming reasonable values for the jet outflow velocity ( 5-10; Urry & Padovani 1995, Gabuzda 1992, PS93) and unbeamed core to lobe radio power ratios for FR–1s and FR–2s ( 0.01-0.1; Ulrich 1989; Urry et al. 1991; Padovani & Urry 1992), BL Lac samples can be constructed which meet the flux density and flat radio spectrum criteria of the 1Jy BL Lac sample. With nominal values for and , the observed numbers and redshift distributions of FR–1 and FR–2-like BL Lacs are readily produced (see Rector 1998 for specific examples), indicating that, at least based upon the radio selection criteria, the 1Jy BL Lac sample is not necessarily unusual. But the loose constraints of the model parameters are such that significantly different FR–1/FR–2 ratios are also possible. Tighter constraints on FR–1 and FR–2 evolution and Doppler boosting parameters are necessary before the FR–1/FR–2 content of the 1Jy sample may be used as a detailed constraint on BL Lac populations. We also note that this approach does not consider the other 1Jy selection criteria which also affect the observed sample properties (e.g., optical properties, as discussed in §5.3.)
5.2. Radio Core-Dominance Values
The radio core dominance value must be, at least to some extent, an indicator of beaming angle. The higher core-dominance values seen in RBLs have been known for some time; and have been invoked as a primary piece of evidence in support of the unified model that BL Lacs are beamed FR–1s. While nearly all XBLs are FR–1-like (R00), we have shown above that the 1Jy sample consists of roughly equal numbers of FR–1- and FR–2-like RBLs. An important question is the relationship between the low-luminosity, FR–1-like RBLs in the 1Jy and the low-luminosity XBLs in the EMSS.
The distribution of core-dominance values for RBLs is significantly higher than for XBLs (Figure 5), supporting the unified hypothesis that XBLs are indeed seen, on average, at larger angles. Further, the distribution of values for FR–1-like RBLs are similar to FR–2-like RBLs but not XBLs. Thus the 1Jy sample is not simply an admixture of low-luminosity, XBL-like BL Lacs and high-luminosity, FRSQ-like BL Lacs. A plausible explanation as to why the 1Jy sample contains only the most highly beamed sources is that the radio jet has either a larger Lorentz factor (hence a smaller beam pattern) or a smaller opening angle than the X-ray jet, such that a shallow radio survey such as the 1Jy will detect only the most highly beamed objects. However, an explanation is still required for the discrepancy in values for XBLs and FR–1-like RBLs, in order for the two samples to be part of the same population (see §5.4). A possible explanation is that the 1Jy RBL sample is incomplete due to its flat-spectrum selection criterion. If an object is seen at an orientation angle “too far” off axis such that it is seen outside the beam pattern or physical opening angle of the jet ( or ), it will become lobe-dominated and have too steep a radio spectrum to be included into the 1Jy. 3C 264 is an example of such an object (Rector, Stocke & Perlman 1999; see §4 for further discussion). Further, surface-brightness dimming and beam dilution effects (PS93), which strongly affect FR–1s, will bias the 1Jy sample against nearby, off-axis objects; i.e., more distant objects will appear more core-dominated and hence are more likely to be included into the 1Jy based upon their flat spectrum, thus artificially raising the value for the 1Jy. However, roughly three times the currently known FR–1-like BL Lac population would need to be identified in the 1Jy survey in order to bring the statistic for the 1Jy sample into agreement with the EMSS.
5.3. Emission Line Properties
While traditionally known for their linelessness, emission lines have been detected in most (27 of 37) 1Jy BL Lacs. However, the difficulty in detecting lines in BL Lacs does pose a problem for statistical studies of emission-line properties. And the wide range of redshifts in XBLs, RBLs and FSRQs prevents a comprehensive study of a single emission line at optical wavelengths; e.g., the [OIII] emission line is detected in only eight 1Jy RBLs, all of which are . Our observations did not discover previously undetected [OIII] emission in any RBLs; however, we did discover moderately luminous MgII emission in PKS 0138–097, PKS 2131–021 and PKS 2029+121.
Evidence indicates that the central region in BL Lacs is not obscured (e.g., Chiaberge et al. 1999 and references therein); thus, according to the unified model, RBLs and XBLs should possess identical distributions of emission-line luminosities. While most RBLs have moderately luminous (log erg s-1) emission lines, only three EMSS BL Lacs show any emission lines at all and they are very weak (log erg s-1; Figure 6). The spectra for both the 1Jy and EMSS samples are of sufficient quality to detect lines of this strength or weaker. Thus this discrepancy is not due to a systematic difference in the quality of spectra obtained, although it may be due to a difference in the redshift distribution for the two samples. EMSS BL Lacs are predominantly at lower redshifts (), thus many potentially strong emission lines (MgII, CIII] 1909 and CIV 1549) are not redshifted into the optical window.
While the sampling is poor, especially at high- (only 3 RBLs at ), the MgII and [OIII] emission-line luminosities for RBLs are several orders of magnitude lower than for 2Jy FSRQs. However, there is significant overlap between the two classes, forming a continuum of line luminosities among blazars (e.g., Scarpa & Falomo 1997). This suggests that the limiting equivalent-width criterion (Å) which differentiates RBLs and FSRQs is an arbitrary division. However, it should be noted that studies of blazars with VLBI techniques have revealed two distinct groups of blazars, as determined by the orientations of the magnetic fields within the radio jets. While not definitive, sources with strong emission lines tend to have primarily longitudinal magnetic fields in their jets, while in weak-lined sources the magnetic field is usually transverse to the jet axis (e.g., Gabuzda et al. 1992).
The lower emission-line luminosities in RBLs compared to FSRQs is may be exaggerated because RBLs lie at systematically lower redshifts than FSRQs. RBLs are rarely seen at high redshifts () because the strong CIII] , CIV and Ly lines appear in the optical at these redshifts, thereby preventing a BL Lac classification in most cases. PKS 2029+121 is an example of such an RBL.
5.4. The Spatial Distribution of BL Lacs
Six new redshifts for 1Jy BL Lacs are considered here: four are revisions to redshifts reported in S91 (PKS 0138-097, S5 0454+844, S4 0814+425 and PKS 2131-021) and two are for BL Lacs new to the sample (S4 0218+357 and PKS 2029+121). The distribution of redshifts is roughly flat up to (Figure 7). We do not see a preference towards detection of low- BL Lacs, as was previously reported for incomplete samples of RBLs (e.g., Browne 1989). The discussion in §3 describes how the new redshifts impact previous results on individual sources. These revisions include more high-redshift objects in the 1Jy, increasing the average redshift of the sample from to .
With these new redshift values, for the 1Jy sample increases slightly from (S91) to . We include objects without firm redshifts in the following manner: (1) the tentative redshifts of four objects (listed in Table 3) are assumed to be correct; (2) the four objects which only have lower limits on redshift based upon absorption lines in their spectra are set to these lower limits; and (3) the redshifts for the six objects with no redshift information are assumed to be , the of the 1Jy sample. Despite the increase in the moderate change in is not surprising as is primarily dependent on the sample flux limit and increases only weakly with redshift. The inclusion of objects with uncertain redshifts does not significantly affect , although the inclusion of objects with redshift lower limits does cause to be slightly underestimated. Now that redshift information is available for all but six of the 37 BL Lacs in the 1Jy sample, it is clear that new redshift information will change the sample value only slightly. The discrepancy between 1Jy RBLs and EMSS XBLs is 4.
As discussed in §4.1, about half of the BL Lacs in 1Jy sample which were observed with the VLA have extended radio powers more consistent with that of FR–2s. Thus an explanation to consider for the discrepancy between XBLs and RBLs is that the 1Jy survey draws from two populations of BL Lacs: low-luminosity, XBL-like objects and high-luminosity, FSRQ-like objects. However dividing the 1Jy sample by their extended radio luminosities into FR–1 and FR–2 groups does not explain the discrepancy, as the for both subsamples are indistinguishable ( and respectively). So, not only does this fail to explain the discrepancy between the two samples, but it also suggests that low-luminosity, FR–1-like RBLs do not share the same parent population as XBLs. We do note a discrepancy between the values of low- and high- RBLs: for and for , although this is insufficient to reconcile the for RBLs and XBLs with .
The for RBLs does agree with FSRQs in the 2Jy sample ( ; Urry & Padovani 1995), further suggesting that RBLs are more closely related to FSRQs than XBLs; although 2Jy FSRQs are at significantly higher redshifts ( = 0.91). The for 2Jy FR–2s with ( ) is slightly lower than for RBLs; and 2Jy FR–1s have a significantly lower value ( ) which is consistent with the for XBLs. Thus the for the 1Jy sample cannot be explained as an admixture of FR–1s and FR–2s; although this comparison is difficult as the 2Jy radio galaxy samples are at much lower redshifts ( = 0.02 for FR–1s and = 0.15 for FR–2s). The possible incompleteness of the 1Jy sample suggested in §4 is unlikely to explain these discrepancies.
R00 find evidence of a correlation between log() and among EMSS XBLs, wherein the more extreme HBLs (log() ) clearly show negative evolution and the less extreme HBLs ( log() ) are compatible with a no-evolution result. Other HBL samples also show this characteristic (e.g., Bade et al. 1998; Giommi, Menna & Padovani 1999). Table 6 presents the results of the test as it is applied to subsamples of the 1Jy and EMSS divided by their log() ratios. Data for the EMSS were obtained from R00. The log() values for the 1Jy sample were determined from 1 keV flux densities in Urry et al. (1996); the three objects newly classified as RBLs were excluded due to a lack of sufficient X-ray data. Column [1] is the BL Lac sample from which the subsample is derived; column [2] is the log() range for the subsample; column [3] is the number of objects in the subsample; and column [4] is the and its error; the error is . The correlation between log() and originally observed in HBL samples spans the entire range of observed log() values in BL Lacs. A trend in is observed, from negative evolution in the more extreme HBLs to positive evolution in the more extreme LBLs. Georganopoulos & Marscher (1998) explain this correlation as a result of positive evolution of the electron kinetic luminosity of the jet . They demonstrate that as decreases the peak synchrotron frequency increases, thereby increasing the log() value and producing the observed positive evolution in RBLs and negative evolution in XBLs.
5.5. Gravitational Microlensing
As was discussed earlier, the distribution of emission-line luminosities for RBLs are systematically lower than for FSRQs, but with significant overlap between the two classes. Due to the limiting equivalent-width criterion (Å), RBLs may have systematically higher optical continuum levels. A plausible explanation for the boosted continuum in some but not all BL Lacs is gravitational microlensing of a quasar by a foreground galaxy. Microlensing can preferentially amplify the nonthermal emission from the compact AGN over the extended emission-line regions, thus “swamping” the emission lines. However only one known BL Lac object (S4 0218+357) shows the multiple images expected from associated macrolensing (O’Dea et al. 1992). Narayan & Schneider (1990) point out that if the lensing galaxy has a low surface brightness or a large scale length the surface mass distribution will be below the critical amount necessary to produce multiple images. However such cases may never be individually confirmed conclusively as it is difficult to separate the effects of microlensing from the intrinsic variability of the background quasar; although intrinsic variability may be differentiated from lensing variability by the latter’s achromatic nature. As was discussed in SR97 we find strong (Å) MgII absorption systems along RBL sightlines at a rate 4–5 times greater than expected from quasar sightlines (Steidel & Sargent 1992). And recent work on damped Ly absorption systems (which are very strong MgII absorbers like those seen in BL Lacs) by Turnshek & Rao (2000) show that most absorbing galaxies are of low luminosity. These galaxy types would not necessarily produce multiple macrolensed images (Narayan & Schneider 1990). Further, at least six RBLs show possible evidence of lensing by a foreground galaxy (PKS 0138–097; Heidt et al. 1996, S4 0218+357; O’Dea et al. 1992, AO 0235+164; Stickel et al. 1988a, PKS 0426–380; SFK93, PKS 0537–441; Stickel et al. 1998b and B2 1308+326; Stickel 1991); and three RBLs have extended radio morphologies that are unusual enough to be suggestive of gravitational lensing (S4 0814+425; M93, B2 1308+326; M93 and PKS 2131–021; this paper). However, for some of these sources there also is evidence against the microlensing scenario (e.g. AO 0235+164; Abraham et al. 1993, Chu et al. 1996 and PKS 0537–441; Falomo et al. 1992, Lewis & Ibata 2000).
The presence of lensed sources does not explain the discrepancy between XBLs and RBLs, as removing all suspected microlensing candidates (i.e., RBLs with intervening absorption systems and/or evidence of a foreground galaxy) from the 1Jy sample does not significantly change the value ( ). Thus, while gravitational lensing might be a mechanism for introducing a few BL Lacs into the 1Jy sample, the frequency of sources so affected is unknown and probably small. High-resolution radio and optical imaging of high- RBLs in the 1Jy sample, which is currently underway, will address this issue further.
6. Conclusions
We have presented new optical and near-IR spectroscopy as well as new high dynamic range, arcsecond-resolution VLA maps of BL Lacs from the updated 1Jy RBL sample of S91. Redshift information is now available for all but six of the 37 BL Lacs in the sample. An additional four have only a lower limit on redshift due to absorption systems; and four more have only a tentative redshift based upon the detection a single emission line. All but three of the RBLs have been observed with the VLA at 20cm in A-array to a high dynamic range (); and extended radio flux has been detected in all but three of those observed. Thus accurate arcsecond-scale, 20cm extended radio luminosities, or upper limits, are now available for nearly all of the sample.
While further observations are still necessary to determine or confirm emission-line redshifts for fourteen RBLs, spectral information for the 1Jy sample is largely complete. With this new redshift information the for the 1Jy sample is raised slightly to , which is 4 higher than the complete EMSS XBL sample ( for the M91 sample; R00). Thus the discrepancy for these two samples cannot be explained as a result of incomplete redshift information. Combined with the results of R00, a correlation between log() and is observed, from negative evolution in the more extreme HBLs to positive evolution in the more extreme LBLs. However, this correlation should be confirmed in a uniformly-selected BL Lac sample which spans the entire range of observed log() values (e.g., the ROSAT-Green Bank sample; Laurent-Muehleisen et al. 1999).
Several other important differences are also found in the properties of RBLs and XBLs. In the unified model the, presumably unbeamed and unobscured, emission-line and extended radio luminosities should be similar for XBLs, RBLs and FR–1s. However, whereas XBLs and FR–1s show weak or no emission lines, most RBLs possess moderately luminous emission lines. The lines observed in RBLs are statistically less luminous than FSRQs; however there is significant overlap in the luminosity distributions of the two classes. Over half of the 1Jy RBLs have extended radio powers too luminous to be beamed FR–1 radio galaxies, which disagrees with the unification model in its simplest form. This differs from XBLs, all of which have extended power levels consistent with FR–1s (R00). The extended radio luminosities of RBLs are also statistically lower than FSRQs. These major observational differences strongly suggest that RBLs and XBLs are not simply related, and that RBLs are more closely related to FSRQs; although an explanation for why RBLs statistically have lower-luminosity emission-lines and lower-power extended radio lobes than FSRQs is necessary. One possibility is that of selection effects due to redshift, wherein many RBLs are simply FSRQs at too low of redshift () for their strong UV lines to be seen into the optical.
Unlike the EMSS XBL sample which is almost entirely consistent with a beamed FR–1 population, the 1Jy sample is a heterogeneous sample in which we find evidence for, and examples of, three distinct mechanisms for creating the BL Lac phenomenon: beamed FR–1s, beamed FR–2s and possibly a few gravitationally-lensed quasars. More than half of the BL Lacs in the 1Jy sample have extended radio powers and optical emission line luminosities which are FR–2-like. The number of gravitationally lensed sources in the 1Jy sample is not known but likely small; and the microlensed sources are most likely amongst the FR–2-like RBLs. But overall, the number of FR–2-like RBLs in the 1Jy sample can be readily understood as a subclass of beamed FR–2s. The presence of FR–2s and gravitationally lensed objects in the 1Jy sample does not explain the or the radio core-dominance discrepancy between XBLs and RBLs. Nor can the 1Jy sample be simply described as beamed FR–1, XBL-like objects contaminated with a population of high- FR–2s with low- optical emission lines. The different means of producing BL Lac-like objects seen in the 1Jy sample therefore exclude simple unification models such as the orientation model. Because the 1Jy is a very shallow survey, its BL Lac objects may be too small in number to allow firm conclusions to be drawn about the full RBL population. Deeper samples of RBLs are required to address the questions raised but not answered by this work.
References
- Abraham, R.G., Crawford, C.S., Merrifield, M.R., Hutchings, J.B. & McHardy, I.M. 1993 ApJ 415, 101. Angel, J.R.P. & Stockman, H.S. 1980 Ann. Rev. Astr. Ap., 18, 321. Antonucci, R.R.J. & Ulvestad, J.S. 1985 ApJ 294, 158. (AU85) Antonucci, R.R.J., Hickson, P., Olszewski, E.W. & Miller, J.S. 1986 AJ 91, 1. (A86a) Antonucci, R.R.J. 1986 ApJ 304, 634. (A86b) Bade, N., Beckmann, V., Douglas, N.G., Barthel, P.D., Engels, D., Cordis, L., Nass, P., & Voges, W. 1998 A&A, 334, 459. Barthel, P.D., 1989 ApJ 336, 606. Bicknell, G.V. 1994 ApJ 422, 542. Blandford, R.D. & Rees, M.J. 1978, in Pittsburg Conf. on BL Lacs, ed. A.M. Wolfe (Pittsburgh: Univ. Pittsburgh), 328. Brinkmann, W., Siebert, J., Kollgaard, R.I. & Thomas, H.-C. 1996 A&A 313, 356. Browne, I.W.A., in BL Lac objects, ed. L. Maraschi, T. Maccacaro & M.-H. Ulrich (Heidelberg: Springer-Verlag), 401. Browne, I.W.A., Patnaik, A.R., Walsh, D. & Wilkinson, P.N. 1993 MNRAS 263, L32. (B93) Browne, I.W.A. & Marchã, M.J.M. 1993 MNRAS 261, 795. Briggs, D. 1995, PhD dissertation, New Mexico Institute of Mining and Technology. Carswell, R.F., Strittmatter, P.A., Williams, R.E., Kinman, T.D. & Serkowski, K. 1974 ApJ 190, L101. (C74) Cassaro, P., Stanghellini, C., Bondi, M., Dallacasa, D., della Ceca, R. & Zappalà, R.A. 1999 A&AS 139, 601. Cavallotti, F., Wolter, A., Rector, T.A. & Stocke, J.T. 2001, in prep. Chiaberge M., Capetti A. & Celotti A. 1999 A&A 349, 77. Chu, L.B., Baath, F.T., Rantakyroe, F.J., Zhang, H.S. & Nicholson, G. 1996 A&A 307, 15. Condon, J.J., Cotton, W.D., Greisen, E.W., Yin, Q.F., Perley, R.A., Taylor, G.B. & Broderick, J.J. 1998 AJ115, 1693. Drinkwater, M.J., Webster, R.L., Francis, P.J., Condon, J.J., Ellison, S.L., Jauncey, D.L., Lovell, J., Peterson, B.A. & Savage, A. 1997 MNRAS 284, 85. (D97) Dunlop, J.S., Peacock, J.A., Savage, A., Lilly, S.J., Heasley, J.N. & Simon, A.J.B. 1989 MNRAS 238, 1171. Falomo, R., Maraschi, L. & Tanzi, E.G. 1987 ApJ 318, L39. (F87) Falomo, R. 1991 AJ 102, 1991. (F91) Falomo, R., Melnick, J. & Tanzi, E.G. 1992 A&A 255, L17. Falomo, R. 1996 MNRAS 283, 241. Falomo, R., Urry, C.M., Pesce, J.E., Scarpa, R., Giavalisco, M. & Treves, A. 1997 ApJ 476, 113. Fanaroff, B.L. & Riley, J.M. 1974 MNRAS 167, 31. Fleming, T.A., Green, R.F., Jannuzi, B.T., Liebert, J., Smith, P.S. & Fink, H. 1993 AJ 106, 1729. Gabuzda, D.C., Cawthorne, T.V., Roberts, D.H. & Wardle, J.F.C. 1992 ApJ 388, 40. Georganopoulos, M. & Marscher, A.P. 1998 ApJ 506, 621. Giommi, P., Menna, M. T. & Padovani, P. 1999 MNRAS 310, 465. Giommi, P. & Padovani, P. 1994 MNRAS 268, L51. Heidt, J., Nilsson, K., Pursimo, T., Takalo, L.O. & Sillanpää, A. 1996 A&A 312, L13. Jannuzi, B.T. 1990, PhD dissertation, Univ. of Arizona. Jannuzi, B.T., Smith, P.S. & Elston, R. 1993 ApJS 85, 265. Jannuzi, B.T., Smith, P.S. & Elston, R. 1994 ApJ 428, 130. Kollgaard, R.I., Wardle, J.F.D., Roberts, D.H. & Gabuzda, D.C. 1992 AJ 104, 1687. Kühr, H., Witzel, A., Pauliny-Toth, I.I.K. & Nauber, U. 1981 A&AS 45, 367. Lanzetta, K.M., Turnshek, D.A. & Sandoval, J. 1993 ApJ 84, 109. Lara, L., Cotton, W.D., Feretti, L., Giovannini, G., Venturi, T. & Marcaide, J.M. 1997 ApJ 474, 179. Laurent-Muehleisen, S.A., Kollgaard, R.I., Moellenbrock, G.A. & Feigelson, E.D. 1993 AJ 106, 875. Laurent-Muehleisen, S.A., Becker, R.H., Gregg, M.D., Brotherton, M., White, R.L. & Helfand, D.J., 1998 BAAS 193, 2701. Laurent-Muehleisen, S.A., Kollgaard, R.I., Feigelson, E.D., Brinkmann, W. & Siebert, J. 1999 ApJ 525, 127. Lawrence, C.R., Zucker, J.R., Readhead, A.C.S., Unwin, S.C., Pearson, T.J. & Xu, W. 1996 ApJS 107, 541. (L96) Lewis, G.F. & Ibata, R.A. 2000 ApJ 528, 650. Maiolino, R., Rieke, G.H. & Rieke, M.J. 1996 AJ 111, 537. Mannheim, K. 1998 Science 279, 684. Marchã, M.J.M. & Browne, I.W.A. 1995 MNRAS 275, 951. Miller, J.S., French, H.B. & Hawley, S.A. 1978 “Optical Spectra of BL Lac objects” in Pittsburg Conference on BL Lac objects (ed. Wolfe, A.M.) University of Pittsburg Press, p. 176. (M78) Morris, S.L., Stocke, J.T., Gioia, I.M., Schild, R.E., Wolter, A., Maccacaro, T. & Della Ceca, R. 1991 ApJ 380, 49. (M91) Murphy, D.W., Browne, I.W.A. & Perley, R.A. MNRAS 264, 298. (M93) Narayan, R. & Schneider, P. 1990 MNRAS 243, 192. Nass, P., Bade, N., Laurent-Muehleisen, S.A., Reimers, D. & Voges, W. 1996 A&A 309, 419. O’Dea, C.P., Baum, S.A., Stanghellini, C., Dey, A., Van Breugel, W., Deustua, S. & Smith, E. 1992 AJ 104, 1320. (O92) Ostriker, J.P. 1989, in BL Lac objects, ed. L. Maraschi, T. Maccacaro & M.-H. Ulrich (Heidelberg: Springer-Verlag), 420. Ostriker, J.P. & Vietri, M. 1985 Nature 318, 446. Ostriker, J.P. & Vietri, M. 1990 Nature 344, 45. Owen, F.N. & Laing, R.A. 1989 MNRAS 238, 357. Padovani, P. 1992 MNRAS 257, 404. Padovani, P. & Giommi, P. 1995 ApJ 444, 567. Padovani, P. & Urry, C.M. 1992 ApJ 387, 449. Perlman, E.S. & Stocke, J.T. 1993 ApJ 406, 430. (PS93) Perlman, E.S. & Stocke, J.T. 1994 AJ 108, 56. (PS94) Perlman, E.S. Carilli, C.L., Stocke, J.T. & Conway, J. 1996 AJ 111, 1839. Perlman, E.S., Padovani, P. Giommi, P. Sambruna, R. Jones, L.R., Tzioumis, A. & Reynolds, J. 1998 AJ115, 1253. Rao, S.M. & Turnshek, D.A. 2000 ApJS 130, 1. Rector, T.A. 1998, PhD Thesis, University of Colorado. Rector, T.A. & Stocke, J.T. 2002, in prep. Rector, T.A., Stocke, J.T. & Perlman, E.S. 1999 ApJ516, 145. Rector, T.A., Stocke, J.T., Perlman, E.S., Morris, S.L. & Gioia, I.A. 2000 AJ120, 1626. (R00) Sambruna, R.M. Maraschi, L. & Urry, M. 1996 ApJ 463, 444. Scarpa, R. & Falomo, R. 1997 A&A 325, 109. Scarpa, R., Urry, C.M., Falomo, R., Pesce, J.E., Webster, R., O’Dowd, M. & Treves, A. 1999 ApJ 521, 134. Sitko, M.L. & Junkkarinen, V.T. 1985 PASP 97, 1158. Steidel, C.C. & Sargent, W.L.W. 1992 ApJS 80 90. Stickel, M., Fried, J.W. & Kühr, H. 1988a A&A 198, L13. Stickel, M., Fried, J.W. & Kühr, H. 1988b A&A 206, L30. Stickel, M. 1991, in Variability of Active Galaxies, ed. W.J. Duschl, S.J. Wagner & M. Camenzind (Berlin: Springer), 303. Stickel, M., Padovani, P., Urry, C.M., Fried, J.W. & Kühr, H. 1991 ApJ 374, 431. (S91) Stickel, M., Fried, J.W. & Kühr, H. 1993 A&AS 98, 393. (SFK93) Stickel, M., Kühr, H. & Fried, J.W. 1993 A&AS 97, 483. Stickel, M. & Kühr, H. 1993 A&AS 100, 395 (SK93) Stocke, J.T., Burns, J.O. & Christiansen, W.A. 1985 ApJ 299, 799. Stocke, J.T., Morris, S.L., Gioia, I.M., Maccacaro, T., Schild, R., Wolter, A., Fleming, T.A. & Henry, J.P. 1991 ApJS 76, 813. Stocke, J.T. & Rector, T.A. 1997 ApJ 489, L17. (SR97) Stocke, J.T., Wurtz, R.E. & Perlman, E.S. 1995 ApJ 454, 55. Ulrich, M.-H. 1989, in BL Lac Objects, ed. L. Maraschi, T. Maccacaro, & M.-H. Ulrich (Heidelberg: Springer), 45. Ulvestad, J.S. & Johnston, K.J. 1984 AJ 89, 189. Ulvestad, J.S., Johnston, K.J. & Weiler, K.W. 1983 ApJ 266, 18. (UJW83) Urry, C.M., Padovani, P. & Stickel, M. 1991 ApJ 382, 501. Urry, C.M. & Padovani, P. 1995 PASP 107, 803. Urry, C.M. & Shafer, R.A. 1984 ApJ 280, 569. Urry, C.M., Sambruna, R.M., Worrall, D.M., Kollgaard, R.I., Feigelson, E.D., Perlman, E.S., & Stocke, J.T. 1996, ApJ 463, 424. Vermeulen, R.C., Ogle, P.M., Tran, H.D., Browne, I.W.A., Cohen, M.H., Readhead, A.C.S., Taylor, G.B. & Goodrich, R.W. 1995 ApJ 452, 5. Vermeulen, R.C. & Taylor, G.B. 1995 AJ 109, 1983. Wagner, S.J., Witzel, A., Heidt, J., Krichbaum, T.P., Qian, S.J., Quirrenback, A., Wegner, R., Aller, H.D., Aller, M.F., Anton, K., Appenzeller, I., Eckart, A., Kraus, A., Naundorf, C., Kneer, R., Steffen, W. & Zensus, J.A. 1996 AJ 111, 2187. Wall, J.V. & Peacock, J.A. 1985 MNRAS 216, 173. White, G.L., Jauncey, D.K., Savage, A., Wright, A.E., Batty, M.J., Peterson, B.A. & Gulkis, S. 1988 ApJ 327, 561. Wilkes, B.J. 1986 MNRAS 218, 331. Wills, D. & Lynds, R. 1978 ApJS 36, 317. Wills, D. & Wills, B.J. 1976 ApJS 31, 143. Wrobel, J.M. & Lind, K.R. 1990 ApJ 348, 135. (WL90) Wurtz, R., Stocke, J.T. & Yee, H.K.C. 1996 ApJS 103, 109. Zabludoff, A.I., Geller, M.J., Huchra, J.P. & Vogeley, M.S. 1993 AJ 106, 1273. Zensus, J.A. 1989, in BL Lac objects, ed. L. Maraschi, T. Maccacaro & M.-H. Ulrich (Heidelberg: Springer-Verlag), 3.
- (1)


![[Uncaptioned image]](/html/astro-ph/0105100/assets/x3.png)
![[Uncaptioned image]](/html/astro-ph/0105100/assets/x4.png)
![[Uncaptioned image]](/html/astro-ph/0105100/assets/x5.png)
![[Uncaptioned image]](/html/astro-ph/0105100/assets/x6.png)
![[Uncaptioned image]](/html/astro-ph/0105100/assets/x7.png)
![[Uncaptioned image]](/html/astro-ph/0105100/assets/x8.png)
![[Uncaptioned image]](/html/astro-ph/0105100/assets/x9.png)
![[Uncaptioned image]](/html/astro-ph/0105100/assets/x10.png)
![[Uncaptioned image]](/html/astro-ph/0105100/assets/x11.png)
![[Uncaptioned image]](/html/astro-ph/0105100/assets/x12.png)
![[Uncaptioned image]](/html/astro-ph/0105100/assets/x13.png)
![[Uncaptioned image]](/html/astro-ph/0105100/assets/x14.png)
![[Uncaptioned image]](/html/astro-ph/0105100/assets/x15.png)
![[Uncaptioned image]](/html/astro-ph/0105100/assets/x16.png)
![[Uncaptioned image]](/html/astro-ph/0105100/assets/x17.png)
![[Uncaptioned image]](/html/astro-ph/0105100/assets/x18.png)
![[Uncaptioned image]](/html/astro-ph/0105100/assets/x19.png)
![[Uncaptioned image]](/html/astro-ph/0105100/assets/x20.png)
![[Uncaptioned image]](/html/astro-ph/0105100/assets/x21.png)
![[Uncaptioned image]](/html/astro-ph/0105100/assets/x22.png)
![[Uncaptioned image]](/html/astro-ph/0105100/assets/x23.png)
![[Uncaptioned image]](/html/astro-ph/0105100/assets/x24.png)
![[Uncaptioned image]](/html/astro-ph/0105100/assets/x25.png)
![[Uncaptioned image]](/html/astro-ph/0105100/assets/x26.png)

![[Uncaptioned image]](/html/astro-ph/0105100/assets/x29.png)
![[Uncaptioned image]](/html/astro-ph/0105100/assets/x30.png)
![[Uncaptioned image]](/html/astro-ph/0105100/assets/x31.png)
![[Uncaptioned image]](/html/astro-ph/0105100/assets/x32.png)
![[Uncaptioned image]](/html/astro-ph/0105100/assets/x33.png)
![[Uncaptioned image]](/html/astro-ph/0105100/assets/x34.png)
![[Uncaptioned image]](/html/astro-ph/0105100/assets/x35.png)
![[Uncaptioned image]](/html/astro-ph/0105100/assets/x36.png)

![[Uncaptioned image]](/html/astro-ph/0105100/assets/x38.png)

![[Uncaptioned image]](/html/astro-ph/0105100/assets/x40.png)
![[Uncaptioned image]](/html/astro-ph/0105100/assets/x41.png)

![[Uncaptioned image]](/html/astro-ph/0105100/assets/x43.png)
![[Uncaptioned image]](/html/astro-ph/0105100/assets/x44.png)
![[Uncaptioned image]](/html/astro-ph/0105100/assets/x45.png)


| Dates of | SNR | |
|---|---|---|
| Object | Observation | () |
| 0048–097 | 18,20 Nov 95, 14 Aug 96, 23 Nov 00 | 200, 100, 100 |
| 0138–097 | 19,21 Nov 95, 15 Aug 96 | 80 |
| 0454+844 | 7 Apr 95, 18-21 Nov 95, 23 Nov 00 | 40, 20 |
| 0716+714 | 5 Apr 95, 20 Nov 95, 22 Nov 00 | 250, 300, 300 |
| 0735+178 | 4,6 Apr 95, 20 Nov 95, 23 Nov 00 | 200, 100 |
| 0814+425 | 4 Apr 95, 21 Nov 95, 22 Nov 00 | 50, 40, 30 |
| 0828+493 | 6,7 Apr 95, 19 Nov 95 | 20 |
| 0954+658 | 5,7 Apr 95, 21 Nov 95 | 250 |
| 1147+245 | 4,6 Apr 95 | 200 |
| 1519–273 | 4-8 Apr 95 | 30 |
| 1749+701 | 4 Apr 95, 15 Aug 96 | 100, 100 |
| 1803+784 | 5 Apr 95, 15 Aug 96 | 200 |
| 1823+568 | 6,7 Apr 95, 15 Aug 96 | 20 |
| 2029+121 | 18,19 Nov 95, 15 Aug 96 | 100 |
| 2131–021 | 20,21 Nov 95 | 20 |
| 2150+173 | 18,19 Nov 95, 15 Aug 96 | 20, 25 |
| Dates of | IR | SNR | Min | |
|---|---|---|---|---|
| Object | Observation | Band(s) | () | () |
| 0454+844 | 26 Nov 96 | 20 | 20 | |
| 0716+714 | 24, 25 Nov 96 | 30 | 15 | |
| 16 Feb 97 | 30 | 15 | ||
| 0735+178 | 24 Nov 96 | 10 | 40 | |
| 0814+425 | 15 Feb 97 | 10 | 50 | |
| 0851+202 | 25 Nov 96 | 80 | 7 | |
| 1147+245 | 15, 16 Feb 97 | 10 | 50 | |
| 1749+701 | 26 Nov 96 | 30 | 13 | |
| 2200+420 | 24 Nov 96 | 40 | 10 | |
| 2254+074 | 25 Nov 96 | 15 | 50 |
| Object11Objects marked with a star have exhibited emission line(s) with rest Å in one or more epochs. | References22References: This paper (RS01); Browne et al. 1993 (B93); Carswell et al. 1974 (C74); Drinkwater et al. 1997 (D97); Falomo et al. 1987 (F87); Falomo 1991 (F91); Lawrence et al. 1996 (L96); Miller et al. 1978 (M78); Stickel, Fried & Kühr 1993 (SFK93); Stocke & Rector 1997 (SR97) | ||
|---|---|---|---|
| 0048–097 | |||
| 0118–272 | 0.559 | F91 | |
| 0138–097 | 0.733 | 0.501 | RS01, SR97 |
| 0218+357 | 0.940: | 0.686 | B93 |
| 0235+164 | 0.940 | 0.852 | SFK93 |
| 0.524 | |||
| 0426-380 | 1.030 | SFK93 | |
| 0454+844 | 1.340 | SR97 | |
| 0537–441**footnotemark: | 0.896 | SFK93 | |
| 0716+714 | |||
| 0735+178 | 0.424 | C74 | |
| 0814+425 | RS01 | ||
| 0820+225 | 0.951: | SFK93 | |
| 0823+033 | 0.506: | SFK93 | |
| 0828+493 | 0.548: | RS01, SFK93 | |
| 0851+202**footnotemark: | 0.306 | SFK93 | |
| 0954+658 | 0.367 | RS01, L96 | |
| 1144–379 | 1.048 | SFK93 | |
| 1147+245 | |||
| 1308+326**footnotemark: | 0.997 | SFK93 | |
| 1418+546 | 0.152 | SFK93 | |
| 1514–241 | 0.049 | M78 | |
| 1519–273 | |||
| 1538+149 | 0.605 | SFK93 | |
| 1652+398 | 0.033 | SFK93 | |
| 1749+701 | 0.770 | L96 | |
| 1749+096**footnotemark: | 0.320 | SFK93 | |
| 1803+784 | 0.684 | RS01, L96 | |
| 1807+698 | 0.051 | SFK93 | |
| 1823+568 | 0.664 | L96 | |
| 2007+777 | 0.342 | SFK93 | |
| 2005–409 | 0.072 | F87 | |
| 2029+121**footnotemark: | 1.215 | 1.117 | SR97, SK93 |
| 2131–021**footnotemark: | 1.285 | RS01, D97 | |
| 2150+173 | RS01 | ||
| 2200+420**footnotemark: | 0.069 | SFK93 | |
| 2240–260 | 0.774 | SFK93 | |
| 2254+074 | 0.190 | SFK93 | |
| Line | FWHM | (x ) | (x ) | ||||||
|---|---|---|---|---|---|---|---|---|---|
| Object | ID | (Å) | (Å) | (km s-1) | (Å) | (erg s-1 cm-2) | (erg s-1) | ||
| 0048–09711See discussion of this source in §3. | 6092 | 960 | -0.3 | 2.7 | |||||
| 0138–097 | 0.733 | [O II] | 3727 | 6460 | 0.733 | 492 | -0.9 | 1.7 | 7.4 |
| [Ne V] | 3426 | 5936 | 0.733 | 561 | -0.6 | 1.1 | 4.8 | ||
| MgII | 2798 | 4857 | 0.736 | 4842 | -2.2 | 4.8 | 20.9 | ||
| CaII | 3933 | 6824 | 0.735 | 1433 | 1.5 | ||||
| CaII | 3968 | 6883 | 0.734 | 1852 | 2.3 | ||||
| 0.500 | MgII | 2798 | 4197 | 0.500 | 1029 | 1.5 | |||
| 0454+844 | 1.340 | MgII | 2796 | 6542 | 1.340 | 323 | 1.03 | ||
| 2803 | 6558 | 1.340 | 374 | 0.75 | |||||
| 0735+178 | 0.424 | FeII | 2344 | 3337 | 0.424 | 454 | 0.65 | ||
| 2587 | 3683 | 0.424 | 376 | 0.37 | |||||
| 2383 | 3392 | 0.424 | 342 | 0.86 | |||||
| 2600 | 3702 | 0.424 | 376 | 0.91 | |||||
| MgII | 2796 | 3982 | 0.424 | 364 | 1.98 | ||||
| 2803 | 3992 | 0.424 | 380 | 1.64 | |||||
| MgI | 2852 | 4063 | 0.424 | 370 | 0.31 | ||||
| 0.000 | CaII | 3934 | 3933 | 0.000 | 294 | 0.30 | |||
| 3968 | 3968 | 0.000 | 283 | 0.24 | |||||
| 0828+49311See discussion of this source in §3. | 0.548: | [O II]: | 3727 | 5770 | 0.548 | 1320 | -6.5 | 6.2 | 13.1: |
| 0954+658 | 0.367 | [O II] | 3727 | 5095 | 0.367 | 712 | -0.3 | 2.6 | 2.1 |
| CaII | 3933 | 5387 | 0.370 | 1687 | 0.4 | ||||
| CaII | 3968 | 5439 | 0.370 | 2493 | 0.5 | ||||
| 1803+784 | 0.684 | MgII | 2798 | 4710 | 0.684 | 3082 | -2.8 | 133 | 487 |
| 1823+568 | 0.664 | C II] | 2326 | 3882 | 0.669 | 3377 | -4.2 | 5.1 | 17.3 |
| MgII | 2798 | 4668 | 0.668 | 3952 | -6.1 | 7.1 | 24.2 | ||
| [O II] | 3727 | 6204 | 0.664 | 652 | -1.7 | 1.8 | 6.1 | ||
| 2029+121 | 1.215 | C IV | 1549 | 3430 | 1.214 | 2921 | -34.8 | 8.6 | 143 |
| C III] | 1909 | 4216 | 1.208 | 1216 | -3.6 | 1.2 | 19.7 | ||
| MgII | 2798 | 6188 | 1.212 | 7757 | -9.2 | 9.2 | 152 | ||
| O III | 3133 | 6946 | 1.217 | 808 | -5.0 | 1.4 | 24.6 | ||
| 2131–021 | 1.285 | C III] | 1909 | 4356 | 1.281 | 1818 | -11.1 | 4.5 | 87.2 |
| MgII | 2798 | 6378 | 1.280 | 3602 | -9.3 | 2.9 | 56.2 | ||
| [O II] | 3727 | 8521 | 1.286 | 690 | -11.8 | 1.4 | 27.1 | ||
| log | log | LLS | FR Class11References: This paper (RS01); Antonucci & Ulvestad 1985 (AU85); Antonucci et al. 1986 (A86a); Antonucci 1986 (A86b); Cassaro et al. 1999 (C99); Murphy et al. 1993 (M93); O’Dea et al. 1992 (O92); Perlman & Stocke 1994 (PS94); Ulvestad, Johnston, & Weiler 1983 (UJW83); Wrobel & Lind 1990 (WL90) | |||||||
|---|---|---|---|---|---|---|---|---|---|---|
| Object | (mJy) | (mJy) | (W Hz-1) | (W Hz-1) | (kpc) | (R) | (O) | (F) | References11References: This paper (RS01); Antonucci & Ulvestad 1985 (AU85); Antonucci et al. 1986 (A86a); Antonucci 1986 (A86b); Cassaro et al. 1999 (C99); Murphy et al. 1993 (M93); O’Dea et al. 1992 (O92); Perlman & Stocke 1994 (PS94); Ulvestad, Johnston, & Weiler 1983 (UJW83); Wrobel & Lind 1990 (WL90) | |
| 0048–097 | 537 | 139.0 | 3.9 | 2 | 1: | 2: | RS01 | |||
| 0118–272 | 742 | 168 | 4.4 | 2 | 2 | 2 | C99 | |||
| 0138–097 | 457 | 41.5 | 26.99 | 25.83 | 11.0 | 205.5 | 2 | 2 | 2 | RS01 |
| 0218+35722A+C array | 800 | 120 | 27.44: | 26.48: | 6.7 | 253.7: | 2: | 2: | 2: | O92 |
| 0235+164 | 972 | 31.4 | 27.53 | 25.98 | 31.0 | 129.3 | 2 | 2 | 2 | M93 |
| 0426–380 | 624 | 86 | 7.3 | 2 | 2 | 2 | C99 | |||
| 0454+844 | 283 | (25.37) | (34.6) | 2: | 2: | RS01 | ||||
| 0537–441 | 3010 | 220 | 27.98 | 26.71 | 13.7 | 109 | 2 | 2 | 2 | C99 |
| 0716+714 | 315 | 316 | 1.0 | 1: | 1: | A86a | ||||
| 0735+178 | 2773 | 12 | 231 | 2: | 2: | PS94 | ||||
| 0814+425 | 1571 | 65.6 | 23.9 | 2: | 2: | M93 | ||||
| 0820+225 | 1606 | 602.6 | 27.76: | 27.19: | 2.67 | 109.6: | 2 | 2 | 2 | M93 |
| 0823+033 | 1325 | 4.1: | 27.13: | 24.53: | 323 | 151.7: | 1: | 2 | 2 | M93 |
| 0828+493 | 294 | 23.4 | 26.55: | 25.35: | 12.6 | 113.8: | 1: | 1: | 1: | RS01 |
| 0851+202 | 1719 | 17 | 26.82 | 24.76 | 101 | 175.6 | 1 | 2 | 1: | PS94 |
| 0954+658 | 540 | 28.6 | 26.47 | 25.13 | 18.9 | 38.5 | 1 | 1 | 1 | RS01 |
| 1144–379 | 1892 | 20: | 27.92 | 25.79: | 94.6: | 8: | 2: | 2 | 2 | C99 |
| 1147+24533A+B array | 796 | 50 | 15.9 | 2: | 2: | C99 | ||||
| 1308+326 | 1577 | 67.9 | 27.79 | 26.28 | 23.2 | 211.7 | 2 | 2 | 2 | M93 |
| 1418+546 | 1189 | 22.0 | 26.06 | 24.30 | 54 | 122.7 | 1 | 1 | 1 | M93 |
| 1514–24133A+B array | 1652 | 210 | 25.22 | 24.32 | 7.7 | 354 | 1 | 1 | 1 | C99 |
| 1519–273 | 1690 | (23.56) | (4.0) | 1: | 1 | 1 | C99 | |||
| 1538+149 | 1330 | 202.0 | 27.29 | 26.37 | 6.6 | 29.6 | 2 | 2 | 2 | M93 |
| 1652+398 | 1376 | 67 | 24.80 | 23.49 | 20.5 | 26.7 | 1 | 1 | 1 | UJW83 |
| 1749+701 | 720 | 45.7 | 27.23 | 25.91 | 15.8 | 34.2 | 2 | 1 | 1: | RS01 |
| 1749+096 | 1016 | 26.59 | 1: | 1 | 1 | RS01 | ||||
| 1803+784 | 1557 | 68.0 | 27.46 | 25.99 | 22.9 | 445.0 | 2 | 2 | 2 | M93 |
| 1807+698 | 1350 | 990 | 25.18 | 25.03 | 1.36 | 92.7 | 1 | 1 | 1 | AU85,WL90 |
| 1823+568 | 858 | 452 | 27.18 | 26.78 | 1.90 | 195.0 | 2 | 2 | 2 | M93 |
| 2005–489 | 1 | 1 | ||||||||
| 2007+777 | 823 | 28.9 | 26.59 | 25.07 | 28.5 | 217.2 | 1 | 1 | 1 | M93 |
| 2029+121 | 815 | 84.2 | 27.68 | 26.52 | 9.7 | 100.1 | 2 | 2 | 2 | RS01 |
| 2131–021 | 1335 | 194.0 | 27.95 | 26.93 | 6.9 | 181.4 | 2 | 2 | 2 | RS01 |
| 2150+173 | 648 | 36.7 | 17.7 | 1: | 1: | RS01 | ||||
| 2200+42044B array | 3310 | 40 | 25.83 | 23.90 | 82.8 | 86.0 | 1 | 1 | 1 | A86b |
| 2240–260 | 813 | 333 | 27.29 | 26.77 | 2.4 | 212 | 2 | 2: | 2 | C99 |
| 2254+074 | 454 | 17 | 25.83 | 24.37 | 26.7 | 78.7 | 1 | 1 | 1 | AU85 |
| Survey | Subsample | ||
|---|---|---|---|
| 1Jy | 10 | ||
| 1Jy | 13 | ||
| 1Jy | 11 | ||
| EMSS | 13 | ||
| EMSS | 14 | ||
| EMSS | 14 |