A SCUBA survey of the NGC 2068/2071 protoclusters
We report the results of a submillimeter dust continuum survey of the protoclusters NGC 2068 and NGC 2071 in Orion B carried out at m and m with SCUBA on JCMT. The mapped region is in size ( pc 2 pc) and consists of filamentary dense cores which break up into small-scale ( AU) fragments, including 70 starless condensations and 5 circumstellar envelopes/disks. The starless condensations, seen on the same spatial scales as protostellar envelopes, are likely to be gravitationally bound and pre-stellar in nature. Their mass spectrum, ranging from to , is reminiscent of the stellar initial mass function (IMF). Their mass-size relation suggests that they originate from gravitationally-driven fragmentation. We thus argue that pre-collapse cloud fragmentation plays a major role in shaping the IMF.
Key Words.:
ISM: clouds – ISM: structure – dust – Stars: formation – Stars: initial mass function – Submillimeter1 Introduction
The question of the origin of the stellar initial mass function (IMF), crucial for both star formation and Galactic evolution, remains a matter of debate (e.g. Larson 1999; Elmegreen 2001). Numerous molecular line studies of cloud structure have established that the mass spectrum of observed clumps is significantly shallower than the IMF (see, e.g., Williams et al. 2000 and references therein). The reason for this difference is presumably that most of the clumps detected in CO surveys are not gravitationally bound and reflect more the characteristics of the low-density outer parts of clouds than the initial conditions of protostellar collapse (cf. Kramer et al. 1998).
The recent advent of sensitive bolometer arrays on large
(sub)millimeter radiotelescopes has made possible extensive surveys of
nearby star-forming clouds for young protostars and their pre-stellar
precursors (see, e.g., review by André et al. 2000). Using the
MPIfR bolometer array on the IRAM 30 m telescope, Motte et al. (1998
– hereafter MAN98) could identify a total of 58 small-scale
( AU), gravitationally-bound starless condensations in
their 1.3 mm continuum mosaic of the Ophiuchi central cloud.
Remarkably, the mass distribution of these pre-stellar condensations,
which spanned the range to , mimicked the
shape of the stellar IMF. It followed approximately the Salpeter
power-law IMF, , above , and flattened out to at low masses. Interestingly, the position of the break
point at was comparable to the typical Jeans mass in
the dense DCO+ cores of Ophiuchi (cf. Loren et al. 1990).
The results of MAN98 have been essentially confirmed by a m
survey of the same region with SCUBA (Johnstone et al. 2000).
In a related 3 mm interferometric study with OVRO, Testi & Sargent
(1998) identified 26 compact starless condensations between
and in the Serpens main cloud core. They measured a
mass spectrum, again close to
the Salpeter IMF.
These recent results are very promising as they support the view that
the IMF is at least partly determined by fragmentation at the
pre-stellar stage of star formation. However, they are still limited
by small-number statistics and need to be confirmed in other
star-forming clouds.
In this Letter, we report on a wide-field submillimeter continuum
survey of the NGC 2068/2071 region in the Orion B cloud complex.
Orion B, also called L 1630, is the nearest giant molecular cloud
forming high-mass stars (see review by Launhardt & Lada 2001) in the
vicinity of the Sun ( pc). This complex contains five
active regions where rich clusters of young stellar objects (YSOs) are
currently forming within CS dense cores (Lada et al. 1991a,b). The
two northernmost protoclusters, associated with the reflection nebulae
NGC 2068 and NGC 2071, provide good targets to explore the mass
spectrum of pre-stellar condensations over a broad mass range.
2 Observations and data analysis
We used the Submillimetre Common User Bolometer Array (SCUBA – Holland et al. 1999) on the James Clerk Maxwell Telescope (JCMT111JCMT is operated by the JAC, Hawaii, on behalf of the UK PPARC, the Netherlands OSR, and the Canadian NRC.) on 1998 December 15 and 16 to carry out a submillimeter continuum mapping of NGC 2068 and NGC 2071. Five sub-fields were imaged simultaneously at m and m in the standard scan-map mode to produce two mosaics of a field (see Fig. 1). Each sub-field was covered twelve times using three different chop throws in both right ascension and declination. Pointing and calibration checks were made on HL Tau at regular intervals. The zenith atmospheric optical depth was measured to be at m and at m. The FWHM beam size as measured on Uranus was at m and at m. The mosaics were reduced with a SURF script from R. Tilanus using the “Emerson 2” restoration algorithm (Emerson 1995).
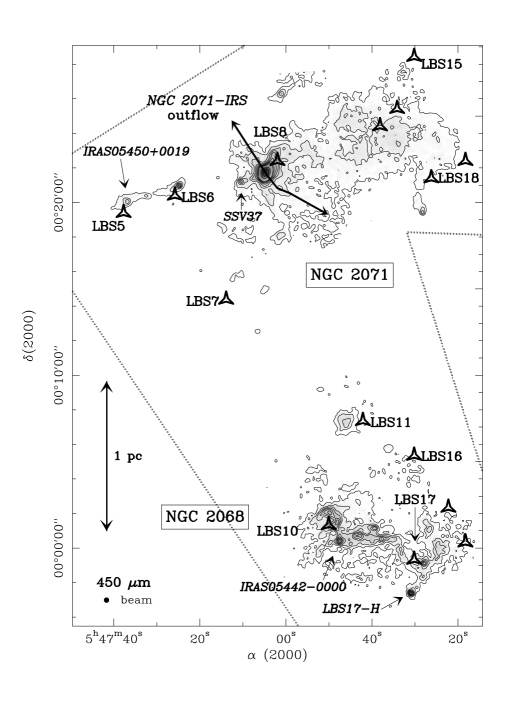
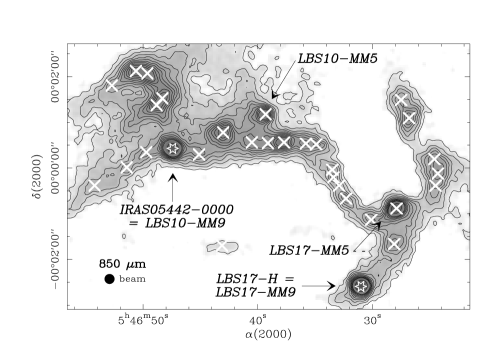
With a spatial extent of 3.7 pc 2.1 pc, our mosaics cover of the region mapped in CS(2–1) by Lada et al. (1991a – hereafter LBS) around NGC 2068/2071. In the submm continuum, the CS dense cores of LBS have a filamentary appearance, with typical dimensions 0.08 pc 0.5 pc (aspect ratio ), and are highly fragmented. Within these extended filaments, a total of 82 condensations with lengthscales characteristic of YSO circumstellar structures (see Table 1, only available in electronic form at http://cdsweb.u-strasbg.fr/A+A.htx, and Fig. 2) were identified using a multiresolution wavelet analysis (cf. Starck et al. 1998; MAN98; and Motte & André 2001). The outer sizes of the condensations were estimated from their radial intensity profiles at m. The ambient background observed on larger lengthscales was then subtracted to allow a proper derivation of the integrated flux densities of the condensations (see MAN98). Unlike the filaments, the (resolved) condensations are roughly circular (mean aspect ratio ) with an average deconvolved FWHM diameter of (i.e. AU).
Our m mosaic (e.g. Fig. 2) mainly traces optically thin thermal dust emission from cold, dense structures in the cloud. The map contours should thus primarily reflect the column density distribution of dust and gas. The condensation masses were estimated from the integrated m fluxes (cf. MAN98), adopting recommended values for the dust opacity per unit mass column density (of dust and gas): for protostellar envelopes and for starless condensations (cf. Henning et al. 1995). The dust temperature was taken to be K and K, respectively, in agreement with published temperatures (Harju et al. 1993; Gibb & Little 2000). Under these assumptions, our 5 column density sensitivity is cm-2. The condensations have masses ranging from to ( for NGC 2071-IRS), with a factor absolute uncertainty. The average density of the condensations is while that of the filaments is .
The m emission of seven condensations identified in the vicinity of the luminous embedded infrared source NGC 2071-IRS (e.g. Harvey et al. 1979) may not arise only from dust. NGC 2071-IRS (called LBS8-MM18 in Table 1) drives a prominent bipolar flow (e.g. Chernin & Masson 1992), which is responsible for a northeast-southwest ridge of broad-band m emission. The spectral index observed between m and m in this ridge is atypical: (where ) instead of as measured for the extended emission outside the ridge. Based on the CO(3–2) and HCO+(4–3) maps of Chernin & Masson (1992) and Girart et al. (1999), we estimate that line emission may contribute up to of the SCUBA m emission in the outflow region. We are, however, confident that the 75 other condensations represent genuine dust continuum sources. Many of them are detected at both m and m (cf. Figs. 1 and 2).
3 Characteristics of the condensations
Among the 75 dust condensations of Sect. 2, four are associated with
both point-like mid-IR sources detected by ISOCAM (in the ISO core
programme – e.g. Olofsson et al. 2000) and near-IR sources
(e.g. Strom et al. 1976). These four objects most likely correspond
to circumstellar envelopes and/or disks around embedded YSOs. In
addition, the condensation called LBS17-MM9 in Table 1 coincides with
the Class 0 outflow driving source LBS17-H of Gibb & Little (2000).
The remaining 70 condensations appear to be truly starless. Several
of them are seen in absorption by ISOCAM against the diffuse, ambient
mid-IR background (Bontemps et al. in prep.), which is reminiscent of
isolated pre-stellar cores (Bacmann et al. 2000).
Six submillimeter condensations (5 starless sources plus the Class 0
envelope LBS17-H) have been mapped in high-density molecular tracers
with good () angular resolution (e.g. Gibb et
al. 1995). Comparing the virial masses estimated by Gibb et al. from
HCO+(3–2) observations with the masses derived here from the submm
continuum, we find . This
suggests that the condensations are close to virial equilibrium,
although more extensive spectroscopic observations in an optically
thin line tracer would be required to draw definitive conclusions.
Fig. 3 shows the cumulative mass spectrum ( vs. ) of the 70 starless condensations identified in NGC 2068/2071. The mass spectrum for the 30 condensations of the NGC 2068 sub-region (cf. Fig. 2) is very similar in shape. The best-fit power-law is above , which is close to the Salpeter IMF, . A flattening of the mass distribution to is apparent below in Fig. 3. The break point is, however, close to our completeness limit at ( detection level for the largest condensations with – see Fig. 4). Altogether, the derived mass spectrum is in good agreement with the IMF of field stars which, in cumulative form, scales roughly as a at low masses () and steepens to for (e.g. Scalo 1998). By contrast, this mass spectrum is much steeper than the power-law measured by LBS and Kramer et al. (1996) in their CS and CO studies of Orion B. The latter is rejected by a Kolmogorov-Smirnov test at the confidence level.

Fig. 4 compares the mass-size relations derived for the (sub)mm continuum condensations of the NGC 2068/2071 and Oph protoclusters (from this paper and MAN98, respectively) with those found for CO clumps in various clouds (e.g. Heithausen et al. 1998). It can be seen that the (sub)mm continuum condensations are more than one order of magnitude denser than typical CO clumps. The mass-size relation of the submillimeter condensations spans only one decade in size and is much flatter than that of CO clumps: a formal fitting analysis gives as opposed to . Although the observed correlations may be partly affected by size-dependent detection thresholds (cf. Fig. 4), it is worth pointing out that they are suggestive of a change from a turbulence-dominated to a gravity-dominated regime. Indeed, while the Larson law is consistent with the fractal, turbulent nature of molecular clouds (e.g. Elmegreen & Falgarone 1996), a linear correlation () is expected for a sample of self-gravitating isothermal Bonnor-Ebert condensations assuming a uniform temperature and a range of external pressures (cf. Bonnor 1956 and Fig. 4). Most CO clumps are transient structures associated with low density contrasts and probably arise from hierarchical fragmentation driven by turbulence (e.g. Elmegreen & Falgarone 1996). The starless condensations identified here are much more centrally concentrated and clearly require the additional effects of self-gravity. Their properties (e.g. Fig. 3 and Fig. 4) make them excellent candidates for being the immediate progenitors of accreting (Class 0/Class I) protostars.

4 Conclusions: Origin of the IMF in clusters
The results of Sect. 3 suggest that the 70 starless condensations identified in the NGC 2068/2071 protoclusters are about to form stars on a one-to-one (or perhaps one-to-two) basis, with a high () efficiency roughly independent of mass. They confirm the findings of MAN98 and Testi & Sargent (1998) in Ophiuchi and Serpens. There is now a growing body of evidence that the fragmentation of dense () cores into compact, self-gravitating condensations determines the IMF of star clusters in the low- to intermediate-mass range (). A plausible scenario, supported by some numerical simulations of cluster formation (Klessen & Burkert 2000; Padoan et al. 2001), could be the following. First, cloud turbulence generates a field of density fluctuations, a fraction of them corresponding to self-gravitating fragments. Second, these fragments (or “kernels”) decouple from their turbulent environment (e.g. Myers 1998) and collapse to protostars after little interaction with their surroundings.
The fact that none of the NGC 2068/2071 pre-stellar condensations is found more massive than is statistically consistent with a Salpeter-like mass distribution, given the relatively small number of objects. A more extensive submillimeter mapping of the Orion B complex should be done to improve the statistics and search for starless condensations of higher mass. However, massive stars may not form from the collapse of single condensations but from the merging of several pre-/proto-stellar condensations of low to intermediate mass. In the collision scenario of Bonnell et al. (1998), the cluster crossing time must be short enough to allow individual condensations to collide and coalesce with one another. Follow-up dynamical studies of the NGC 2068/2071 condensations in dense molecular tracers could help decide whether they have the potential to form massive stars with .
Acknowledgements.
We would like to thank Jason Kirk for his participation during the observing run.References
- (1) André, P., Ward-Thompson, D., Barsony, M. 2000, in Protostars & Planets IV, ed. V. Mannings, A. Boss, & S. Russell (Tucson: Univ. Arizona Press), p. 59
- (2) Bacmann, A., André, P., Puget, J.-L., Abergel, A., Bontemps, S., & Ward-Thompson, D. 2000, A&A, 361, 555
- (3) Bonnell, I. A., Bate, M. R., & Zinnecker, H. 1998, MNRAS, 298, 93
- (4) Bonnor, W. B. 1956, MNRAS, 116, 351
- (5) Chernin, L. M., & Masson, C. R. 1992, ApJ, 396, L35
- (6) Elmegreen, B. G. 2001, in ASP Conf. Ser., From Darkness to Light, ed. T. Montmerle & Ph. André, in press
- (7) Elmegreen, B. G., & Falgarone, E. 1996, ApJ, 471, 816
- (8) Emerson, D. T. 1995, in ASP Conf. Ser. 75, Multi-Feed Systems for Radio Telescopes, ed. D. Emerson, & J. Payne, 309
- (9) Gibb, A. G., & Little, L. T. 2000, MNRAS, 313, 663
- (10) Gibb, A. G., Little, L. T., Heaton, B. D., Lehtinen, K. K. 1995, MNRAS, 277, 341
- (11) Girart, J. M., Ho, P. T. P., Rudolph, A. L., Estalella, R., Wilner, D. J., Chernin, L. M. 1999, ApJ, 522, 921
- (12) Harju, J., Walmsley, C. M., & Wouterloot, J. G. A. 1993, A&AS, 98,51
- (13) Harvey, P. M., Campbell, M. F., Hoffmann, W. F., Thronson, H. A., & Gatley, I. 1979, ApJ, 229, 990
- (14) Heithausen, A., Bensch, F., Stutzki, J., Falgarone, E., Panis, J.-F. 1998, A&A, 331, L65
- (15) Henning, Th., Michel, B., & Stognienko, R. 1995, Planet. Space Sci., 43, 1333
- (16) Holland, W. S., Robson, E. I., Gear, W. K., et al. 1999, MNRAS, 303, 659
- (17) Johnstone, D., Wilson, C. D., Moriarty-Schieven, G., et al. 2000, ApJ, 545, 327
- (18) Klessen, R. S., & Burkert, A. 2000, ApJS, 128, 287
- (19) Kramer, C., Stutzki, J., Winnewisser, G. 1996, A&A, 307, 915
- (20) Kramer, C., Stutzki, J., Rohrig, R., & Corneliussen, U. 1998, A&A, 329, 249
- (21) Lada, E. A., Bally, J., Stark, A. A. 1991a, ApJ, 368, 432 (LBS)
- (22) Lada, E. A., DePoy, D., Evans, N. J., II, Gatley, I., 1991b, ApJ, 371, 171
- (23) Larson, R. B. 1999, in Star Formation 1999, ed. T. Nakamoto (Nobeyama: NRO), p. 336
- (24) Launhardt, R., & Lada, E. A. 2001, in The Orion complex revisited, ed. M. J. McCaughrean, in press
- (25) Loren, R. B., Wootten, A., Wilking, B. A. 1990, ApJ, 365, 269
- (26) Motte, F., André, P. 2001, in ASP Conf. Ser., From Darkness to Light, ed. T. Montmerle & Ph. André, in press
- (27) Motte, F., André, P., & Neri, R. 1998, A&A, 336, 150 (MAN98)
- (28) Myers, P. C. 1998, ApJ, 469, L109
- (29) Olofsson, G., Kaas, A. A. Bontemps, S. et al. 2000, in ESA SP-445, Star formation from the small to the large scale, ed. F. Favata et al., p. 201
- (30) Padoan, P., Nordlund, Å, Rögnvaldsson, Ö. E., & Goodman, A. 2001, in ASP Conf. Ser., From Darkness to Light, ed. T. Montmerle & Ph. André, in press
- (31) Salpeter, E. E. 1955, ApJ, 121, 161
- (32) Scalo, J. M. 1998, in ASP Conf. Ser. 142, The Stellar Initial Mass Function, ed. G. Gilmore & D. Howell, 201
- (33) Starck, J.-L., Murtagh, F., & Bijaoui, A. 1998, Image Processing and Data Analysis: The Multiscale Approach, Cambridge: Cambridge Univ. Press
- (34) Strom, K. M., Strom, S. E., & Vrba, F. J. 1976, AJ, 81, 308
- (35) Testi, L., Sargent, A. I. 1998, ApJ, 508, L91
- (36) Williams, J. P., Blitz, L., McKee, C. F. 2000, in Protostars & Planets IV, ed. V. Mannings, A. Boss, & S. Russell (Tucson: Univ. Arizona Press), p. 97
| Condensation | Coordinates (1) | (2) | FWHM (3) | (4) | Comments | ||
| Name | [mJy] | [AUAU] | [] | (5) | |||
| LBS18-MM1 | 05:46:28.2 | 00:19:29 | 3.80 | 3.0 | |||
| LBS18-MM2 | 05:46:28.5 | 00:21:41 | 550 | 1.40 | 4.0 | ||
| LBS18-MM3 | 05:46:29.5 | 00:20:16 | 790 | 2.00 | 3.0 | ||
| LBS18-MM4 | 05:46:30.0 | 00:19:52 | 250 | 0.65 | 3.0 | ||
| LBS15-MM4 | 05:46:37.7 | 00:27:04 | 150 | 0.40 | 3.0 | ||
| LBS8-MM1 | 05:46:55.0 | 00:23:25 | 500 | 1.25 | 3.5 | ||
| LBS8-MM2 | 05:46:57.1 | 00:20:10 | 490 | 1.25 | 3.0 | ||
| LBS8-MM3 | 05:46:57.1 | 00:23:56 | 320 | 0.80 | 3.5 | ||
| LBS8-MM4 | 05:46:58.2 | 00:20:12 | 210 | 0.55 | 3.0 | ||
| LBS8-MM5 | 05:46:58.4 | 00:24:34 | 150 | 0.40 | 3.5 | ||
| LBS8-MM6 | 05:46:59.8 | 00:20:26 | 160 | 3.0 | line contamination of | ||
| LBS8-MM7 | 05:47:00.3 | 00:20:35 | 180 | 3.0 | line contamination of | ||
| LBS8-MM8 | 05:47:01.0 | 00:26:19 | 5.30 | 3.0 | |||
| LBS8-MM9 | 05:47:01.1 | 00:20:37 | 130 | unresolved | 3.0 | line contamination of | |
| LBS8-MM10 | 05:47:01.7 | 00:18:03 | 2.85 | 3.5 | |||
| LBS8-MM11 | 05:47:02.0 | 00:20:45 | 250 | 3.0 | line contamination of | ||
| LBS8-MM12 | 05:47:02.7 | 00:22:55 | 270 | 0.70 | 3.5 | ||
| LBS8-MM13 | 05:47:03.2 | 00:19:40 | 110 | unresolved | 0.30 | 4.0 | |
| LBS8-MM14 | 05:47:03.3 | 00:22:35 | 400 | 1.00 | 3.5 | ||
| LBS8-MM15 | 05:47:03.6 | 00:19:54 | 110 | unresolved | 0.30 | 4.0 | |
| LBS8-MM16 | 05:47:03.6 | 00:20:08 | 210 | 0.55 | 4.0 | ||
| LBS8-MM17 | 05:47:04.2 | 00:20:23 | 140 | unresolved | 0.35 | 4.0 | |
| LBS8-MM18 | 05:47:04.7 | 00:21:45 | 9.20 | 3.5 | NGC2071-IRS envelope, K | ||
| LBS8-MM19 | 05:47:06.4 | 00:22:36 | 540 | 3.0 | line contamination of | ||
| LBS8-MM20 | 05:47:07.5 | 00:22:46 | 210 | 2.5 | line contamination of | ||
| LBS8-MM21 | 05:47:07.9 | 00:25:07 | 210 | 0.55 | – | ||
| LBS8-MM22 | 05:47:08.2 | 00:22:52 | 220 | unresolved | 2.5 | line contamination of | |
| LBS8-MM23 | 05:47:10.4 | 00:21:15 | 1.10 | 3.5 | SSV37 envelope, K | ||
| LBS8-MM24 | 05:47:10.7 | 00:22:29 | 110 | unresolved | 0.30 | 3.5 | |
| LBS8-MM25 | 05:47:11.9 | 00:22:45 | 150 | unresolved | 0.40 | 3.5 | |
| LBS8-MM26 | 05:47:12.4 | 00:23:27 | 150 | 0.40 | 3.0 | ||
| LBS8-MM27 | 05:47:12.6 | 00:22:23 | 530 | 1.35 | 3.0 | ||
| LBS6-MM1 | 05:47:14.3 | 00:21:30 | 125 | unresolved | 0.30 | 3.0 | |
| LBS6-MM2 | 05:47:16.0 | 00:21:24 | 2.65 | – | |||
| LBS6-MM3 | 05:47:17.2 | 00:21:27 | 150 | unresolved | 0.40 | – | |
| LBS6-MM4 | 05:47:24.9 | 00:20:59 | 4.20 | 3.0 | |||
| LBS6-MM5 | 05:47:25.1 | 00:18:49 | 410 | 1.05 | 3.0 | ||
| LBS6-MM6 | 05:47:26.2 | 00:19:56 | 540 | 1.35 | 3.0 | ||
| LBS6-MM7 | 05:47:26.5 | 00:20:45 | 320 | 0.80 | 3.0 | ||
| LBS6-MM8 | 05:47:29.8 | 00:20:39 | 330 | 0.85 | 3.5 | ||
| LBS5-MM1 | 05:47:32.5 | 00:20:24 | 610 | 1.55 | 3.5 | ||
| LBS5-MM2 | 05:47:35.1 | 00:20:21 | 260 | 0.65 | 3.5 | ||
| LBS5-MM3 | 05:47:36.9 | 00:20:07 | 760 | 0.60 | 3.5 | 05450+0019 envelope, K | |
| LBS16-MM1 | 05:46:36.3 | 00:05:49 | 500 | 1.25 | 3.5 | ||
| LBS11-MM1 | 05:46:45.3 | 00:07:31 | 540 | 1.35 | 3.5 | ||
| LBS11-MM2 | 05:46:46.1 | 00:07:09 | 580 | 1.45 | 3.5 | ||
| LBS11-MM3 | 05:46:47.3 | 00:07:27 | 420 | 1.05 | 3.5 | ||
| LBS7-MM1 | 05:47:04.9 | 00:14:59 | 2.55 | 3.5 | |||
| LBS7-MM2 | 05:47:05.2 | 00:13:21 | 200 | 0.50 | – | ||
| LBS7-MM3 | 05:47:06.7 | 00:12:35 | 3.00 | 3.0 | |||
| LBS7-MM4 | 05:47:15.3 | 00:18:42 | 300 | 0.75 | 3.5 | ||
| Condensation | Coordinates (1) | (2) | FWHM (3) | (4) | Comments | ||
|---|---|---|---|---|---|---|---|
| Name | [mJy] | [AUAU] | [] | (5) | |||
| LBS17-MM1 | 05:46:24.3 | -00:00:06 | 460 | 1.15 | 4.0 | ||
| LBS17-MM2 | 05:46:24.5 | -00:00:22 | 160 | unresolved | 0.40 | 4.0 | |
| LBS17-MM3 | 05:46:24.6 | 00:00:13 | 300 | 0.75 | 4.0 | ||
| LBS17-MM4 | 05:46:26.8 | 00:01:07 | 3.25 | 3.5 | |||
| LBS17-MM5 | 05:46:27.6 | 00:01:31 | 300 | 0.75 | 3.5 | ||
| LBS17-MM6 | 05:46:27.9 | -00:00:52 | 4.30 | 3.5 | |||
| LBS17-MM7 | 05:46:28.1 | -00:01:39 | 760 | 1.90 | 3.5 | ||
| LBS17-MM8 | 05:46:30.1 | -00:01:07 | 340 | 0.85 | 3.5 | ||
| LBS17-MM9 | 05:46:31.0 | -00:02:35 | 3.00 | 3.0 | LBS17-H envelope, K | ||
| LBS17-MM10 | 05:46:32.3 | -00:00:40 | 330 | 0.85 | 4.0 | ||
| LBS17-MM11 | 05:46:32.9 | -00:00:23 | 125 | unresolved | 0.30 | 4.0 | |
| LBS17-MM12 | 05:46:33.4 | -00:00:12 | 180 | unresolved | 0.45 | 4.0 | |
| LBS17-MM13 | 05:46:33.5 | -00:00:02 | 160 | unresolved | 0.40 | 4.0 | |
| LBS10-MM1 | 05:46:34.9 | 00:00:32 | 250 | unresolved | 0.65 | 4.0 | |
| LBS10-MM2 | 05:46:35.8 | 00:00:33 | 260 | 0.65 | 3.5 | ||
| LBS10-MM3 | 05:46:37.7 | 00:00:34 | 990 | 2.50 | 3.5 | ||
| LBS10-MM4 | 05:46:39.1 | 00:00:33 | 120 | unresolved | 0.30 | 4.0 | |
| LBS10-MM5 | 05:46:39.4 | 00:01:11 | 940 | 2.35 | 3.5 | ||
| LBS10-MM6 | 05:46:40.5 | 00:00:34 | 360 | 0.90 | 4.0 | ||
| LBS10-MM7 | 05:46:43.0 | 00:00:47 | 3.50 | 4.0 | |||
| LBS10-MM8 | 05:46:45.1 | 00:00:18 | 230 | 0.60 | 4.0 | ||
| LBS10-MM9 | 05:46:47.4 | 00:00:25 | 1.35 | 3.5 | 05442-0000 envelope, K | ||
| LBS10-MM10 | 05:46:48.4 | 00:01:31 | 410 | 1.05 | 4.0 | ||
| LBS10-MM11 | 05:46:48.9 | 00:01:22 | 370 | 0.95 | 4.0 | ||
| LBS10-MM12 | 05:46:49.7 | 00:00:20 | 165 | unresolved | 0.40 | 4.0 | |
| LBS10-MM13 | 05:46:49.7 | 00:02:04 | 540 | 1.35 | 4.0 | ||
| LBS10-MM14 | 05:46:50.7 | 00:02:07 | 440 | 1.10 | 3.5 | ||
| LBS10-MM15 | 05:46:51.4 | 00:00:00 | 150 | unresolved | 0.40 | 4.0 | |
| LBS10-MM16 | 05:46:52.8 | 00:01:48 | 150 | unresolved | 0.40 | 4.0 | |
| LBS10-MM17 | 05:46:54.2 | -00:00:24 | 310 | 0.80 | 3.5 | ||
| LBS10S-MM1 | 05:46:43.1 | -00:01:42 | 230 | 0.60 | 4.5 | ||
-
(1)
The absolute positional accuracy is better than .
-
(2)
Integrated flux at m estimated (after background subtraction) over an area twice the size of col. [5] when convolved with the 13 beam. The absolute calibration uncertainty is . The typical rms noise is .
-
(3)
Deconvolved FWHM size derived from a 2D-Gaussian fit to the m map after background subtraction.
-
(4)
Mass derived from the m integrated flux of col. [4]. Assumed dust temperature and opacity are K and for starless condensations, K and for protostellar envelopes (see also Sect. 2).
-
(5)
Spectral index (where ) measured between m and m in an beam at the position of each condensation without background subtraction. The typical error bar on is . Since the background emission often dominates and has a spectral index of 4, we estimate that the intrinsic spectral indices of the condensations are lower than the values listed in col. [7] by on average.