A Dynamical Mass Constraint for Pre-Main-Sequence Evolutionary Tracks: The Binary NTT 045251+3016
Abstract
We present an astrometric/spectroscopic orbital solution for the pre-main-sequence binary NTT 045251+3016. Interferometric observations with the HST FGS3 allowed stellar separations as small as 14 mas to be measured. Optical spectra provided 58 radial-velocity measurements of the primary star and near-infrared spectra provided 2 radial-velocity measurements of both the primary and secondary, giving a mass ratio for the binary system. The combination of these data allows the dynamical masses and the distance of the stars to be derived. Our measurements for the primary and secondary masses are 1.45 0.19 M⊙ and 0.81 0.09 M⊙, respectively, and 145 8 pc for the distance of the system, consistent with prior estimates for the Taurus-Auriga star-forming region. The evolutionary tracks of D’Antona & Mazzitelli (1997), Baraffe et al. (1998), and Palla & Stahler (1999) are tested against these dynamical mass measurements. Due to the intrinsic color/ variation within the K5 spectral class, each pre-main-sequence model provides a mass range for the primary. The theoretical mass range derived from the Baraffe et al. (1998) tracks that use a mixing length parameter is closest to our measured primary mass, deviating between 1.3 and 1.6 sigma. The set of Baraffe et al. (1998) tracks that use deviate between 1.6 and 2.1 sigma from our measured primary mass. The mass range given by the Palla & Stahler (1999) tracks for the primary star deviate between 1.6 and 2.9 sigma. The D’Antona & Mazzitelli (1997) tracks give a mass range that deviates by at least 3.0 sigma from our derived primary mass, strongly suggesting that these tracks are inconsistent with our observation. Observations of the secondary are less constraining than those of the primary, but the deviations between the dynamical mass of the secondary and the mass inferred for the secondary from the various pre-main-sequence tracks mirror the deviations of the primary star. All of the pre-main-sequence tracks are consistent with coevality of the components of NTT 045251+3016.
1 Introduction
Pre-main-sequence (PMS) stellar evolution has been extensively modeled in the last decade. Unfortunately, very few PMS stars have provided detailed observational tests of these models, in large part due to the lack of dynamical mass determinations. Recently a precise mass determination has been achieved for the secondary of the eclipsing binary TY CrA (Casey et al. 1998, Corporon et al. 1996, and references therein). Casey et al. tested three sets of evolutionary tracks against the 1.64 M⊙ secondary, and found that all were consistent with the observed physical parameters. Covino et al. (2000) analysed the eclipsing binary RXJ 0529.4+0041 and compared the 1.25 M⊙ primary star and the 0.91 M⊙ secondary star with three sets of evolutionary tracks. They found that the Baraffe et al. (1998) tracks provide the closest agreement with the derived masses of both stars. Stellar masses have also been measured via orbital motions of disk gas (e.g., Guilloteau et al. 1999, Simon et al. 2001). This is currently the only technique available to obtain the mass of a single star, but it is limited by distance uncertainty. Simon et al. (2001) found that PMS evolutionary models that presented cooler Teff (e.g. Baraffe et al. 1998 and Palla & Stahler 1999) provided a better fit with their derived masses of nine PMS stars. Another powerful method for stellar mass determination is the combination of spectroscopic and astrometric observations of a binary star. In addition to all of the orbital elements, the combination of an angular measure of the orbit from astrometry and a linear measure from radial velocities allows an independent determination of the binary distance. This paper describes such a study of the naked T Tauri binary NTT 045251+3016.
NTT 045251+3016 was first discovered with the Einstein X-ray Observatory as an optically visible star associated with an X-ray source. Detailed UBVRIJHKL photometry and optical spectra for the primary star are presented by Walter et al. (1988), who derived a K7 spectral classification for the primary star, and also identified the system as a spectroscopic binary. Improved spectral classification of the primary is discussed in Section 4.1. Based on a mean radial velocity near to that of the Taurus-Auriga association and a Li I 6707Å equivalent width of 0.58Å Walter et al. (1988) identified NTT 045251+3016 as a PMS star.
NTT 045251+3016 is unique among known PMS binaries in that it has an orbit with a short enough period to permit measurable radial-velocity variations of the primary and secondary stars while at the same time being wide enough to spatially resolve the two stars with HST’s Fine Guidance Sensor. We describe here an observational program to obtain both spectroscopic and astrometric data, thereby determining the masses of both PMS stars and the distance to the binary.
2 Observations
2.1 Astrometric
The first interferometric observation of NTT 045251+3016 with the astrometer Fine Guidance Sensor No.3 (FGS3) aboard HST was executed on April 14, 1995. The target was visited on 17 different occasions during the subsequent 3.3-year observing campaign (completed Aug 20, 1998), covering approximately one quadrant of the apparent orbit. The interferometric mode of FGS3 is used to sample the visibility function (VF) produced by the Koester’s prism interferometer as the field-of-view of the unit is driven across the target. For best results, the FGS was commanded to oversample the VF by taking measurements every 0.6 mas (on the sky) during a scan of 1500 mas in length. The scan length used is sufficient, during normal operations, to encompass the sensitivity range of the interferometer, which extends for 20 mas around the line-of-sight to the target. FGS3 is endowed with two Koester’s prisms that provide sensitivity in two orthogonal directions, usually referred to as the FGS X and Y axes (Lupie & Nelan 1998). Therefore, each scan of the target results in two VF’s which are then independently analyzed for signatures other than those characteristic of a suitable single (and point-like) star chosen as template. Deviations from the single-star VF provide measures of the projected separations of the binary at each observing epoch. The comparison with the template also provides two independent estimates of the magnitude difference between the two companions. On-sky separation () and astronomical position angle (PA) are easily derived from the projected separations and telescope attitude data (Bernacca et al. 1993).
Fifteen consecutive scans were taken on each visit to check on scan-to-scan repeatability and for improvement of the S/N. The average S/N ratio of the observed scans is 20, which improved to after merging of the scans (Lattanzi et al. 1997, and references therein). The shape of the visibility curve changes with effective wavelength, which can introduce systematic errors if the color of the template differs significantly from that of the target. To minimize this effect, we selected star SAO185689 ((B-V)=1.5 mag) as the template single star. Among the templates made available by the ST ScI for FGS reductions, this is the star with the color closest to that of our binary (observed (B-V)=1.28 mag).
Fourteen of the 17 visits produced successful measurements of the binary separation and orientation. These measurements are listed in Table 1. The 85% success rate is gratifying given both the small separation ( 3 times smaller than the Airy angular resolution limit at visible light) and the relatively large magnitude difference (more than 2 magnitudes).
The formal error of the projected separations is 1 mas on each axis. However, this error is internal, as it only takes into account the contribution due to the reduction method, which is based on an analytical cross-correlation technique (Bernacca et al. 1993). There are other error sources which are known to be present but are difficult to quantify for each observation. As an example, the epochs of observation of the calibration star are usually quite different (up to 5 months) from the dates of the visits to our target; consequently, the template star might not be the best representation of the FGS signatures at the time of the science observation, as small changes are known to occur even on relatively short time scales. By comparing observations of the template star taken at different times, we have measured variations in the structure of the VF which could increase the separation measurement error to 2-3 mas. Therefore, this is probably a more realistic range for the error of several of the measured projected separations in Table 1. This corresponds to 3-4 mas for the (1 ) error on total separation and to 14∘ for the maximum error in PA.
Table 1 also shows the measurements of the visual magnitude difference between the two companions. The values derived from the independent fits to the X and Y VF’s are generally in good agreement except for the tenth and twelfth measurements. Averaging the results yields 2.2 0.3 mag and 2.3 0.3 mag for the average magnitude differences on the X and Y axes, respectively. Again, these results are consistent with instrument performances expected in a challenging scenario like ours, i.e., small separation and relatively large magnitude difference.
2.2 Optical Radial Velocities
Since 1985 we have monitored the radial velocity of NTT 045251+3016 with the Center for Astrophysics (CfA) Digital Speedometers (Latham 1992). Three nearly identical instruments were used on the Multiple Mirror Telescope and 1.5-m Tillinghast Reflector at the Whipple Observatory atop Mt. Hopkins, Arizona, and on the 1.5-m Wyeth Reflector located in Harvard, Massachusetts. Echelle spectrographs were used with intensified photon-counting Reticon detectors to record about 45 Å of spectrum in a single order centered near 5187 Å, with a resolution of about 8.3 km s-1 and signal-to-noise ratios ranging from 8 to 15 per resolution element.
Radial velocities were derived from the 58 observed optical spectra using the one-dimensional correlation package rvsao (Kurtz & Mink 1998) running inside the IRAF111IRAF (Image Reduction and Analysis Facility) is distributed by the National Optical Astronomy Observatories, which are operated by the Association of Universities for Research in Astronomy, Inc., under contract with the National Science Foundation. environment. The template spectrum was drawn from a new grid of synthetic spectra (Morse & Kurucz, in preparation) calculated using model atmospheres computed using Kurucz’s code ATLAS9. We correlated our observed spectra against a grid of solar metallicity templates and chose the one that gave the highest average peak correlation.
The highest peak correlation averaged over all 58 observed spectra was obtained for K, cm s-2, , and . The heliocentric velocities derived with this template are reported in Table 2, together with the heliocentric Julian date and (O-C) errors. The rms deviation about the orbital solution is 0.7 , typical of CfA precision for late-type dwarfs. An implicit assumption of our analysis is that the spectra of PMS stars can be reliably modeled using normal stellar atmospheres. However, a small template mismatch would not affect significantly the accuracy of the radial-velocity measurements.
We attempted to detect the secondary spectrum in the optical with high S/N observations of NTT 045251+3016 taken in February 1992, near a time of maximum velocity separation, with the Hamilton echelle spectrograph on the 3-m Shane telescope of Lick Observatory. The wavelength region covered was from 3800Å to 9800Å with a S/N of 30. Cross-correlating our high signal-to-noise spectrum with a variety of templates did not reveal the secondary’s spectrum. To test our detection limits, C. Dolan created synthetic double-lined spectra using a narrow-lined K6V spectral standard rotationally broadened to 10 to match the rotationally broadened spectrum of NTT 045251+3016. This primary spectrum was combined with numerous secondary spectra ranging in spectral type (K2V to M2V), in rotational velocities (5 to 50 ), in mass ratios (1.0 to 0.5), and in flux ratios (1.0 to 0.05). Dolan found that to detect the secondary’s spectrum a minimum flux ratio of 0.2 - 0.4 is required, except in cases with extreme rotational broadening ( ) when the secondary becomes undetectable even with a luminosity ratio of 1.0. Thus our non-detection is consistent with our FGS determined magnitude difference of 2.4 mag in V, corresponding to a flux ratio of 0.11.
2.3 Near-Infrared Radial Velocities
Since we were unable to detect the secondary in the optical, we obtained two spectra of the binary with PHOENIX, the KPNO high-resolution near-infrared spectrograph on the 4-m Mayall telescope. Details on this work are given in Mazeh et al. (2000a,b).
The central wavelength of the observations was 1.555m and yielded a free spectral range of ; the effective resolution was 35,000. We also observed a sample of 12 main-sequence spectral-type standards from F6 through M7, in order to provide templates for a two-dimensional cross-correlation analysis using TODCOR (Zucker & Mazeh 1994). We successfully detected the secondary spectrum using spectra of HR 8085 (61 Cyg A; K5) and HR 8086 (61 Cyg B; K7), each rotationally broadened by , as the primary and secondary templates, respectively. The velocities are given in Table 3. Our derived flux ratio at 1.555m is .
To estimate our uncertainty due to template mismatch we used TODCOR to derive the velocity of each template with regard to the other templates. The scatter of these derived velocities is less than . This error is added in quadrature to the estimated uncertainty of the peak location of each spectrum, for a total uncertainty of . The radial velocities of the primary derived from these NIR spectra are consistent to within this uncertainty with the radial velocities predicted by the primary orbital solution at the same epoch, which suggests that our radial-velocity zero-point is also accurate at this level.
3 Orbital Solution
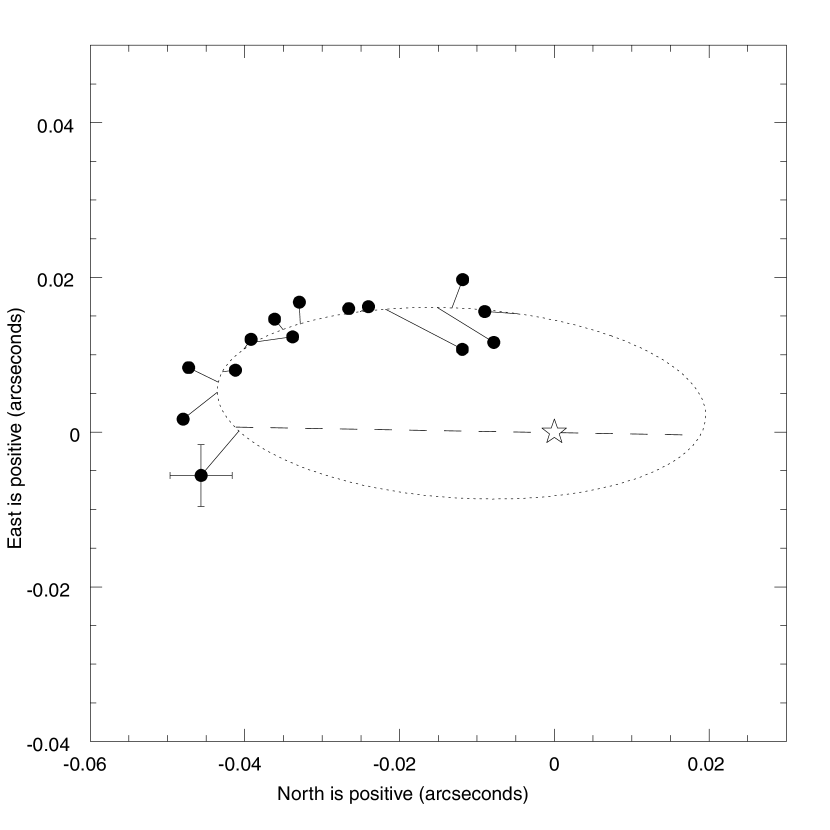
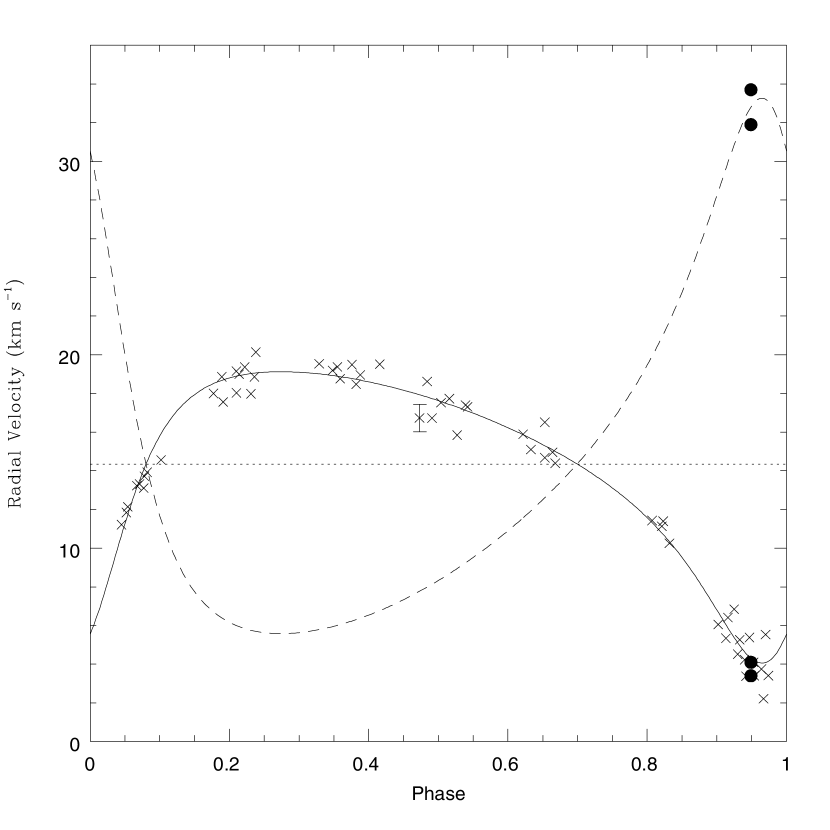
Nine of the relative orbital elements of NTT 045251+3016 were calculated via a simultaneous fit to the relative astrometric and primary radial-velocity data, using a program generously provided by G. Torres. Table 4 shows the orbital elements of the binary NTT 045251+3016. The astrometric and spectroscopic data and orbital solutions are presented in Figures 1 and 2, respectively. Although the orbital solution is solved via a simultaneous fit to both the relative astrometric and primary radial-velocity data, the large number of radial-velocity measurements provide a strong constraint on the elements of the orbital solution that can be calculated with single-lined spectroscopic data (i.e. , , , , , ). Thus, in practice, the orbital parameters that are being determined with the astrometric data are the angular size of the semi-major axis (a(′′)), the position angle of the line of nodes (), and the inclination angle (i).
Furthermore, the only parameter influencing the mass determination which is derived from the astrometric data is the inclination. As can be seen from the orientation of the line of nodes in Figure 1, the inclination is quite well constrained by the phase coverage of these data. The distance to the system, essentially set by the angular semi-major axis, is more sensitive to the partial phase coverage and possible systematic errors in the FGS astrometry.
With detection of the secondary in the near-infrared spectra, the mass ratio, q, was calculated using the calculated radial velocity of the primary from the orbital solution at the time of the near-infrared observations, the center-of-mass velocity of the binary, and the mean of the two measured radial velocities of the secondary which were obtained from IR spectra. This mass ratio, in combination with the 9 known orbital elements, allowed us to calculate the individual masses of the stars in the binary and the distance to the system.
The masses of the primary and secondary stars are given by the equations (Batten 1973):
| (1) |
| (2) |
where is in years and is in km s-1.
We determine the masses of the primary and secondary to be M⊙ and M⊙, respectively. From Equation 1 we find that the largest contributors to the variance of the dynamical mass of the primary are the measurement error associated with the radial velocity of the secondary ( of the variance) and the error on the measurement of the orbital inclination (). The largest contributer to the variance of the secondary’s dynamical mass comes from the error associated with the orbital inclination of the binary (), followed by the error associated with the measured radial velocity of the secondary (). We note that the mass uncertainties associated with our limited number of secondary radial-velocity measurements can be reduced substantially now with additional observations; higher precision astrometry awaits future instrumentation.
The dynamical distance d in parsecs is given by:
| (3) |
where is in arcseconds. Our direct distance measurement to the PMS binary of 145 8 pc agrees with prior distance estimates to the Taurus-Auriga complex based on indirect methods (e.g., 140 10 pc (Kenyon et al. 1994)) and geometric parallax (e.g., pc (Bertout et al. 1999), and pc (Wichmann et al. 1998)). The center-of-mass velocity of the system, , is somewhat lower than the mean radial velocity of the Taurus-Auriga complex (17.4 km s-1; Hartmann et al. 1986), but with an association velocity dispersion of 2 the binary radial velocity is consistent with membership in the association. In this context we also note that the binary is located at the edge of the association in the Auriga subcomplex.
The largest contributor to the variance of the distance to NTT 045251+3016 comes from the error on the measurement of the angular semi-major axis (). Since our astrometric data cover only a little more than one quadrant of the orbit, it does not provide a tight constraint on the measurement of the angular semi-major axis (see Figure 1).
Table 4 summarizes our measured masses and distance to the components of NTT 045251+3016.
4 Comparison with PMS Evolutionary Models
There are now a variety of PMS models that provide the luminosity and effective temperature of a star given its mass and age. The differences between these models lie largely in the choice of opacities, atmospheres, metallicities, and convection models. In principle, a PMS star of known mass, luminosity, effective temperature, and metallicity can distinguish between these differences in stellar physics. NTT 045251+3016 provides such a case.
4.1 The Primary Star
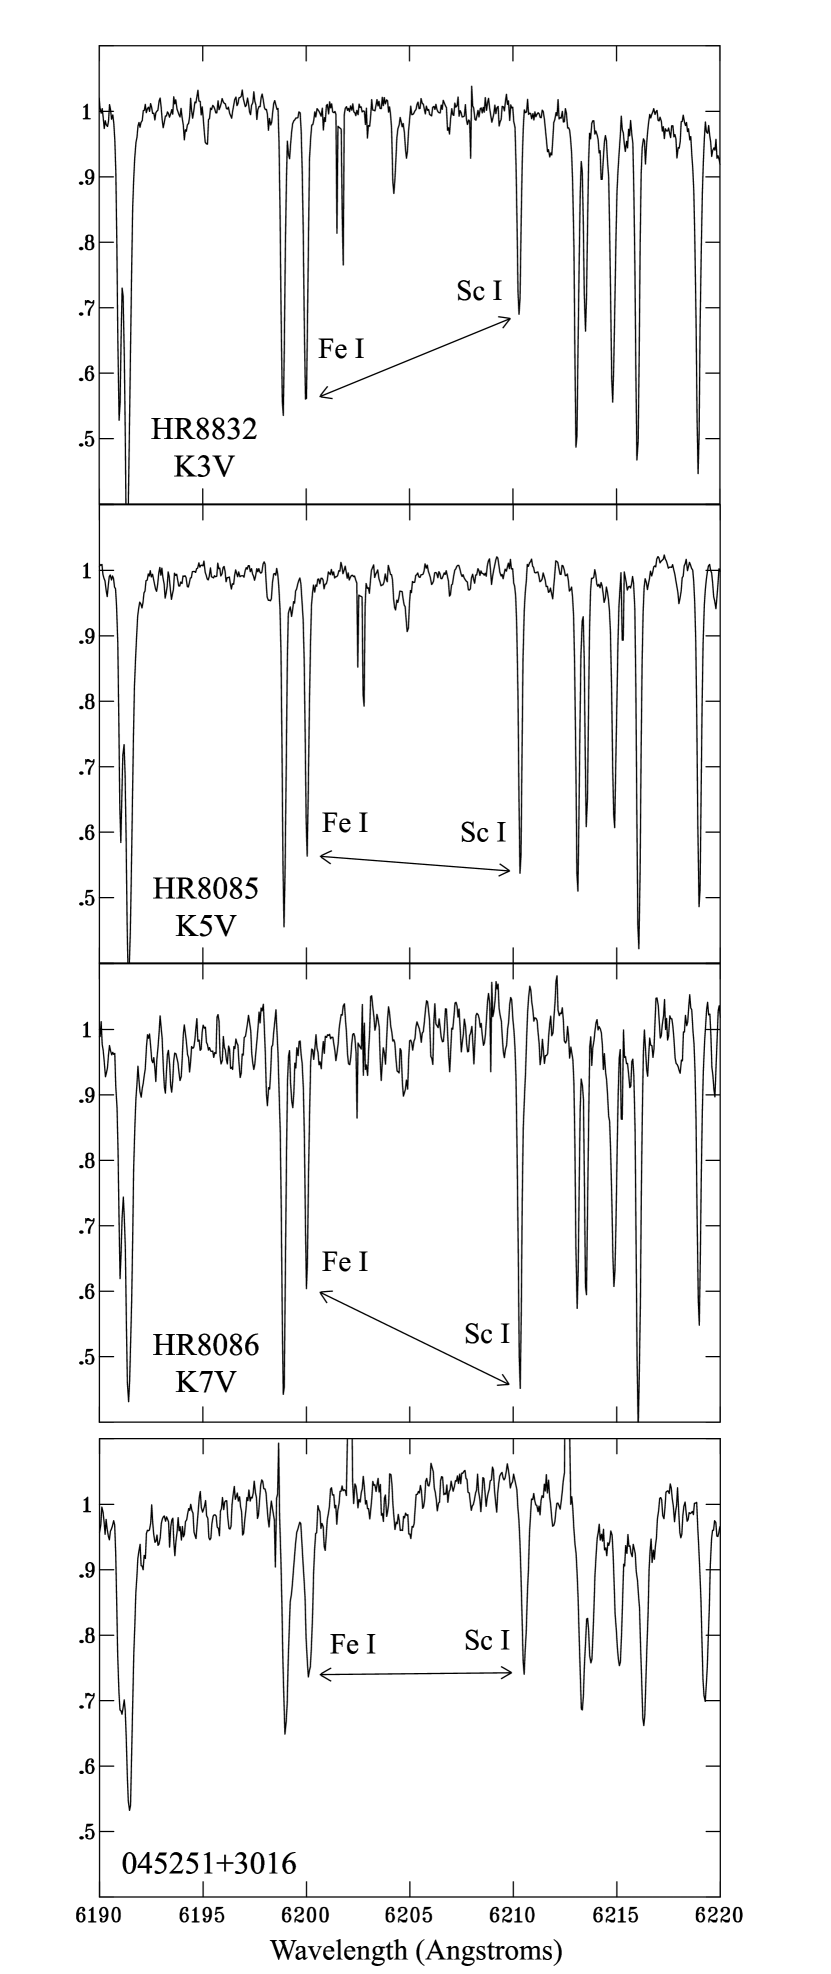
The primary star of NTT 045251+3016 was originally classified as a K7 spectral type (Walter et al. 1988). However, analysis of eight temperature sensitive lines used for spectral classification by Lee (1992) (VI 6040Å FeI 6042Å FeI, 6056Å VI 6058Å NiI 6108Å VI 6112Å FeI 6200Å ScI 6211Å) in our Hamilton echelle spectra clearly point to a K5 classification with an uncertainty of less than one subtype. The FeI and ScI line pair around 6200Å in particular was used by Basri & Batalha (1990) for spectral classification. Figure 3 compares this line pair from our spectra with three spectral standards HR 8832 (K3V), HR 8085 (K5V), and HR 8086 (K7V).
Using the photometry of Walter et al. (1988), the luminosity ratios in V and H, and the intrinsic colors, temperature calibrations, and bolometric corrections from Kenyon & Hartmann (1995), we find for the primary star an effective temperature of 4350 K and a luminosity of 0.75 L⊙. Since we do not have a luminosity ratio in B, and thus could not calculate the B magnitude for the primary and secondary individually, we calculated the extinction in V using two different methods. First we assumed that the secondary did not contribute to the light in the B band, so the B magnitude calculated in Walter et al. (1988) (B=12.88) was the B magnitude of the primary. Using this observed B magnitude and the calculated V magnitude of the primary with the (B-V) color for a K5 dwarf provided by Kenyon & Hartmann (1995) we obtained an , so this method implied no extinction to the star NTT 045251+3016. Alternatively, we assumed the H band is unaffected by extinction and compared the calculated (V-H) for the primary with the (V-H) for a K5 dwarf given in Kenyon & Hartmann (1995), finding a visual extinction of A mag for the primary of NTT 045251+3016. We adopt A mag throughout this paper.
Since there are temperature and color variations within the K5 spectral class we define the range on these parameters by the midpoints between the values given for a K5 type and the values for K3 and K7 types, respectively. These upper and lower limits on temperature or color are shown in Figures 4, 5, & 6 as separate points connected by a solid line. This line represents the maximum error range on temperature/color based on our spectral type uncertainty, not a random error. The smaller distance uncertainties and photometric uncertainties are represented as error bars on each point. Table 5 tabulates these stellar parameters and uncertainties for the primary and secondary (Section 4.2) of NTT 045251+3016.
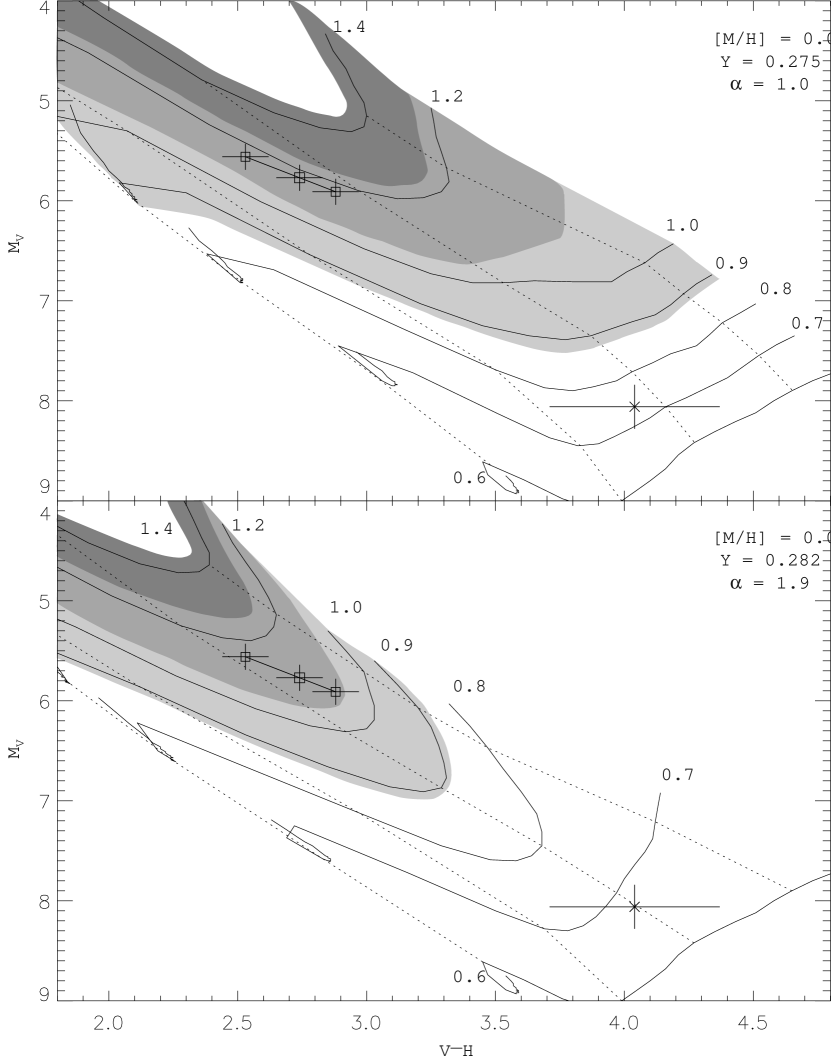
Two sets of Baraffe et al. (1998, BCAH98) tracks are plotted on color-magnitude diagrams (CMDs) with NTT 045251+3016 (Figure 4). Since the solar metallicity template provided the strongest correlation when analyzing the optical spectra, we only test tracks with solar metallicity. BCAH98’s use of the non-grey “NextGen” atmosphere models of Allard and Hauschildt (1997) allows their tracks to be plotted directly on CMD diagrams. The use of non-grey atmosphere models is superior because grey atmospheres tend to overestimate the luminosity and effective temperature of a star of a given mass (BCAH98, and references therein). Also, BCAH98 argue that CMDs are superior to luminosity - diagrams because the latter usually depends upon empirically based color- or color-bolometric corrections which are derived from a stellar sample with a range of metallicity, gravity, and age.
The PMS model that provides the closest agreement with our dynamical primary mass is given by the BCAH98 tracks that use a general mixing length parameter = , [M/H] = 0.0, and Y = 0.275. These tracks predict the mass of the primary to be between 1.15 - 1.20 M⊙. As seen in Figure 4, this mass range deviates between 1.3 and 1.6 sigma from our dynamical primary mass measurement.
The second set of PMS tracks shown in Figure 4 were designed by BCAH98 to reproduce the properties of the Sun at 4.61 Gyr. The primary modification in these tracks is an increase in the mixing length parameter, , along with a small change in the Helium abundance ( and Y = 0.28). Using these tracks the derived mass range of the primary is 1.05 M⊙ to 1.15 M⊙, which is 1.6 - 2.1 sigma from our dynamical primary mass. Thus while models with this increased mixing length parameter do not provide as close agreement with our measured dynamical mass as models, they are nonetheless consistent with our measurements. While the difference between these two mixing length parameters is rather inconsequential below M⊙, it becomes important for stars above this mass (BCAH98).
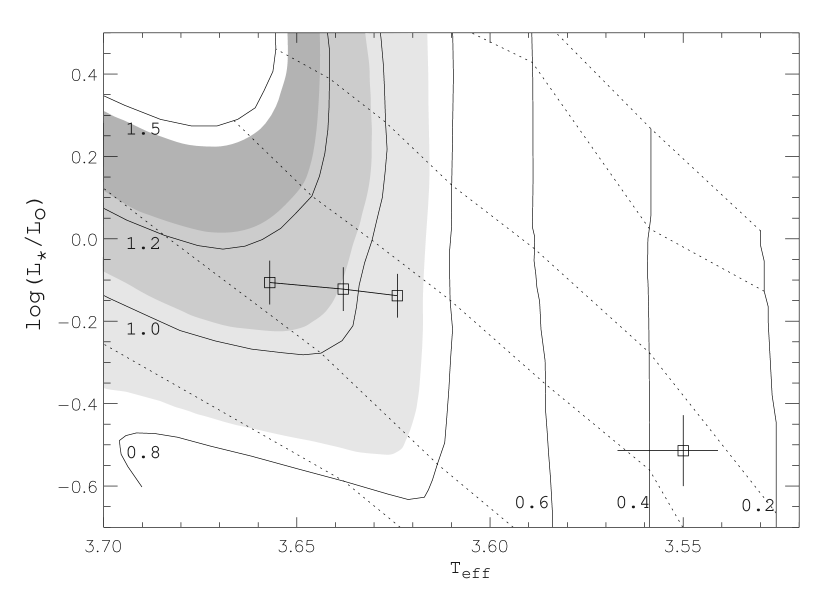
Recently, Palla & Stahler (1999, PS99) calculated a set of PMS tracks to model the star formation history of the Orion Nebula Cluster. These tracks utilize the initial properties of the protostellar environment to create a well-defined birthline in the H-R diagram (PS99, and references therein). This birthline assists in providing more accurate age estimates to stars that have formed from the same environment.
The PS99 tracks use a grey atmosphere approximation and employ the opacities of Alexander & Ferguson (1994) for low temperatures and the OPAL opacities of Iglesis & Rogers (1996) for high temperatures (K) with a composition X = 0.70, Y = 0.28 (PS99). Convection is treated using mixing length theory with . Figure 5 displays the PS99 tracks with NTT 045251+3016. The mass range of 0.90 - 1.15 M⊙ given to NTT 045251+3016 by the PS99 tracks deviates from our measured primary mass by 1.6 - 2.9 sigma.
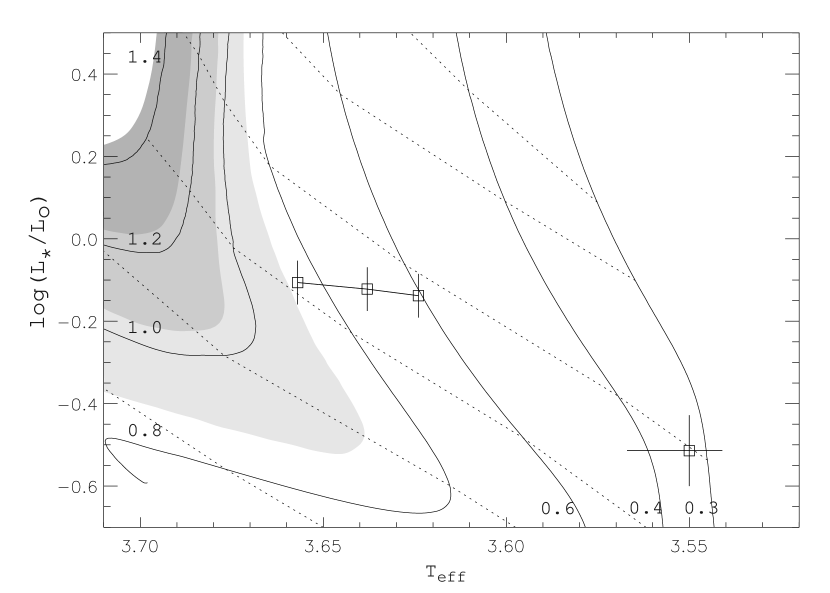
Our final comparison is with the PMS tracks of D’Antona & Mazzitelli (1997, DM97). In 1994, D’Antona & Mazzitelli released a set of PMS tracks that did not use standard Mixing Length Theory (MLT) to model the convection within the stellar envelope but instead treated the extended envelope of a PMS star with a ‘multiple eddy’ model called the Full Spectrum of Turbulence (FST) model (Canuto & Mazzitelli 1991). In 1997, D’Antona & Mazzitelli released a new set of PMS tracks that used the updated FST convection model in Canuto, Goldman, & Mazzitelli (1996).
Figure 6 shows the DM97 tracks that provide the closest agreement with our dynamical mass of NTT 045251+3016. This set of tracks uses Z=0.02, Y=0.28, and a deuterium mass fraction of . Nonetheless, the mass range given by DM97 for NTT 045251+3016 (0.60 - 0.87 M⊙) deviates between 3.0 and 4.5 sigma from our dynamical primary mass measurement. From this result we conclude the theoretical tracks provided by DM97 are not in agreement with our observational results.
4.2 The Secondary Star
Given the flux ratio for the binary in two colors, V and H, it is possible to use the photometry presented in Walter et al. (1988) and the intrinsic colors of Kenyon & Hartman (1995) to deduce the spectral type of the secondary. Using the extinction coefficient calculated earlier ( mag), we calculate for the primary star. Applying the observed flux ratios of and in the V and H bands, respectively, we determine that for the secondary . The uncertainty associated with the flux ratio in the V and H bands is the main source of the uncertainty in the observed color of the secondary. This color corresponds to an M2 spectral type plus or minus one subclass. The was calculated from the color for the secondary by interpolating in Kenyon & Hartmann (1995). The stellar parameters of the secondary are tabulated in Table 5.
Knowledge of the mass ( M⊙), Teff, and luminosity of the secondary not only provides another constraint for the mass calibration of the PMS models, but it also provides a test of the isochrones for each PMS model, if we assume coevality of the primary and secondary. The issue of coevality in binary formation is not yet well understood (e.g., Hartigan et al. (1994)), but the relatively old age ( Myr) of the NTT 045251+3016 pair makes zero-point issues in age comparisons less of a concern. In addition, we argue that the small physical separation of the stars in the binary ( AU) suggests that both stars formed together rather than through capture or exchange.
The BCAH98 PMS model that provides the best agreement with our dynamical primary mass () also provides the best agreement with our dynamical secondary mass. The secondary mass of 0.73 M⊙ predicted by the models is within 1.0 sigma of our dynamical mass measurement. The isochrones are consistent with coevality of the two stars in the binary and predict the age of the components of the binary to be approximately yr.
The BCAH98 PMS model that uses a mixing length parameter predicts a mass of 0.67 M⊙ for the secondary which is within the 2.0 sigma range about our measured dynamical mass of the secondary. The primary star is estimated to be around yr old while the secondary is about yr old. However, the stars are within 1.0 sigma of being coeval. The larger observational error on the secondary, compared to the error on the primary, is the limiting factor in comparing the calibration of the isochrones.
Palla & Stahler’s PMS tracks (1999) give the mass of the secondary to be 0.35 M⊙, to be compared with our measured value for the secondary mass of 0.81 M⊙. At this position among the PS99 tracks the predicted mass of the secondary depends only on Teff. A 1.0 sigma variation on Teff corresponds to a change in mass of 0.15 M⊙. Even when combined with the error on the dynamical mass of the secondary of 0.09 M⊙, the mass predicted by the PS99 tracks is 2.5 sigma from our measured dynamical mass.
Interestingly, the isochrones provided by PS99 suggest the largest relative age difference in the two stars among the tracks tested in this paper. Using the PS99 isochrones, the primary is over yr old while the secondary is only yr old. However, these age determinations are only distinct between the 1 and 2 sigma confidence level.
The DM97 tracks also give a mass for the secondary of 0.34 M⊙. As with the PS99 tracks, the secondary’s location with respect to the DM97 tracks makes the predicted mass sensitive primarily to changes in Teff. A 1.0 sigma change in Teff corresponds to a change in predicted mass of 0.1 M⊙. Combining this uncertainty with the error on the measured mass we find that the secondary mass predicted by the DM97 tracks is at least 3 sigma from the dynamical mass. The DM97 isochrones give the ages of both the primary and secondary stars to be yr and yr, respectively. These ages are within 1 sigma of being coeval.
5 Conclusion
In this paper we present dynamical masses for the components of the binary NTT 045251+3016. These mass measurements were derived from analysis of astrometric data from the Hubble Space Telescope Fine Guidance Sensors, optical spectroscopic data from the digital speedometers at CfA, and IR spectroscopic data from PHOENIX at KPNO. Our measured values for the primary and secondary masses are 1.45 0.19 M⊙ and 0.81 0.09 M⊙, respectively, at a distance of 145 8 pc. The uncertainties in these mass measurements can be readily reduced by more numerous measurements of the secondary radial velocity, which we encourage.
The measured primary and secondary masses are compared to predicted masses of three sets of PMS tracks: Baraffe et al. (1998), Palla & Stahler (1999), and D’Antona & Mazzitelli (1997). The Baraffe et al. (1998) tracks that use the “Next Gen” non-grey atmosphere models of Allard and Hauschildt (1997) and a mixing length parameter provide the closest agreement with our results. The masses predicted by the models deviate between 1.3 and 1.6 sigma from our measured primary mass and less than 1.0 sigma from our measured secondary mass. The Baraffe et al. (1998) tracks with predict a primary mass that is between 1.6 and 2.1 sigma from our measured primary mass, and a secondary mass that is within 2 sigma of our dynamical value. The PMS tracks of Palla & Stahler (1999) give a primary mass range that deviates 1.6 - 2.9 sigma from our dynamical primary mass, and the predicted secondary mass is 2.5 sigma from our dynamical value. Finally, the values for the primary and secondary masses provided by the tracks of D’Antona and Mazzitelli (1997), which uses the Full Spectrum of Turbulance (FST) to model stellar convection rather than standard Mixing Length Theory (MLT), deviate by more than 3.0 sigma from our measured dynamical masses. We therefore conclude that the Baraffe et al. (1998) and the Palla & Stahler (1999) models are consistant with our observations of NTT 045251+3016, while the D’Antona & Mazzitelli (1997) tracks are inconsistant at a significant confidence level.
If we assume the binary system is coeval, we can use our observations to constrain the relative accuracy of the isochrones provided by each PMS model. All three PMS models tested are consistant with coeval formation of both components. Better determination of the effective temperatures of the component stars will be needed to provide a tighter constraint on the PMS isochrones.
All of the PMS evolutionary tracks tested in this paper underestimate the masses of both the primary and secondary stars. The secondary star lies amidst the Hayashi tracks, and our observations demand cooler effective temperatures for the 0.8 Mo tracks. The same is true for the primary star when compared to the D’Antona and Mazzitelli models. However, when compared to the Baraffe et al. and Palla & Stahler tracks the primary lies at the transition between the convective and radiative tracks. For these models our observations of the primary star require both cooler temperatures and lower luminosities. This need for cooler effective temperatures from the evolutionary models is similar to the recent findings of Simon et al. (2001). Interestingly, D’Antona, Ventura, and Mazzitelli (2000) argue that the effective temperatures predicted by present PMS evolutionary models are actually upper limits, because magnetic fields, which are not included in any of the models tested here, act to reduce effective temperature.
6 Acknowledgements
We are indebted to the Space Telescope Science Institute, and especially the FGS team, for superb technical support throughout this program and for funding support. We also thank the many CfA observers who have obtained observations over the 15 years of this program and E. Goldberg for helping with the TODCOR analysis. Finally, the generous contribution of software from G. Torres, analyses and expertise from C. Dolan, and additional evolutionary tracks from I. Baraffe, were invaluable. The work of Tsevi Mazeh was supported by US-Israel Binational Science Foundation grant no. 97-00460, and by the Israel Science Foundation. The work of Lisa Prato and Michal Simon was supported in part by US NSF grant 98-19694.
References
- (1) Baraffe, I. Chabrier, G. Allard, F. & Hauschildt, P. H. 1998, A&A, 337, 403
- (2) Batten, A. H. 1973, in Binary and Multiple Systens of Stars (Pergamon Press, Oxford), 11
- (3) Bernacca, P. L. Lattanzi, M. G. Bucciarelli, B. Barabaro, G. Pannunzio, R. Badiali, M. Cardini, D. & Emanuele, A. 1993, A&A, 278, L47
- (4) Bertout, C. Robichon, N. & Arenou, F1̇999, A&A, 342, 574
- (5) Cardelli, J. A. Clayton, G. C. & Mathis, J. S. 1989, ApJ, 345, 245
- (6) Casey, B. W. Mathieu, R. D. Vaz, L. P. R. Andersen, J. & Suntzeff, N. B. 1998, AJ, 115, 1617
- (7) Corporon, P. Lagrange, A. M. & Beust, H. 1996, A&A, 310, 228
- (8) Covino, E. Catalano, S. Frasca, A. Marilli, M. Fernández, M. Alcalá, J. M. Melo, C. Paladino, R. Sterzik, M. F. Stelzer, B. 2000, A&A, 361, L49
- (9) D’Antona, F. Ventura, P. & Mazzitelli, I. 2000, ApJ, 543, L77
- (10) D’Antona, F. & Mazzitelli, I. 1997, MmSAI, 68, 807
- (11) Guilloteau, S. Dutrey, A. & Simon, M. 1999, A&A, 34, 570
- (12) Hartigan, P. Strom, K. M. & Strom, S. E. 1994, ApJ, 427, 961
- (13) Hartmann, L. Hewett, R. Stahler, S. & Mathieu, R. D. 1986, ApJ, 309, 275
- (14) Kenyon, S. J. Dobrzycka, D. & Hartmann, L. 1994, AJ, 108, 1872
- (15) Kenyon, S. J. & Hartmann, L. 1995, ApJS, 101, 117
- (16) Kurtz, M. J. Mink, D. J. 1998, PASP, 110, 934
- (17) Latham, D. W. 1992, in ASP Conf. Ser. 32, IAU Coll. No. 135, Complementary Approaches to Binary and Multiple Star Research, IAU Coll. No. 135, ed. H. McAlister & W. Hartkopf (San Francisco: ASP), 110
- (18) Lattanzi, M. G. Bucciarelli, B. Holfeitz, S. T. & Taff, L. G. 1992, in IAU Coll. 135, Complementary Approaches to Double and Multiple Star Research, McAlister H. A. & Hartkopf W. I. eds., ASP Conf. Ser. 32, 377-385
- (19) Lattanzi, M. G. Munari, U. Whitelock, P. A. & Feast, M. W. 1997, ApJ, 485, 328
- (20) Lee, C. W. 1992, Ph.D. thesis, UW-Madison
- (21) Lupie, O. L. & Nelan, E. P. 1998, FGS Instrument Handbook, Ver. 7
- (22) Mazeh, T. Prato, L. Simon, M. & Goldberg, E. 2000a, Birth and Evolution of Binary Stars, poster proceedings of IAU Symp. No. 200, eds. B. Reipurth & H. Zinnecker, p.22
- (23) Mazeh, T. Prato, L. Simon, M. & Goldberg, E. 2000b, in preparation
- (24) Palla, F. & Stalhler, S. W. 1999, ApJ, 525, 772
- (25) Simon, M. Dutrey, A. Guilloteau, S. 2001, ApJ, 545, 1034
- (26) Walter, F. W. Brown, A. Mathieu, R. D. Myers, P. C. & Vrba, F. J. 1988, AJ, 96, 297
- (27) Wichmann, R. Bastian, U. Krautter, I. Jankovics, I. Rucinski, S. M. 1998, MNRAS, 301, L39
- (28) Zucker, S. & Mazeh, T. 1994, ApJ, 420, 806
| HJD | (mag) | (mag) | PA11The Position Angle (PA) is measured North through East. () | () | PA()(O-C) | ()(O-C) | Phase |
|---|---|---|---|---|---|---|---|
| 2449822.0 | 2.0 | 2.2 | 187 | 0.046 | 7.20 | 0.0052 | 2.277 |
| 2450038.0 | 2.1 | 2.6 | 178 | 0.048 | 4.75 | 0.0041 | 2.363 |
| 2450098.0 | 2.4 | 2.2 | 170 | 0.048 | 1.53 | 0.0041 | 2.386 |
| 2450161.0 | 1.9 | 2.2 | 169 | 0.042 | 0.68 | 0.0016 | 2.412 |
| 2450317.0 | 2.7 | 2.5 | 163 | 0.041 | 1.99 | 0.0005 | 2.473 |
| 2450372.0 | 2.2 | 2.5 | 160 | 0.036 | 3.17 | 0.0043 | 2.495 |
| 2450480.0 | 2.4 | 2.4 | 158 | 0.039 | 1.27 | 0.0015 | 2.537 |
| 2450538.0 | 2.3 | 2.6 | 153 | 0.037 | 3.88 | 0.0013 | 2.560 |
| 2450669.0 | 2.1 | 2.2 | 149 | 0.031 | 1.36 | 0.0000 | 2.612 |
| 2450705.0 | 1.7 | 2.7 | 146 | 0.029 | 2.19 | 0.0005 | 2.626 |
| 2450767.0 | 2.1 | 2.2 | 138 | 0.016 | 5.89 | 0.0110 | 2.651 |
| 2450882.0 | 2.6 | 1.8 | 124 | 0.014 | 9.21 | 0.0081 | 2.697 |
| 2450913.0 | 2.2 | 2.4 | 121 | 0.023 | 8.48 | 0.0022 | 2.709 |
| 2451046.0 | 2.5 | 2.1 | 120 | 0.018 | 12.93 | 0.0020 | 2.762 |
| HJD | km s-1 | (O-C) km s-1 | Phase |
|---|---|---|---|
| 2446421.7465 | 4.52 | 0.47 | 0.930 |
| 2446428.6909 | 5.26 | 0.39 | 0.933 |
| 2446451.6493 | 3.38 | 1.12 | 0.942 |
| 2446728.8724 | 11.84 | 0.45 | 1.052 |
| 2446775.7779 | 13.31 | 0.04 | 1.071 |
| 2446804.6601 | 13.92 | 0.34 | 1.082 |
| 2447045.0073 | 18.00 | 0.35 | 1.177 |
| 2447075.8236 | 18.86 | 0.30 | 1.189 |
| 2447080.8803 | 17.56 | 1.03 | 1.191 |
| 2447127.8694 | 19.15 | 0.34 | 1.210 |
| 2447138.7852 | 18.99 | 0.14 | 1.214 |
| 2447157.5923 | 19.36 | 0.44 | 1.222 |
| 2447192.6571 | 18.86 | 0.15 | 1.236 |
| 2447198.6334 | 20.13 | 1.11 | 1.238 |
| 2447427.9813 | 19.53 | 0.51 | 1.329 |
| 2447492.8084 | 19.37 | 0.47 | 1.355 |
| 2447546.5820 | 19.49 | 0.71 | 1.376 |
| 2447576.6672 | 18.96 | 0.26 | 1.388 |
| 2447791.0071 | 16.73 | 1.21 | 1.473 |
| 2447818.8032 | 18.62 | 0.80 | 1.484 |
| 2447837.7737 | 16.72 | 1.01 | 1.491 |
| 2447868.9265 | 17.52 | 0.07 | 1.504 |
| 2447899.5659 | 17.73 | 0.29 | 1.516 |
| 2447928.6599 | 15.84 | 1.45 | 1.527 |
| 2447957.6175 | 17.40 | 0.26 | 1.539 |
| 2447965.6088 | 17.31 | 0.22 | 1.542 |
| 2448168.9077 | 15.89 | 0.06 | 1.622 |
| 2448194.9668 | 15.10 | 0.54 | 1.633 |
| 2448284.7375 | 14.39 | 0.55 | 1.668 |
| 2448635.7208 | 11.43 | 0.46 | 1.807 |
| 2448669.5847 | 11.13 | 0.70 | 1.821 |
| 2448675.6738 | 11.39 | 1.06 | 1.823 |
| 2448697.6311 | 10.25 | 0.28 | 1.832 |
| 2448875.9712 | 6.05 | 0.38 | 1.902 |
| 2448901.9111 | 5.34 | 0.54 | 1.913 |
| 2448910.8049 | 6.41 | 0.72 | 1.916 |
| 2448931.9191 | 6.84 | 1.57 | 1.925 |
| 2448970.8280 | 4.23 | 0.36 | 1.940 |
| 2448988.7716 | 5.38 | 1.04 | 1.947 |
| 2449030.7093 | 3.75 | 0.31 | 1.964 |
| 2449056.6040 | 3.41 | 0.74 | 1.974 |
| 2449235.0189 | 11.21 | 0.67 | 2.045 |
| 2449258.9979 | 12.14 | 0.52 | 2.054 |
| 2449290.8841 | 13.23 | 0.32 | 2.067 |
| 2449316.8181 | 13.11 | 0.73 | 2.077 |
| 2449318.8322 | 13.72 | 0.19 | 2.078 |
| 2449379.6724 | 14.56 | 1.09 | 2.102 |
| 2449652.0326 | 18.03 | 0.78 | 2.210 |
| 2449706.8549 | 17.98 | 1.00 | 2.231 |
| 2450000.9524 | 19.19 | 0.25 | 2.348 |
| 2450029.9190 | 18.76 | 0.12 | 2.359 |
| 2450087.7501 | 18.47 | 0.26 | 2.382 |
| 2450173.5382 | 19.51 | 1.04 | 2.416 |
| 2450771.7774 | 16.51 | 1.26 | 2.653 |
| 2450771.7982 | 14.68 | 0.57 | 2.653 |
| 2450799.9570 | 14.96 | 0.06 | 2.664 |
| 2451563.5879 | 2.21 | 1.85 | 2.967 |
| 2451570.4936 | 5.53 | 1.45 | 2.970 |
| HJD | km s-1 | (O-C) km s-1 | km s-1 | (O-C) km s-1 | Phase |
|---|---|---|---|---|---|
| 2451529.7500 | 4.1 | 0.08 | 33.6 | 0.70 | 2.953 |
| 2451530.7500 | 3.4 | 0.77 | 31.6 | 1.04 | 2.954 |
| Period (yr) | |
| a (′′) | |
| e | |
| i (∘) | |
| (∘) | |
| (∘) | |
| To | |
| (km s-1) | |
| (km s-1) | |
| (km s-1) | |
| a (AU) | |
| distance (pc) | |
| (M⊙) | |
| (M⊙) | |
| + (M⊙) | |
| / |
| log() | log( | ||||
|---|---|---|---|---|---|
| Primary | Central point | ||||
| lower limit | |||||
| upper limit | |||||
| Secondary |