email: roland.kothes@hia.nrc.ca 22institutetext: Max-Planck-Institut für Radioastronomie, Auf dem Hügel 69, 53121 Bonn, Germany
email: wreich@mpifr-bonn.mpg.de
A high frequency radio study of G11.20.3, a historical supernova remnant with a flat spectrum core
We present radio maps of the historical supernova remnant G11.20.3 in the frequency range from 4.85 GHz to 32 GHz. The integrated spectrum with (S ) is dominated by its steep spectrum shell emission (), although a flat spectrum core structure classifies G11.20.3 as a composite supernova remnant. A radial magnetic field structure is observed. An analysis of the multi–frequency polarization data results in highly varying rotation measures along the shell. The percentage polarization is rather low ( 2 %) and we conclude that G11.20.3 is in the transient phase from free to adiabatic expansion. The central flat spectrum component is partly resolved. A compact radio source with an inverted spectrum likely coincides with the previously detected X–ray pulsar (Torii et al. torii1997 (1997)). Two symmetric structures with flat radio spectra possibly indicate a bipolar outflow. Combining available X–ray and radio data we conclude that G11.20.3 is likely the remnant of a type II supernova explosion with an early type B progenitor star.
Key Words.:
supernova remnant–magnetic field–radio emission–plerion1 Introduction
Only a small number of young supernova remnants (SNRs) has been identified in our Galaxy so far. One of them is the non–thermal source G11.20.3. Clark & Stephenson (clark (1977)) associated this SNR with the supernova explosion of A.D. 386 observed by Chinese astronomers during the Chin Dynasty. In the radio continuum G11.20.3 shows the typical structure of a shell–type SNR with a spectral index of (S ). Green et al. (green (1988)) reported a clumpy shell and the lack of a sharp outer boundary based on high resolution VLA data. This indicates a SNR in an early evolutionary state. Green et al. (green (1988)) found no evidence for spectral index variations between 1.4 GHz and 5 GHz. However, Morsi & Reich (morsi (1987)) reported on a flat spectrum core based on early 32 GHz observations with the Effelsberg 100-m radio telescope.
H i–absorption measurements towards the SNR indicate a distance of about 5 kpc (Radhakrishnan et al., radha (1972); Green et al. green (1988) after reinterpretation of the absorption spectrum measured by Becker et al. becker1985 (1985)). At this distance G11.20.3 has a diameter of approximately 6 pc, which is comparable to other historical SNRs like Kepler and Cas A with pc and Tycho with pc.
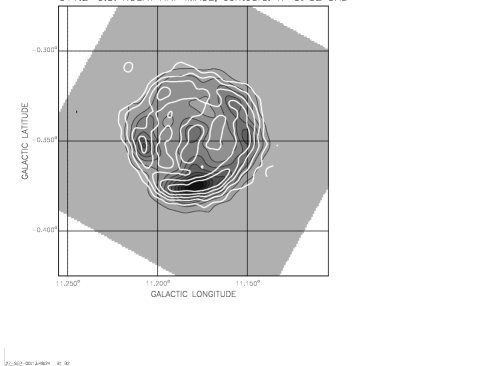
X–ray observations of G11.20.3 show a soft shell–like structure which is most prominent in the southeast (Reynolds et al. reynolds (1994), see Fig. 1). In addition a hard spectrum core exists (Vasisht et al. vasisht (1996)), which was interpreted as the synchrotron nebula of an embedded pulsar. This pulsar was subsequently discovered by Torii et al. (torii1997 (1997)) through observations with the Advanced Satellite for Cosmology and Astrophysics (ASCA). It is a young pulsar with a period of 65 ms. The rotational energy loss rate was calculated to be erg/s from follow–up X–ray observations (Torii et al. torii1999 (1999)). This is a rather low value for a young pulsar and indicates a low radio surface brightness for the surrounding synchrotron nebula (Kothes kothes (1998)).
In order to detail the properties of G11.20.3, in particular its central component and its polarization structure, we conducted a number of new observations at high radio frequencies.
2 Observations
The Effelsberg 100-m radio telescope was used to map fields around G11.20.3 at high radio frequencies. In 1996 observations at 4.85 GHz and 14.7 GHz were carried out as part of test measurements for newly installed receiver systems. In 1999 observations at 10.45 GHz and 32 GHz were added. At 32 GHz a new receiver system was used with improved sensitivity compared to Morsi & Reich’s (morsi (1987)) measurements at the same frequency. All receiver systems used were installed in the secondary focus of the telescope. The 4.85 GHz, 10.45 GHz, and 32 GHz observations were made by recording both circularly polarized components to obtain total intensity. IF correlation of the circular components results in linear polarization data. At 14.7 GHz just total intensity channels were available. The receiving systems consist of two feeds at 4.85 GHz, four feeds at 10.45 GHz and 14.7 GHz, and three feeds at 32 GHz. Observational parameters are listed in Table 1. All systems have highly stable cooled HEMT receivers at their front–ends and run in total power mode. Data reduction relies on application of the “software beam switching” technique to reject influences of weather effects (Morsi & Reich morsi2 (1986)).
| Frequency [GHz] | 4.85 | 10.45 | 14.7 | 32 |
| Feeds | 2 | 4 | 4 | 3 |
| Tsys [K] | 30 | 50 | 200 | 130 |
| Bandwidth [MHz] | 500 | 300 | 1000 | 2000 |
| HPBW [′] | 2.5 | 1.1 | 0.86 | 0.45 |
| Velocity [′/min] | 60 | 40 | 25 | 20 |
| Step Interval [″] | 60 | 20 | 15 | 12 |
| Mapsize [] | 3020 | 3010 | 1212 | 156.5 |
| Observation Date | 2.96 | 8.99 | 1.96 | 4./5.99 |
| Calibrator I | 3C286 | 3C286 | NGC7027 | 3C286 |
| Flux Density [Jy] | 7.5 | 4.5 | 6.2 | 2.1 |
| Calibrator PI | 3C286 | 3C286 | – | 3C286 |
| Linear Pol. [%] | 11.5 | 11.7 | – | 12.3 |
| Pol. Angle [] | 33 | 33 | – | 33 |
| Coverages | 1 | 1 | 1 | 8 |
| RMS-I [mJy/b.a.] | 19 | 6 | 10 | 7.5 |
| RMS-PI [mJy/b.a.] | 6 | 2.5 | – | 2.0 |
All observations were made in the equatorial coordinate system (B1950). The scan direction was along the azimuth. The standard data reduction software package based on the NOD2 format has been applied. The multi–feed observations at 14.7 GHz and 32 GHz were restored using the algorithm described by Emerson et al. (emerson (1979)). At 4.85 GHz and 10.45 GHz data from different feeds were reduced separately and combined afterwards. Baseline improvement by unsharp masking (Sofue & Reich sofue (1979)) was applied to all observations. The “Plait” algorithm described by Emerson & Gräve (emerson88 (1988)) was used to combine the numerous coverages observed at 32 GHz at different parallactic angles by destriping the maps in the Fourier plane. This increases the signal–to–noise ratio of the final map substantially.
We made also use of an unpublished 23 GHz map with an angular resolution of 12 observed in 1987 by W. Reich, P. Reich, and Y. Sofue with the Nobeyama 45-m radiotelescope. A cooled HEMT receiver was used and a map was made from two coverages at different parallactic angles. It was calibrated relative to NGC 7027 assuming 5.7 Jy. The reduction of the double–beam observations was described by P. Reich (pr (1987)).
3 Results
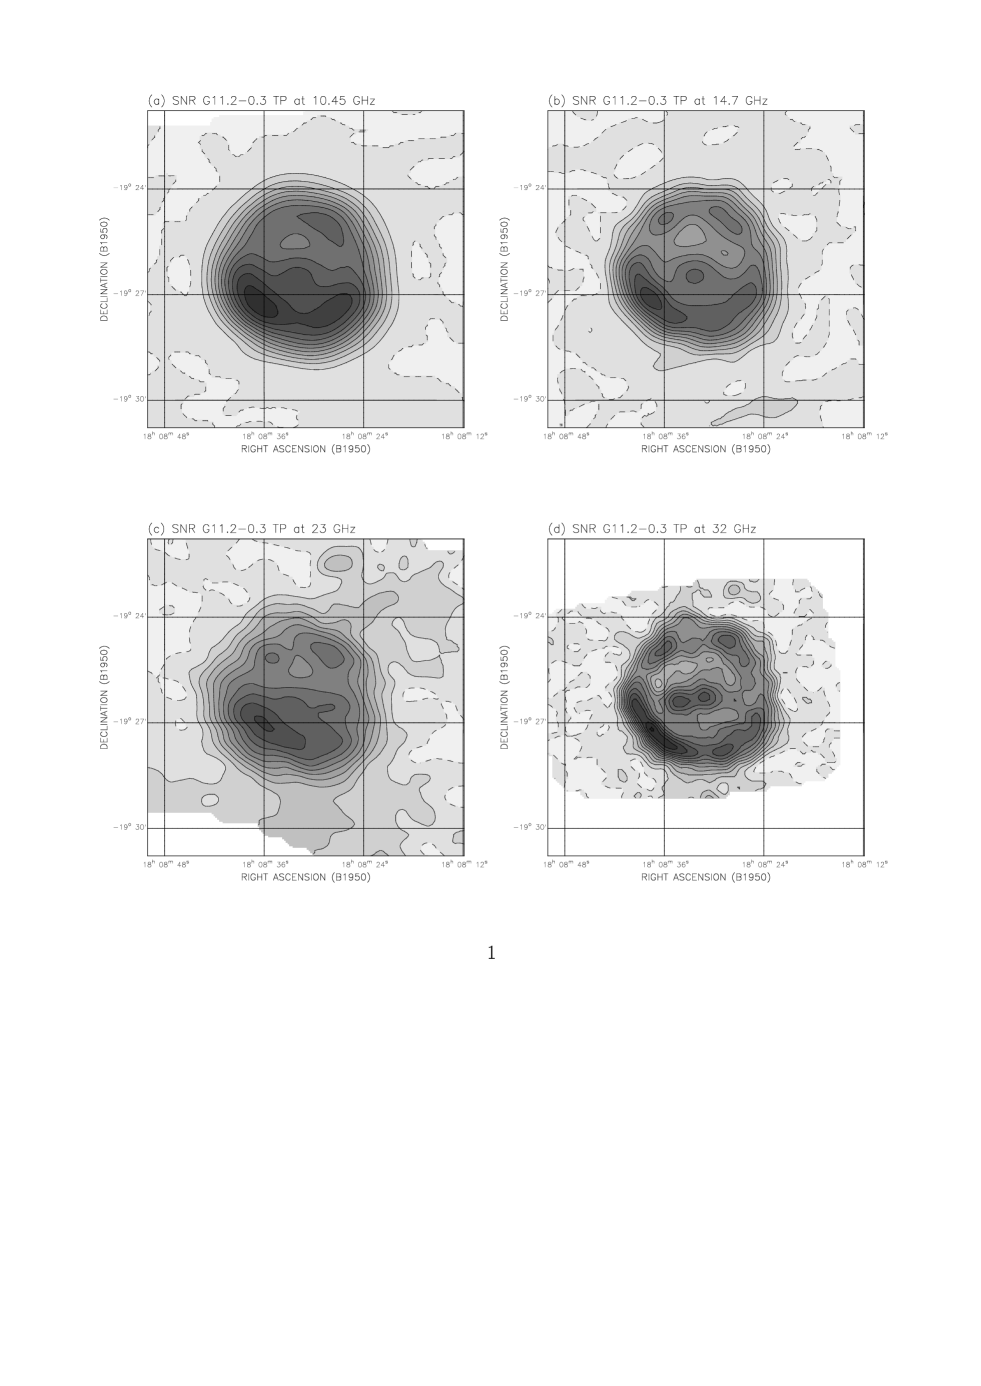
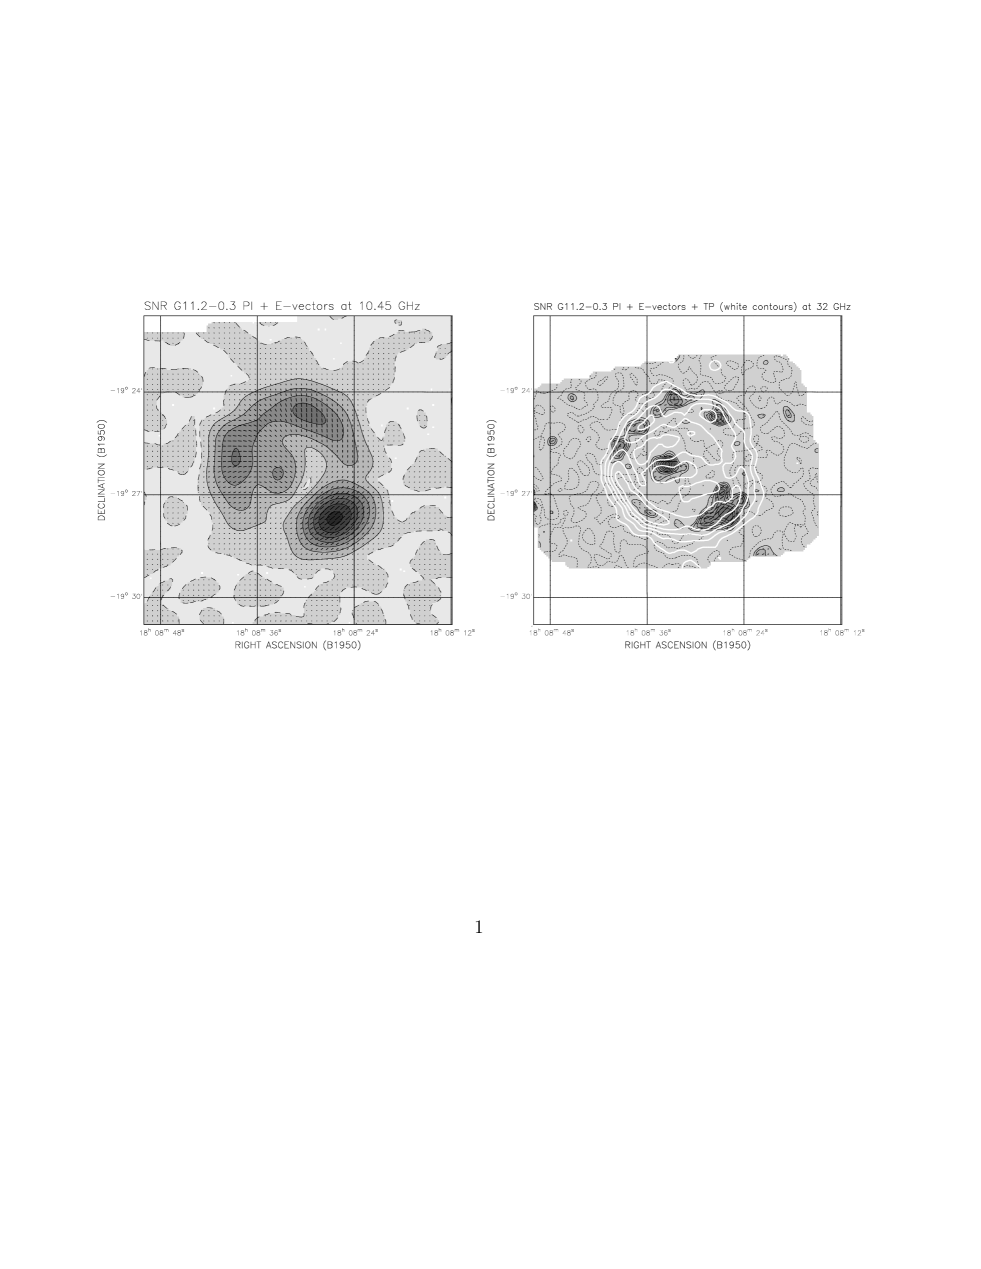
The total intensity maps at 10.45 GHz, 14.7 GHz, 23 GHz and 32 GHz are shown in Fig. 2. In Fig. 3 polarized intensities at 10.45 GHz and 32 GHz are displayed.
3.1 The radio emission from the shell
The overall structure of the radio continuum emission is most evident in the 32 GHz map (Fig. 2d), where the angular resolution is highest. The SNR shows an almost circular shell consisting of four prominent sectors, with the strongest towards the southeast. Three of those sectors show clear polarization with electric field vectors perpendicular to the expansion direction (Fig. 3). The southeastern sector is almost unpolarized.
3.2 The interior structure
Within the shell there are two slightly extended sources visible at 32 GHz (see Fig. 2d). On our lower frequency maps these sources appear unresolved and confused with the shell as a result of the lower angular resolution. Both inner sources seem to be polarized (see Fig. 3, Table 3) but a more prominent polarization feature is located slightly north of them. It has no distinct counterpart in total intensity and seems to be related to diffuse emission either from the shell or the inner structure of the SNR.
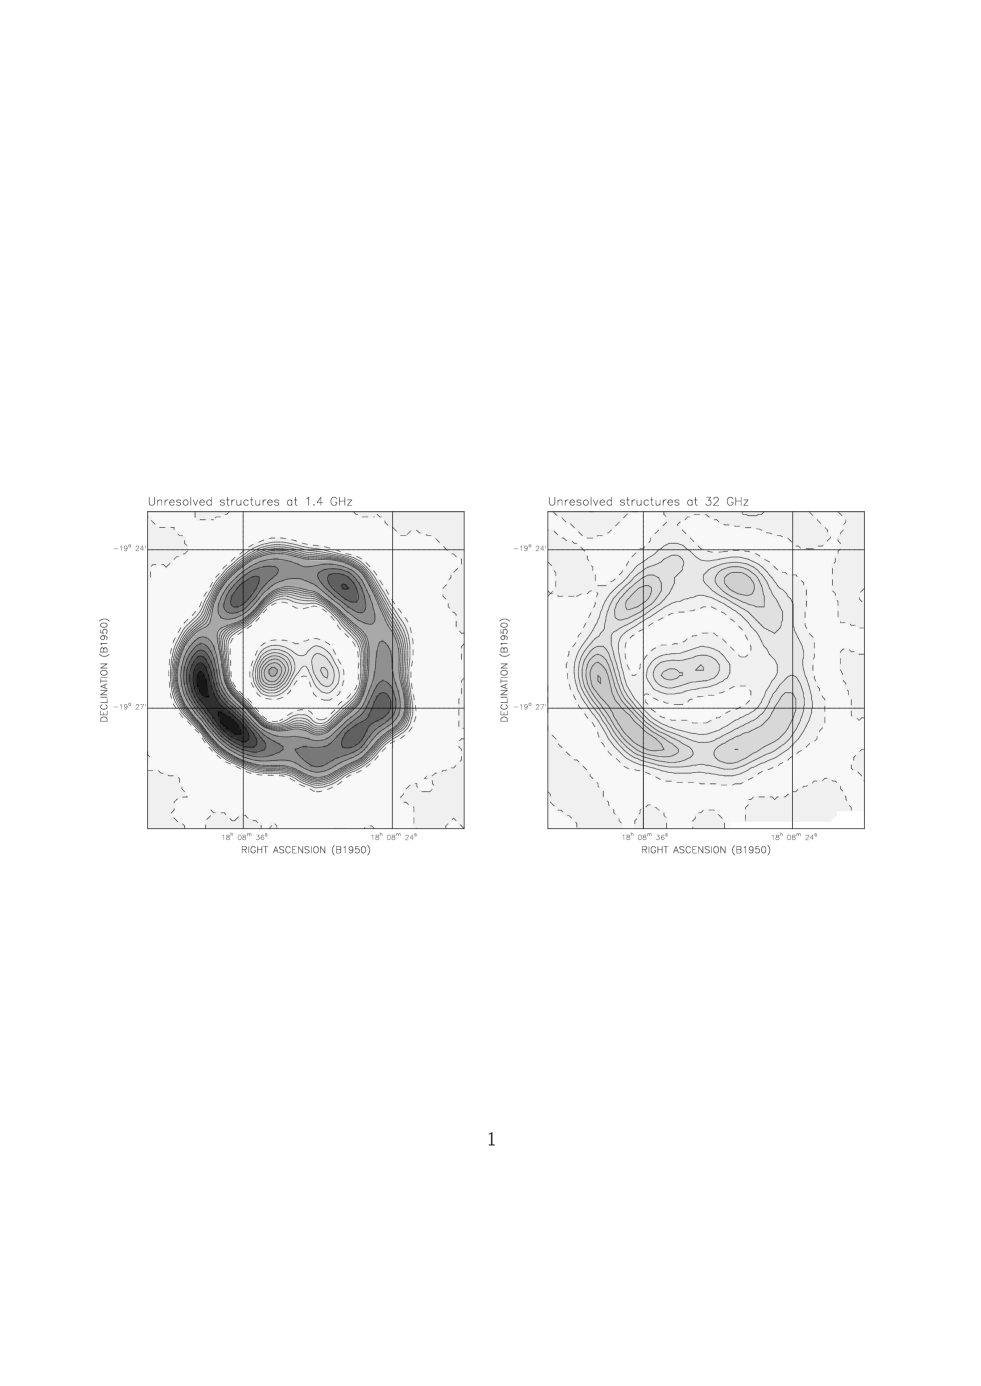
In order to measure the spectrum of the two compact sources we used the NVSS data at 1.4 GHz (Condon et al. condon (1998)) having an angular resolution of . We applied the “background filtering technique” (Sofue & Reich sofue (1979)) to separate the diffuse emission from the shell which is confused with the inner structure. We applied the method to the NVSS map and the 32 GHz map, convolved to , in exactly the same way to get comparable results. The resulting maps are displayed in Fig. 4.
The NVSS map shows two clearly separated sources, while at 32 GHz a bar-like structure with two emission peaks is visible. This results from an additional component showing up at 32 GHz, which is located between the two sources visible at 1.4 GHz. In the observations of Green et al. (green (1988)) there is a slightly extended source visible at the very center of the 4.76 GHz map which we believe has an inverse spectrum because it is not visible in their 1.46 GHz map. There are only the two extended diffuse structures which are also visible at 4.76 GHz.

| Frequency | TP | PI | %-Pol. | |||
|---|---|---|---|---|---|---|
| [MHz] | [Jy] | [mJy] | ||||
| 1408 | 17.7 | 0.7 | - - | - - | ||
| 2695 | 11.5 | 0.5 | - - | - - | ||
| 4850 | 9.6 | 0.5 | 220 | 30 | 2.3 | 0.4 |
| 10450 | 6.3 | 0.4 | 140 | 10 | 2.2 | 0.3 |
| 14700 | 5.7 | 0.4 | - - | - - | ||
| 23000 | 4.7 | 0.5 | - - | - - | ||
| 32000 | 3.8 | 0.4 | 90 | 8 | 2.5 | 0.4 |

3.3 The radio spectrum
The integrated spectrum of the SNR is plotted in Fig. 5. The flux density values obtained from the Effelsberg and the Nobeyama maps are listed in Table 2. Other values were taken from the references indicated. The fitted spectral index of is a typical value of a mature supernova remnant.
However, G11.20.3 has a flat spectrum core component. Fig. 6 shows the radial variation of spectral index between 10.45 GHz and 32 GHz at 115 angular resolution. The spectral index between these two frequencies calculated with the integrated flux densities from Table 2 is , just marginally flatter than the spectral fit in Fig. 5. The spectrum flattens from about at the outer shell to about in the inner part of the SNR. The profile suggests a flatter radio spectrum in the interior of the remnant. The overall spectral index of between 10.45 GHz and 32 GHz indicates that the flat component starts to flatten the overall spectrum of the source.
Integrating the flux density of the compact sources gives mJy at 1.4 GHz and mJy at 32 GHz. A spectral index of results. However, there are spectral variations. The central source is not visible at 1.4 GHz, thus indicating an inverted spectrum. This is supported by the observations of Green et al. (green (1988)). At 4.76 GHz a compact source with a peak flux density of about 2 mJy is visible which is absent in their 1.46 GHz map at the same angular resolution. The 4.885 GHz map of Becker et al. (becker1985 (1985)) at angular resolution barely resolves that source, but a central enhancement of about 10 to 15 mJy/beam is seen. Of the outer sources, the spectrum of the eastern one seems slightly steeper than that of the western component. Clearly, sensitive higher angular resolution data are needed to determine the spectrum of the source components more precisely.
A separation of the shell emission and the central emission is difficult with the present data. Based on the pulsar data we estimate in Sect. 4.2 the flat spectrum radio emission to be about 1 Jy, which we assume to have a spectral index of . Subtracting the plerionic component from the integrated flux density values results in a spectral index of for the shell emission. Fig. 5 shows the resulting total spectrum when adding both components. The differences to the spectral fit of the integrated flux densities are quite small for the present frequency range, but would become larger at higher frequencies.
3.4 The polarization properties
At 32 GHz a rotation measure (RM) of 2000 rad/m2 is required to rotate the polarization angle by about 9°. Therefore we can ignore Faraday rotation effects at 32 GHz. This means that the magnetic field responsible for the synchrotron emission from the shell of G11.20.3 has a radial orientation. The magnetic field structure is characteristic for a young SNR in which the ejected material, with its frozen–in radial magnetic field, dominates the expansion and the synchrotron emission.
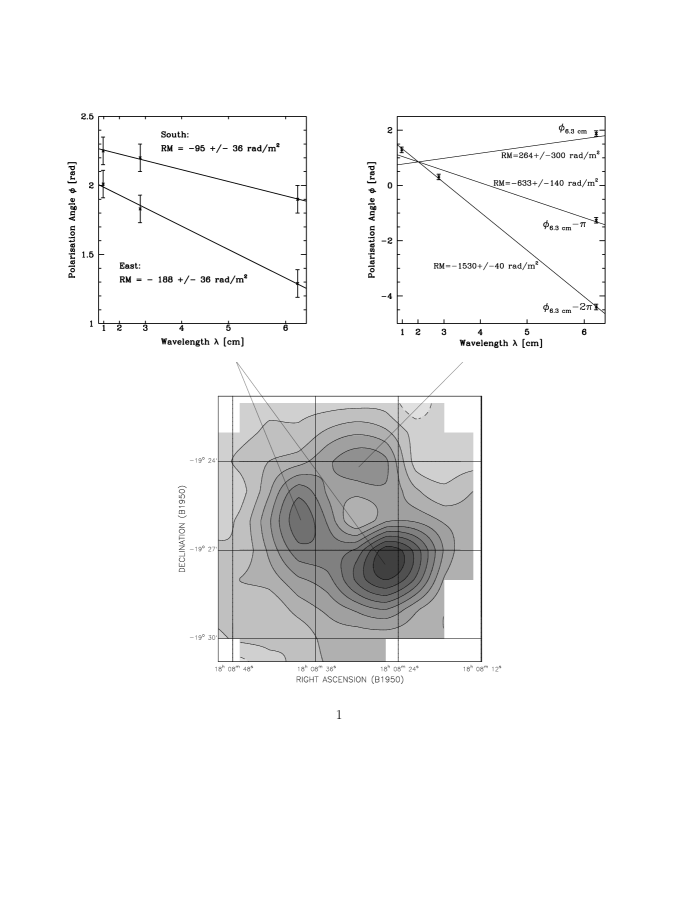
The integrated linearly polarized flux density (PI, see Table 2) is about 2–3 %, which is quite low for a SNR. Nevertheless, at the three wavelengths where polarization was observed PI is strong enough to derive rotation measures (RM). At the common angular resolution of 25 we calculated RMs for three components as marked in Fig. 7.
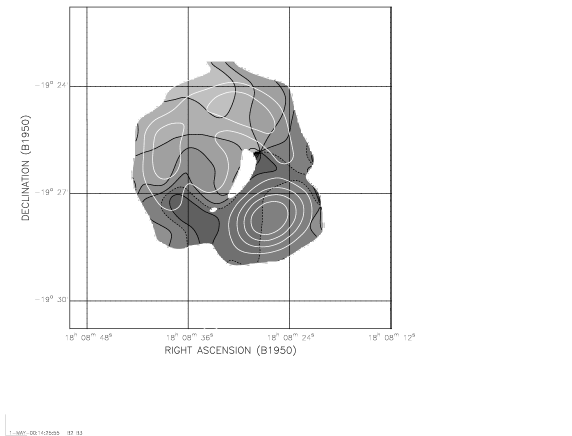
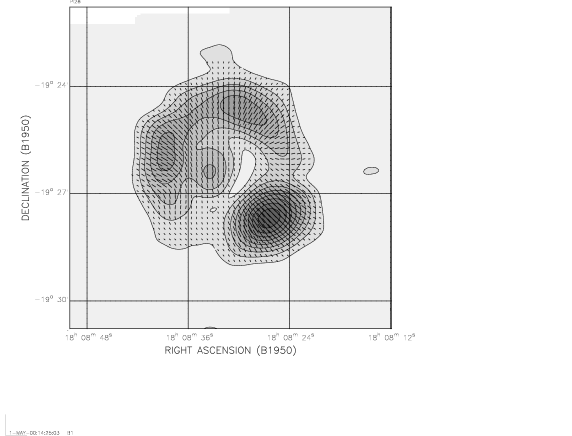
The southern and eastern component have low RMs, while the northern blob shows about 1530 rad/m2. The 4.75 GHz data suffers from ambiguities, but not the higher frequency data. Therefore a map of the lowest possible RM was calculated between 10.45 GHz and 32 GHz at 115 angular resolution. We assumed the polarization angles at 32 GHz to be correct. At 10.45 GHz we checked the original angle , , and . The angle which resulted in the lowest RM was taken. The RM map is displayed in Fig. 8. The PI map at 10.45 GHz shown in Fig. 9 is corrected for RM effects. The SNR clearly has a radial magnetic field except for the southeastern quadrant where the polarized intensity is very low. Otherwise the map is fully in agreement with the 32 GHz map, which is mostly unaffected by even high RMs. The reason for the excessive RM in the northern part of the SNR is unknown. Either a magnetic field enhancement or an enhanced electron density within this part of the remnant or in its immediate surroundings is required. The much lower RM observed towards the south and east of the SNR rules out a significant contribution from Faraday rotation within the interstellar medium along the line of sight between the SNR and us.
4 Discussion
A spectral index of from the fit to the integrated flux densities of G11.20.3 indicates a spectrum flatter than all the other early phase SNRs. Their spectral indices as listed by Green (snrcat (2000)) are:
-
•
Cas A:
-
•
Kepler:
-
•
Tycho:
-
•
SN1006:
When taking into account the flat spectrum core the spectrum of the shell steepens to about . Since G11.20.3 is older than the four listed historical SNRs the spectral difference may reflect an evolutionary effect from free expansion to adiabatic expansion. It is still not fully understood what exactly happens during that transition phase and in particular under what circumstances it happens.
In the subsequent discussion we refer to six different components of the SNR. The shell of G11.20.3 is separated into the four prominent sectors as indicated in Fig. 10. Each sector has a width of starting with Sector I from (straight north) in clockwise direction. Within the SNR we refer to unresolved sources visible at 32 GHz, which are also indicated in Fig. 10. Properties of the individual components are listed in Table 3.
| TP [mJy] | PI [mJy] | %-Pol. | RM [] | ||||
|---|---|---|---|---|---|---|---|
| Sector I | 330 | 40 | 22.0 | 3.0 | 6.7 | 1.5 | 1150 |
| Sector II | 420 | 50 | 27.0 | 4.0 | 6.4 | 1.5 | +130 |
| Sector III | 380 | 40 | 3.5 | 1.0 | 0.9 | 0.5 | +550 |
| Sector IV | 360 | 40 | 18.0 | 3.0 | 5.0 | 1.2 | 1430 |
| Source I | 40 | 10 | 4.0 | 2.0 | 10.0 | 6.0 | 900 |
| Source II | 40 | 10 | 4.0 | 2.0 | 10.0 | 6.0 | 750 |
4.1 The structure of the shell
All the shell sectors look very similar in total intensity. As already mentioned by Green et al. (green (1988)), the structure of the shell appears rather clumpy without a sharp outer boundary. An exception is Sector III, which has a higher peak flux and is well defined by an outer boundary in contrast to the others (see Fig. 2). This indicates a later phase of evolution for this part of the SNR. This assumption is supported by the very low percentage polarization in Sector III, while all the other sectors show polarization between 5 and 7 % (Table 3).
In early stages of SNR evolution most of the expanding material is ejecta from the supernova explosion itself. A radial magnetic field is frozen into this material. In the free expansion phase the ejecta with the radial magnetic field dominate the hydrodynamics and the synchrotron emission. Since a radial magnetic field is observed in the shell of G11.20.3 we conclude that the SNR is in this phase of evolution. In the later development more ambient material is swept up by the expanding shock wave. This material is compressed and collected within a thin shell behind the shock wave, outside the ejecta. The ambient magnetic field component frozen into this shell is perpendicular to the expansion direction which means the expansion direction which means perpendicular to the magnetic field in the ejecta. The percentage polarization will decrease until the contribution of the swept up magnetic field to the synchrotron emission equals that of the ejecta. At this point we expect no linear polarization unless the observations are able to resolve these structures, which is not the case here. Sector III seems to be exactly at that stage while the other sectors are still in an earlier stage of evolution.
This advanced evolutionary phase of Sector III is also implied by the X–ray observations. The soft X–ray luminosity of a SNR depends on the amount of emitting mass which is of course increasing with time while the expanding shock wave sweeps up interstellar matter. The soft X–ray luminosity also depends on the emissivity of this material in the soft X–ray band which mainly depends on its temperature. In early phases the temperature exceeds K by a factor of five or even more. Such a high plasma temperature peaks in hard X–rays. During the free expansion phase the soft X–ray luminosity increases with decreasing temperature and an increase of emitting material. In the adiabatic expansion phase the temperature changes are rather small. Thus the soft X–ray luminosity increases just depending on the increasing mass in the expanding shell. In the free expansion phase the soft X–ray luminosity increases much faster than in later evolutionary phases of the SNR. This gives a very good indication of evolutionary differences within the remnant.
Sector III shows the strongest emission in the ROSAT HRI image (see Fig. 1). This implies that Sector III is the most developed part of the SNR. Apparently the ‘aging’ of the remnant seems to increase from Sector I to Sector III, which is likely due to different densities of the ambient medium. The required density increase points away from the Galactic Plane. This is either a local effect or the density peak at about 5 kpc distance is below . However, no such density gradient is visible in the distribution of H i from the channel maps of the Effelsberg H i-survey by Braunsfurth & Rohlfs (brau (1984)) at about 9′ angular resolution. Therefore any density contrast has to be small. This assumption is supported by the nearly circular shape of the SNR, while a density variation would lead to different expansion velocities.
X–ray observations indicate that between 3 and 4 M⊙ of interstellar material has been swept–up so far (Vasisht et al. vasisht (1996); Reynolds et al. reynolds (1994)). A tangential magnetic field is frozen into this material, which interacts with the ejecta by forming a convective zone between both layers. In this zone material from both layers and their magnetic field lines are mixed by turbulence. Synchrotron emission is expected from all these zones. Since linear polarization with a radial magnetic field is observed, the mass of the ejecta should be considerably larger than the mass of the swept up material. Only a type II supernova explosion will eject such a large amount of material. The pulsar found within the remnant supports this conclusion. There is no indication for a stellar wind bubble around the SNR from the H i data (Braunsfurth & Rohlfs brau (1984)). This suggests an early B-type progenitor star with a mass of about 10–15 M⊙. These stars have no high velocity winds or high mass loss rates. A supernova explosion of a B0 or a B1 star would fit all observations.
4.2 The interior structures
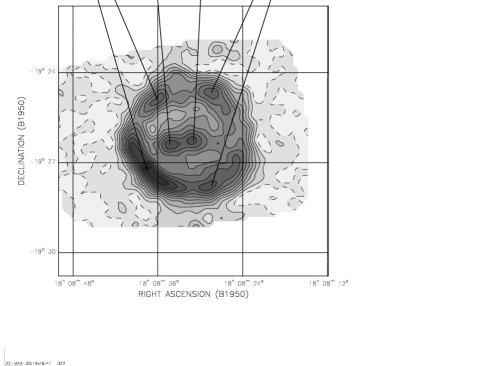
Torii et al. (torii1997 (1997)) detected an X–ray pulsar in the geometrical center of G11.20.3 within the hard spectrum X–ray synchrotron nebula previously discovered by Vasisht et al. (vasisht (1996)). The exact position of these components and therefore their physical relation to the central radio sources cannot be determined very precisely. The positional error is about , which makes it difficult to identify the synchrotron nebula of the pulsar with either of the three radio components within the remnant. However, it is most likely that the pulsar coincides with the central component visible in the ROSAT-HRI image (Reynolds et al. reynolds (1994)). In Fig. 1 a greyscale representation of this observation is shown together with white contours indicating the 32 GHz measurement in total power. Evidently the most likely radio counterpart of the hard X–ray synchrotron nebula is the central source (Source I) with an inverted spectrum. The flux density listed in Table 3 is, however, confused with a contribution from the western component showing up at 1.4 GHz (Fig. 4).
With the correlation between a pulsar’s rotational energy loss rate , the radio surface brightness and the diameter D of its synchrotron nebula found by Kothes (1998) we can estimate the flux density of this nebula in G11.20.3. With erg/s and a mean diameter of at a distance of 5 kpc we get a flux density of about 1 Jy at 1 GHz. Assuming a spectral index of for this nebula we get (see Fig. 5) for the shell.
The total flux density of the central component is much larger than the integrated flux density of the compact sources (Sect. 3.2.). Most of the flat spectrum emission is therefore diffuse. The compact polarization feature seen at 32 GHz (Fig. 3) is slightly offset to the north of the compact structures and therefore related to the diffuse emission. Its RM is about 800 [rad/], rather similar to that of the compact sources I and II. The central RMs follow the gradient of RM across G11.20.3 as seen in Fig. 8.
We note some similarities of G11.20.3 with the crab–like SNR G21.50.9, where a compact X–ray source (Slane et al. slane (2000)), which has no radio counterpart at 22 GHz, is seen at the center of axisymmetric radio structures suggesting some collimated outflow of particles (Fürst et al. fuerst (1988)). Certainly the angular resolution of the present data does not allow a decision as to whether this scenario also holds for G11.20.3. The possibility of confusion of the central emission with extragalactic background sources can be ruled out as the high resolution maps by Green et al. (green (1988)) and Becker et al. (becker1985 (1985)) resolve the eastern and western sources of the NVSS map into diffuse extended emission.
5 Conclusions
Our high frequency observations confirm the historical SNR G11.20.3 as a composite SNR. The structure of the centrally peaked flat spectrum component, which is powered by electron and magnetic field injection by the central pulsar, is partly resolved. At 32 GHz we have an indication of a central source with an inverted spectrum, which likely coincides with the pulsar. The two outer symmetrical components were previously resolved at high angular resolution and might result from a collimated outflow. However, this needs to be confirmed by more sensitive data. A strong gradient in RM across G11.20.3 is observed with highest absolute RM values in the northern part of the SNR. The SNR shows a radial magnetic field over most of the shell structure. The shell was found to be in the transition phase from free to adiabatic expansion, with differences between the four sectors of the shell. This suggests that the interacting interstellar material likely has different densities. Combining available X–ray and radio data we conclude that G11.20.3 is likely the remnant of a type II supernova explosion with an early type B progenitor star.
Acknowledgements.
RK acknowledges the support from Prof. Richard Wielebinski and the MPG through a PhD and a post-doctoral fellowship at the MPIfR, when most of the observations were made. This research made use of data obtained through the High Energy Astrophysics Science Archive Research Center Online Service, provided by the NASA/Goddard Space Flight Center. We wish to thank Ernst Fürst, Lloyd Higgs, and Tom Landecker for critical reading of the paper. We are grateful to the referee John Dickel for helpful comments.References
- (1) Becker, R.H., & Kundu, M.R. 1975, AJ, 80, 679
- (2) Becker, R.H., Markert, T., & Donahue, M. 1985, ApJ, 296, 461
- (3) Braunsfurth, E., & Rohlfs, K. 1984, A&AS, 57, 189
- (4) Clark, D.H., & Stephenson, F.R. 1977, in: The Historical Supernovae (Oxford: Pergamon)
- (5) Condon, J.J., Cotton, W.D., Greisen, E.W., Yin, Q.F., Perley, R.A., Taylor, G.B., & Broderick, J.J. 1998, AJ, 115, 1693
- (6) Emerson, D.T., Klein, U., & Haslam, C.G.T. 1979, A&A, 76, 92
- (7) Emerson, D.T., & Gräve, R. 1988, A&A, 190, 353
- (8) Fürst, E., Handa, T., Morita, K., Reich, P., Reich, W., & Sofue, Y. 1988, PASJ, 40, 347
- (9) Goss, W.M., & Day, G.A. 1970, AuJPA, 13, 3
- (10) Green, D.A., Gull, S.F., Tan, S.M., & Simon, A.J.B. 1988, MNRAS, 231, 735
-
(11)
Green, D.A. 2000, A Catalogue of Galactic
Supernova Remnants (August 2000 version at
http://www.mrao.cam.ac.uk/surveys/snrs) - (12) Kassim, N.E. 1992, AJ, 103, 943
- (13) Kothes, R. 1998, MmSAI, 69, 971
- (14) Milne, D.K., Wilson, T.L., Gardner, F.F., & Mezger, P.G. 1969, Astrophys. Lett., 4, 121
- (15) Morsi, H.W., & Reich, W. 1986, A&A, 163, 313
- (16) Morsi, H.W., & Reich, W. 1987, A&AS, 71, 189
- (17) Radhakrishnan, V., Goss, W.M., Murray, J.D., & Brooks, J.W. 1972 ApJS, 24, 49
- (18) Reynolds, S.P., Lyutikov, M., Blandford, R.D.,& Seward, F.D. 1994, MNRAS, 271, L1
- (19) Reich, P. 1987, NRO Technical Report No. 12
- (20) Reich, W., Fürst, E., Steffen, P., Reif, K., & Haslam, C.G.T. 1984, A&AS, 58, 197
- (21) Reich, W., Reich, P., & Fürst, E. 1990, A&AS, 83, 539
- (22) Shaver, P.A., & Goss, W.M. 1970, AuJPA, 14, 133
- (23) Slane, P., Chen, Y., Schulz, N.S., Seward, F.D., Hughes, J.P., & Gaensler, B.M. 2000, ApJ, 533, L29
- (24) Sofue, Y., & Reich, W. 1979, A&AS, 38, 251
- (25) Torii, K., Tsunemi, H., Dotani, T., & Mitsuda, K. 1997, ApJ, 489, L145
- (26) Torii, K., Tsunemi, H., Dotani, T., Mitsuda, K., Kawai, N., Kinugasa, K., Saito, Y., & Shibata, S. 1999, ApJ, 523, L69
- (27) Vasisht, G., Aoki, T., Dotani, T., Kulkarni, S.R., & Nagase, F. 1996, ApJ, 456, L59