Spectra of Maser Radiation from a Turbulent, Circumnuclear Accretion Disk. III. Circular polarization
Abstract
Calculations are performed for the circular polarization of maser radiation from a turbulent, Keplerian disk that is intended to represent the sub-parsec disk at the nucleus of the galaxy NGC4258. The polarization in the calculations is a result of the Zeeman effect in the regime in which the Zeeman splitting is much less than the spectral linebreadth. Plausible configurations for turbulent magnetic and velocity fields in the disk are created by statistical methods. This turbulence, along with the Keplerian velocity gradients and the blending of the three hyperfine components to form the masing transition of water, are key ingredients in determining the appearance of the polarized spectra that are calculated. These spectra are quite different from the polarized spectra that would be expected for a two-level transition where there is no hyperfine structure. The effect of the hyperfine structure on the polarization is most striking in the calculations for the maser emission that represents the central (or systemic) features of NGC4258. Information about magnetic fields is inferred from observations for polarized maser radiation and bears on the structure of accretion disks.
1 Introduction
Magnetic fields are likely to play a key role in the structure of accretion disks. In recent years, the idea that the long-sought physical mechanism for the viscosity in accretion disks involves turbulent magnetic fields has received special attention (e.g., Balbus & Hawley 1998). The sub-parsec accretion disk at the nucleus of the galaxy NGC4258 provides a nearly ideal example of an accretion disk that is surrounding a massive, compact object (Watson & Wallin 1994; Miyoshi et al. 1995)—presumed to be a black hole. Because this disk is observed at radio wavelengths and in a spectral line that is masing (the transition of the water molecule), uniquely refined data about the properties of this disk have been obtained by utilizing the high resolution capabilities of very long baseline interferometry. Polarization of the maser radiation can potentially provide information about the magnetic field and is observed in the radiation from water masers located in our own Galaxy. The observations of NGC4258 to date have yielded only upper limits for the linear (Deguchi, Nakai, & Barvainis 1995; Herrnstein et al. 1998) and circular (Herrnstein et al. 1998) polarization. These observations have focussed on the emission from the side of the disk which occurs in narrow spectral lines that are relatively weak. In contrast, the maser flux from directions toward the center of the disk (the systemic emission) is much greater than that from the sides and would seem to offer the possibility for measurements that are more sensitive (e.g., Herrnstein et al. 1998). Instruments which are under consideration for the future also have the potential for increased sensitivity to the polarization of the water masers (e.g., Moran 2000).
In previous calculations (Wallin, Watson, & Wyld 1998, 1999; hereafter Papers I & II), turbulence in the velocities that is plausible for an accretion disk was found to lead naturally to spectra that are similar to the observed spectra of NGC4258. Utilizing these spectra as a basis, we now investigate the relationship between the circular polarization of the maser radiation and magnetic fields that are likely to be present in the disk. Keplerian velocity gradients and turbulence in the velocities determine where the maser amplification mainly occurs. The magnetic field changes along the path of the radiation as a result of the turbulence. Simplifications that are valuable in interpreting the circular polarization for a two-level masing transition are no longer valid because the transition of the water molecule in astrophysical masers probably is a blend of three hyperfine components (Nedoluha & Watson 1991). The circular polarization of the radiation from galactic water masers has been measured by Fiebig & Güsten (1989), and subsequently by others. However, instrumental effects prevent the line profile for the circular polarization from being determined well enough to distinguish the profile that is predicted for a blending of hyperfine components from that for a single two-level transition, which is antisymmetric about line center (R. M. Crutcher 2001, private communication). Observational support for blending does exist from the statistics of the spectral linebreadths for the flux of Galactic water masers (Gwinn 1994). In calculations for the maser inversion (e.g., Anderson & Watson 1993), a number of radiative and collisional transitions are found to influence the populations of the and states. All such calculations to date obtain population inversions for these and the several other transitions of water that have been observed to be masing without considering the hyperfine structure. The breadths of the infrared spectral lines involved in the pumping also are much greater than the hyperfine splitting. It is thus difficult to imagine that the maser pumping might select only one of the hyperfine transitions. In Papers I and II, we do simplify the calculations by ignoring maser saturation. In those investigations and elsewhere (Watson & Wyld 2000), we have reasoned that the masers of NGC4258 are (at most) only moderately saturated because of their small linebreadths. A key idealization in the formulation of Papers I and II which is also utilized here is that the maser opacity is constant. The variations in the calculated spectra and spatial images are then entirely a result of changes in the velocity caused by the turbulence and by the Keplerian rotation. Finally, the only cause for circular polarization that will be considered here is the Zeeman effect—which can be treated in the limit in which the Zeeman splitting is much smaller than the spectral linebreadth. The presumed absence of significant maser saturation and the observed absence of significant fractional linear polarization reduce the likelihood for circular polarization due to other causes that have been investigated (Nedoluha & Watson 1994; Wiebe & Watson 1998).
For the three hyperfine components that we are considering, the Zeeman splitting () in frequency units ranges from approximately s-1 for the transition to approximately s-1 for the transition. Consideration of the equipartition of energy and of the magnitudes of the magnetic fields that have been detected in galactic, 22 GHz water masers indicate that the magnetic fields in the NGC4258 masers most likely are at least G. A decay rate s-1 ordinarily is adopted for the and states in astrophysical water masers. Hence, simplifications in the calculation which are appropriate when is much greater than and the rate for stimulated emission (which is assumed to be less than since the masers are treated as unsaturated) are reasonable. In this regime, there are no phase relations between the magnetic substates. Only ordinary populations of the magnetic substates then enter into the calculations. These lead to the constant maser opacity for unsaturated masers that is adopted here. In contrast, elements of the quantum mechanical density matrix are needed when the rate for stimulated emission approaches and exceeds .
The calculational methods are outlined in Section 2, results for the polarized spectra from the sides and from directions toward the center of the disk are presented separately in Section 3, and further discussion of the significance of the results is given in Section 4.
2 Basic Methods
Except for the calculation of the circular polarization of the radiation, the basic methods are exactly the same as in our previous calculations where they are described in more detail (Papers I and II). Representative turbulent velocity fields (“statistical realizations”) are created in rectangular volumes by statistical sampling. To accomplish this, a statistical sample of the Fourier amplitudes of the velocity field is chosen from Gaussian distributions for the amplitudes and a Kolmogorov-like power spectrum. These methods are standard (e.g., Dubinski, Narayan, & Phillips 1995). The rectangular volumes of turbulent velocities are imagined to be located at the sides or along the line to the center of the galaxy as viewed by a distant observer in the plane of the disk (see Figure 1). The bulk velocity of the masing gas at a location is then taken to be the sum of the turbulent velocity and the circular, Keplerian velocity appropriate for the disk of NGC4258 at that location. The masing is treated in the unsaturated limit as discussed in the Introduction. In other contexts, we have found that modest saturation does not alter significantly the relationship between the circular polarization and the magnetic field for water masers (Nedoluha & Watson 1992). Incorporating maser saturation would make the calculation far more difficult. In any case, it is desirable to understand the relationship between the circular polarization of the maser radiation and the magnetic field in a turbulent, Keplerian disk in the simpler, unsaturated limit before contemplating the possible effects of maser saturation on this relationship. For the distant observer in the plane of the disk, the observed maser flux at Doppler velocity in terms of the maser optical depth [defined here as a positive quantity] for a ray of radiation at impact parameter measured from the center of the disk and at distance measured from the midplane of the disk is then (e.g., Paper I)
| (1) |
Here, is the distance from the observer to the galaxy, is the temperature of the background continuum radiation, is the thickness of the disk and is the inner radius of the masing region. We adopt cm and cm for NGC4258 (e.g., Papers I & II). The normalized flux is the factor by which the disk amplifies radiation at Doppler velocity . In writing equation (1), the masing is assumed to be amplifying background continuum (as opposed to spontaneous) radiation. Since the simplifying idealization is being made (see Introduction) that the maser opacity is constant, the optical depth for a single masing transition (a transition involving only two energy levels) can be expressed as
| (2) |
where the integration is along the straight line path of the ray through and parallel to the plane of the disk. The Doppler velocities in equation (2) are related by
| (3) |
where and are the projections along the line of sight of the Keplerian and the turbulent velocities, respectively. To obtain the thermal velocity for the water molecules, we adopt a temperature of 500 K as representative for the masing of water in astronomical environments. In effect, the foregoing simplifications reflect the idealization that the main cause for the spectral and spatial variations in the maser intensities are due to the changes in the velocity field. To designate the energy flux that is computed in the two energy level approximation using the optical depth from equation (2), we append the subscript “2” to obtain and .
Representative turbulent magnetic fields are created in the rectangular volumes at the center and sides of the disk by exactly the same procedure as is utilized for the turbulent velocity fields. The random numbers that are used in the statistical sampling are, of course, not the same. The parameters that describe the turbulence in the magnetic fields—the Kolmogorov power spectrum and the largest wavelength in the power spectrum—are the same as for the velocity fields. The largest wavelength corresponds to the thickness of the disk. Since the circular polarization depends linearly on the strength of the magnetic fields, the Stokes- that is calculated by incorporating turbulent magnetic fields is thus proportional to the rms value of these turbulent magnetic fields. Numerical simulations of MHD turbulence in astrophysical disks do tend to indicate that the power spectra of the velocity and magnetic fields are similar (e.g., Brandenburg et al. 1995; Stone et al. 1996), and thus that our procedure is a reasonable way in which to idealize turbulent magnetic fields in gaseous, Keplerian disks in astrophysics. The two power spectra also are similar in MHD simulations for non-rotating media that are intended to represent interstellar clouds (e.g., Vázquez-Semadeni et al. 2000).
When the Zeeman splitting is much smaller than the linebreadth of a spectral line and the maser is unsaturated as is the case here, it is an excellent approximation to assume that the local contribution to the Stokes- intensity for an individual ray is proportional to the derivative with respect to Doppler velocity of the source function for the intensity. Since the fractional circular polarization also is small as in this regime, for a two-level transition
| (4) |
where is the component of the magnetic field that is parallel to the line of sight and is a constant that involves the product of the magnetic moment and the transition probability. Also, the intensity of the individual ray is where is the intensity of the background continuum radiation. The integrand in equation (4) is a function of and , as well. When the magnetic field is constant, equation (4) becomes
| (5) |
Thus, investigators commonly seek to relate Stokes- to the derivative of the intensity when the Zeeman splitting is much smaller than the spectral linebreadth. The observed flux of circularly polarized radiation at a specific Doppler velocity is then the sum, analogous to that in equation (1), of the contributions of all rays to the Stokes- flux at this Doppler velocity
| (6) |
in which a normalized Stokes- flux is defined in analogy with the normalized energy flux in equation (1). We have emphasized in the Introduction that there is no basis for treating the masing spectral line as a two level transition and that the three strongest hyperfine components should always be treated together. For the three hyperfine components together, the foregoing equations can be expressed as (see, e.g., Nedoluha & Watson 1992)
| (7) |
and
| (8) |
To compute the flux when all three hyperfine transitions are considered, from equation (7) is inserted into equation (1). Likewise, of equation (8) and the normalized Stokes- flux are related by an equation exactly analogous to equation (6).
Integration over and in the foregoing is appropriate for comparisons with data for NGC4258 because the spatial resolution of the observations is not sufficient to resolve the thickness of the disk nor the range of impact parameters from which radiation emerges at a specific Doppler velocity.
3 Results of Calculations
3.1 Maser Radiation from the Sides of the Disk
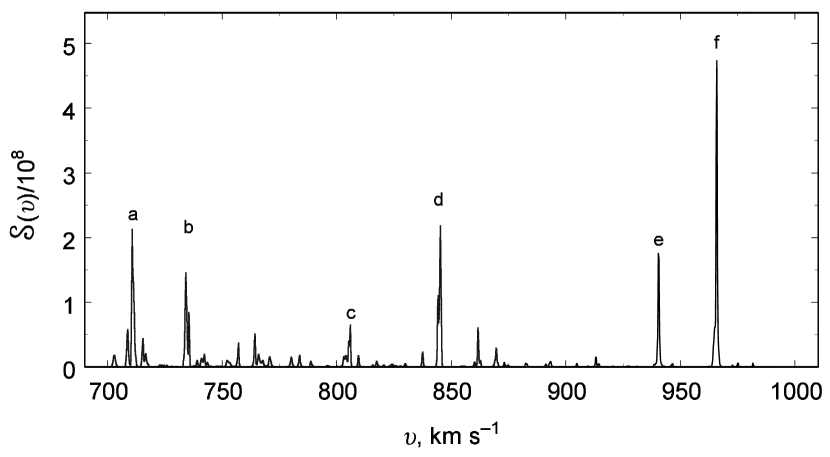
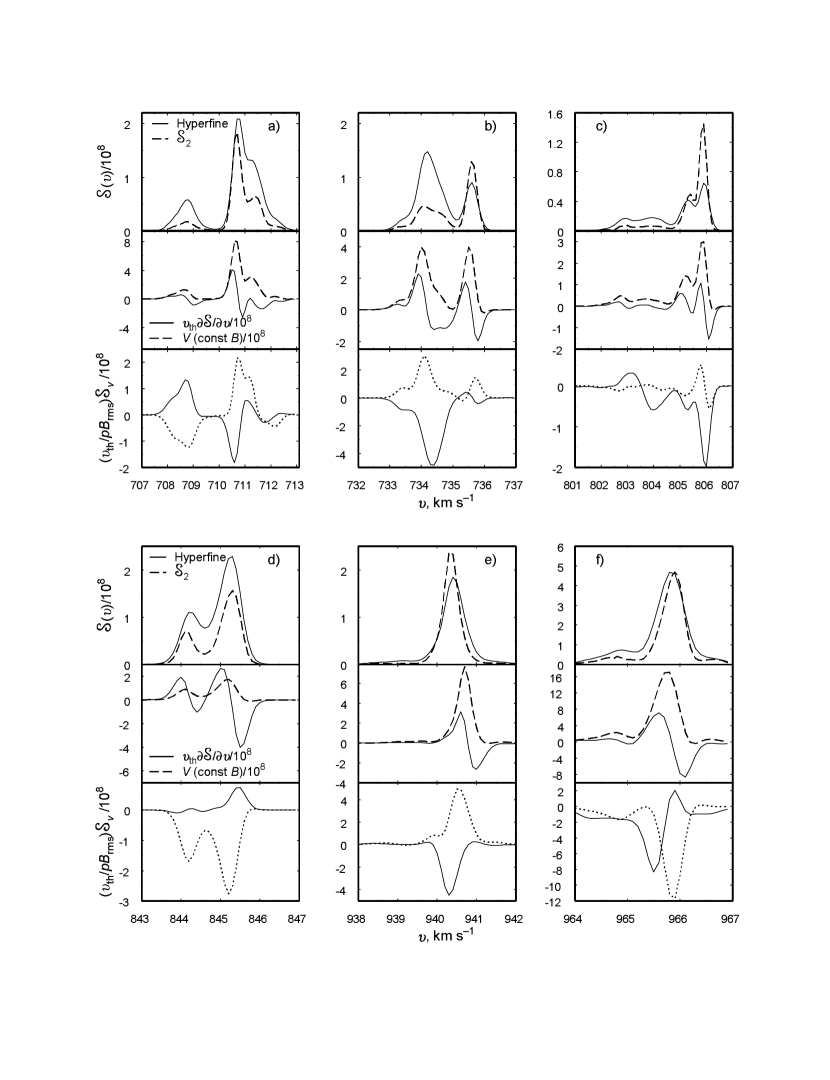
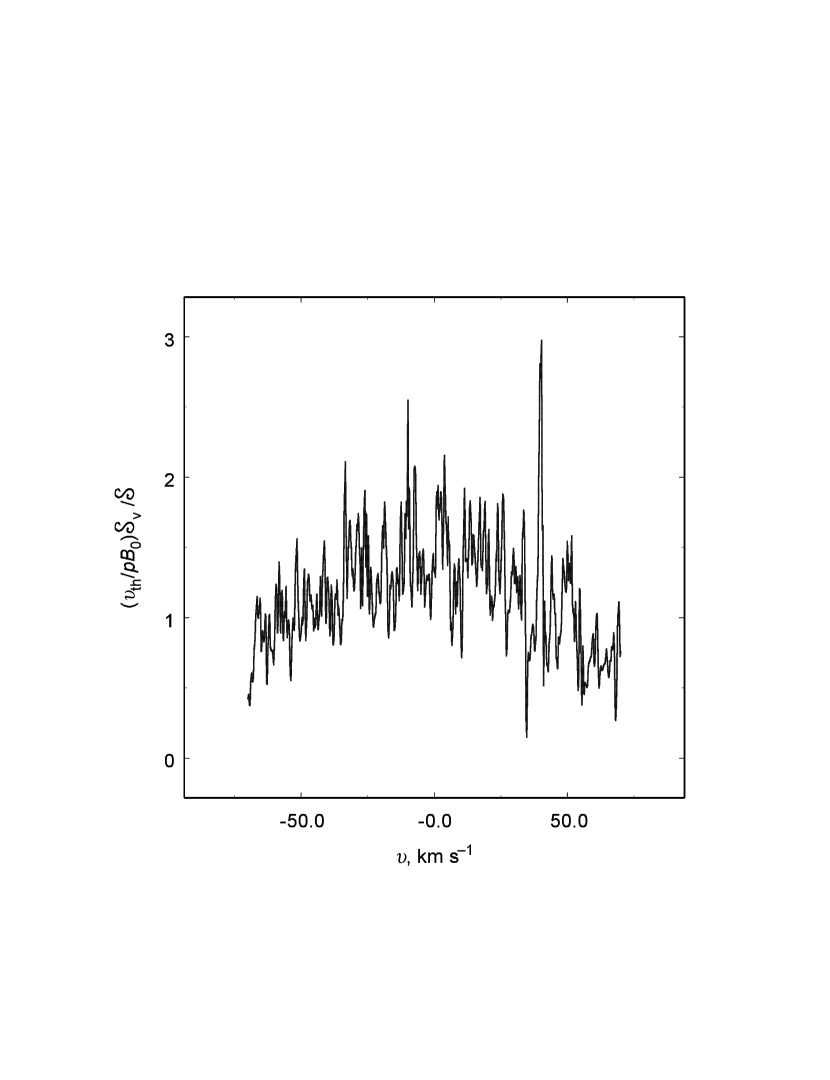
The appearance of the spectrum for the emission from the sides of the disk varies somewhat from one statistical realization of the turbulent velocity field to another (Paper II). Statistical realizations are different because of the initial (or seed) number given to the random number generator. As a representative basis for examining the polarization, we utilize a realization for the velocity fields that leads to a spectrum (panel a of Figure 2 in Paper II) for that is the most similar to the observed spectrum of NGC4258—that is, a spectrum that consists of several, mostly well separated, narrow lines (1 to 2 km s-1 FWHM) with peak fluxes that are comparable and are dispersed in Doppler velocities over some 200 to 300 km s-1. This spectrum is shown in Figure 2 in terms of the normalized flux density obtained by including all three hyperfine components in the calculation for the optical depth . As discussed in Paper II, the opacity parameter is chosen to yield peak fluxes for the spectral lines that are similar to the fluxes that are observed. We have reasoned in Paper II that for the masers at the sides of the disk is likely to be 10 to 100 degrees K. We also reason in Paper II that the magnitude of the opacity that we utilize is plausible for the water masers. There are only modest differences in this spectrum when the optical depth is computed from equation (2) for a single masing transition instead of with all three hyperfine components. That is, and are similar in character. Comparisons are shown in the upper six panels in Figure 3 for the individual features labelled (a)–(f) in Figure 2. In the middle panels in Figure 3, we compare the derivative of the flux for these spectral features with the Stokes- flux due to a constant magnetic field when the three hyperfine components are included in the calculations for both as in equations (7) and (8). The purpose of this comparison is to demonstrate that, even for a magnetic field that can be treated as constant throughout the masing region, the actual spectrum for Stokes- should be quite different from the derivative of the energy flux because of blending of the hyperfine components. The hyperfine nature of the transition often is ignored, and the Stokes- flux is assumed to be proportional to the product of the strength of the magnetic field and the “derivative spectrum” as is valid for a two-level transition. A value or upper limit for could then be inferred. The comparisons in Figure 3 emphasize, however, that this procedure is not valid—as demonstrated previously (Nedoluha & Watson 1992) for a medium without bulk motions. Note that, in contrast to the derivative spectrum, the Stokes- spectrum does not tend to change sign as one moves across the spectral line. In the bottom panel in Figure 3, we show the normalized Stokes- flux that is obtained for the features in the top panels when the magnetic fields are not constant, but are entirely turbulent and are specified as we have discussed in Section 2. To obtain an indication of the possibilities, we show the results of two separate computations for two independent statistical realizations of the magnetic field. In some cases (see features a, c, and f) variations occur that are suggestive of the derivative spectrum and can thus be misleading when interpreting the observations if they are taken as evidence that the masing involves only a single transition and not all three hyperfine components.
To provide a further indication of how spectra of the circular polarization can appear when the magnetic field is turbulent, the Stokes- flux is presented in Figure 4 for two of the features in Figure 2 when the masing is treated as a single, two-level transition. It is compared with the derivative spectrum for these features. These spectra are representative. The Stokes- and the derivative spectrum can be quite similar as in panel (b), though they are more likely to be somewhat different in appearance. Two-level spectra for Stokes- which appear similar to the Stokes- that are computed with the three hyperfine components also occur (panel a). No change in sign occurs for these spectra as one moves across the line profile.
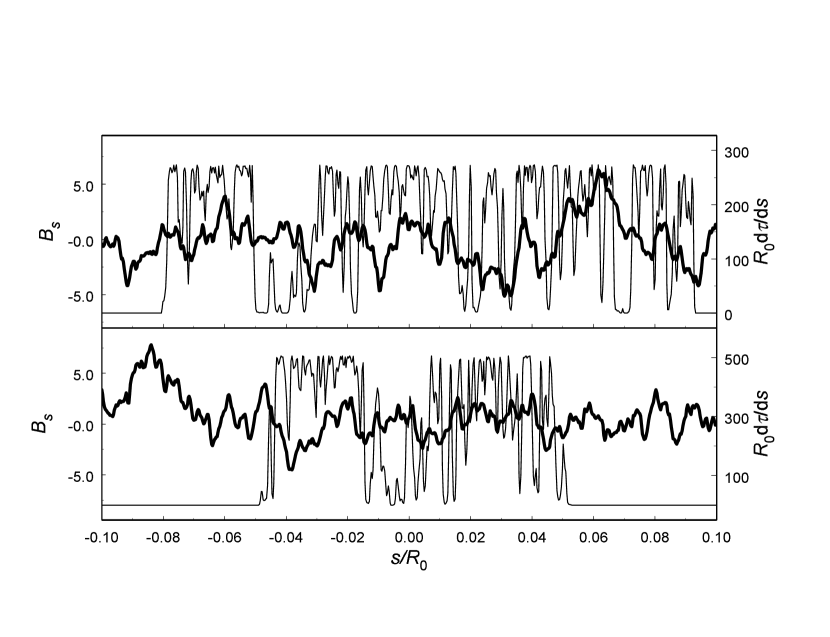
Representative examples are shown in Figure 5 for the variation of the turbulent magnetic field component along the path of a ray and for variation of the maser opacity . The Doppler velocities for these two rays are at the peaks of two of the spectral features in Figure 2. For one ray, the contributions to the optical depth are spread relatively uniformly along its path, whereas the contributions can be viewed as arising from two “clumps” for the other ray. The latter configuration tends to support the idea that “aligned masers” (Deguchi & Watson 1989) play an important role for the emission near the planes of Keplerian and other disks.
The circular polarization of spectral lines at radio frequencies often is quite weak so that it is difficult to delineate a line shape accurately enough to infer by fitting the observed Stokes- to the derivative spectrum—even assuming a two-level transition and that is a constant throughout the region in which the spectral line is created. Under such circumstances and when the Zeeman splitting is much smaller than the spectral linebreadth, a useful relationship from which an excellent approximate value can be inferred for the magnitude of is
| (9) |
where and are the maximum and minimum values of Stokes- across the spectral line, is the Doppler breadth (FWHM) of the spectral line, is the peak intensity in the spectral line, and is a constant that involves the magnetic moment and the transition probability of the specific molecular transition. Equation (9) was originally recognized to be useful for interpreting non-masing spectral lines. Somewhat surprisingly, equation (9) also has been found to be a good approximation for spectral lines that are masing strongly, despite the “exponential” nature of maser amplification (Fiebig & Güsten 1989). Even when the three hyperfine components of the transition of water are blended and the maser is moderately saturated, equation (9) is still useful (Nedoluha & Watson 1992). In the calculations for Figure 3 in which the magnetic field is constant and the hyperfine components are blended, we also find that equation (9) is an excellent approximation. As found by Nedoluha & Watson (1992), the best value for the inferred magnetic field when the blending of the hyperfine components is included is about two-thirds of that given by equation (9). To understand the statistical relationship between the observed circular polarization and the turbulent magnetic field that actually exists in the masing disk, we also will utilize equation (9) as a benchmark.
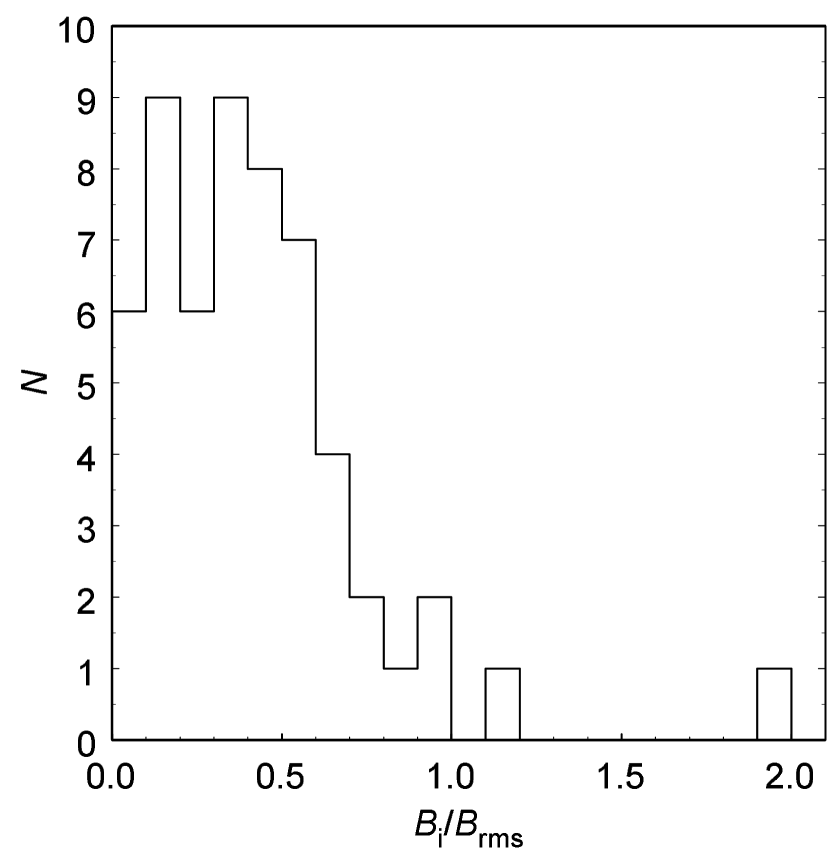
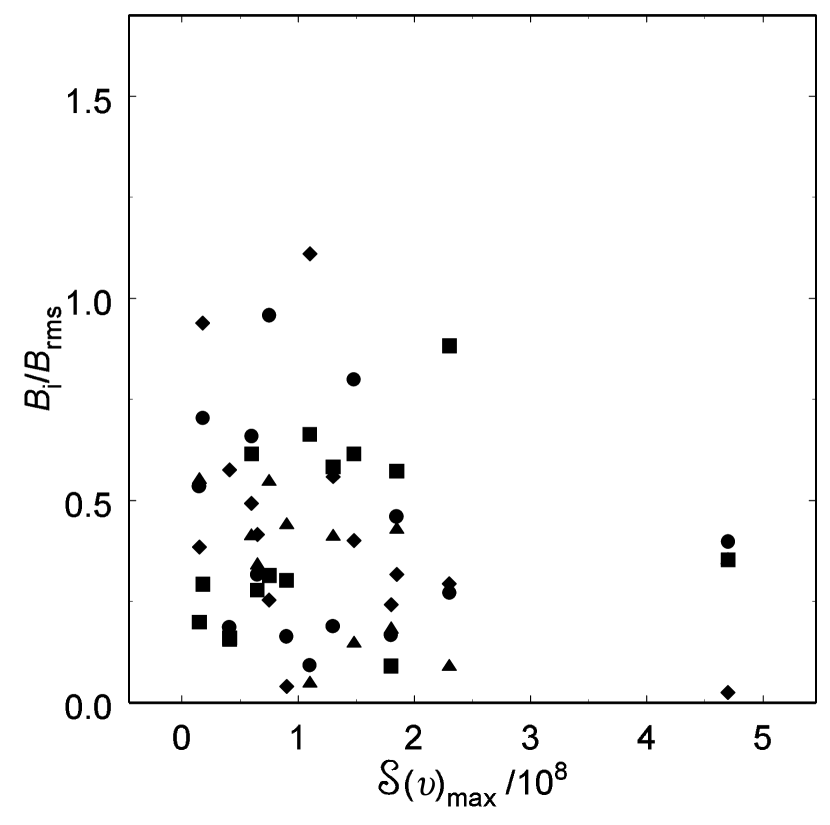
Since the magnetic field in our calculations is entirely turbulent, the circular polarization of a ray of radiation in a spectral line ideally should disappear as the size of the masing region becomes very large in comparison with the scale length for variations of the turbulent magnetic field, assuming a constant opacity parameter and no velocity gradients. Because the maser amplification occurs within a finite distance as a result of the Keplerian velocity gradients, the circular polarization due to turbulent magnetic fields that we have computed for Figure 3 and for other figures is not zero. Since this circular polarization depends upon the statistical variations of the magnetic field, it can be expected to vary in a statistical manner from one ray to another. To begin to see how the observations can be related to the turbulent magnetic field, we examine the relationship between the that are determined from equation (9) and the actual strength of the turbulent magnetic field . For this, the spectral features in Figure 2 are again utilized. A histogram of the ratio obtained from the spectra in the bottom panels of Figure 3 is shown in Figure 6. In addition to those shown in Figure 3, Stokes- spectra are computed for other realizations of the magnetic field to enlarge the sample size for creating the histogram. As defined in equation (9), is always positive. The statistical distribution that is indicated for actual magnetic fields is, of course, the same for both positive and negative values. For inferring the factor in equation (9) is taken to be that which is appropriate when the masing is due to the strongest hyperfine transition ( to 6) alone. Specifically, . To further assess the usefulness of this ratio when the magnetic fields are turbulent, we examine its sensitivity in Figure 7 to the peak flux in the spectral feature in which the ratio is being determined. The evidence in Figure 7 indicates that in the presence of turbulent velocity and magnetic fields, the ratio still is insensitive to the strength of the spectral line. The significance of Figure 6 is the following. Suppose that observational data for Stokes- are obtained for a number of features at the sides of NGC4258 and are interpreted on the basis of equation (9) assuming a two-level ( to 6) transition for the masing. The histogram in Figure 6 indicates that the median value of the magnitudes of the magnetic fields that are inferred will be about one-third of for magnetic fields in the disk that are entirely turbulent. If only upper limits can be obtained, the upper limit for will then be about three times median of the upper limits for the observed magnetic fields that are obtained from equation (9). Clearly this histogram depends upon the choice for the largest scale lengths in the distribution for the power spectrum of the Fourier components. We have reasoned that the choice made here provides a representative example. In view of the limited observational efforts to date and ambiguity about the exact description of the medium, a more extensive investigation of how this histogram depends upon the specific nature of the turbulent medium of a disk does not seem to be warranted at this time.
3.2 Maser Radiation from Directions toward the Center of the Disk
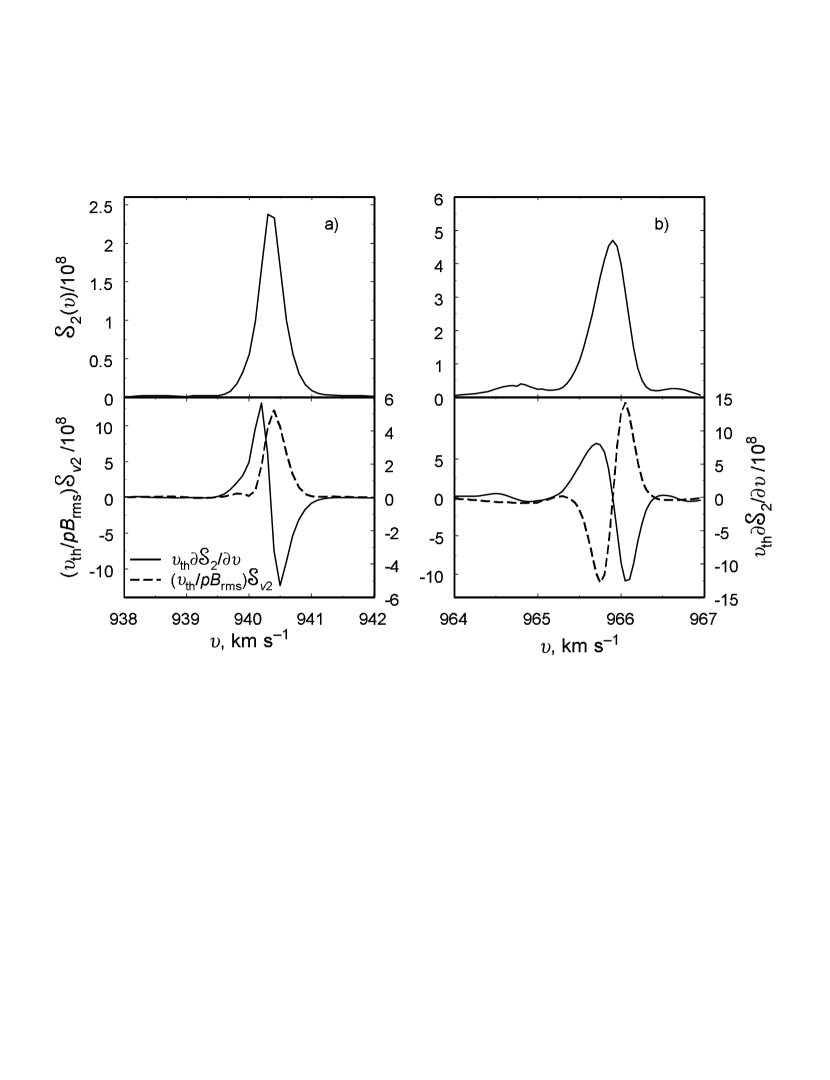
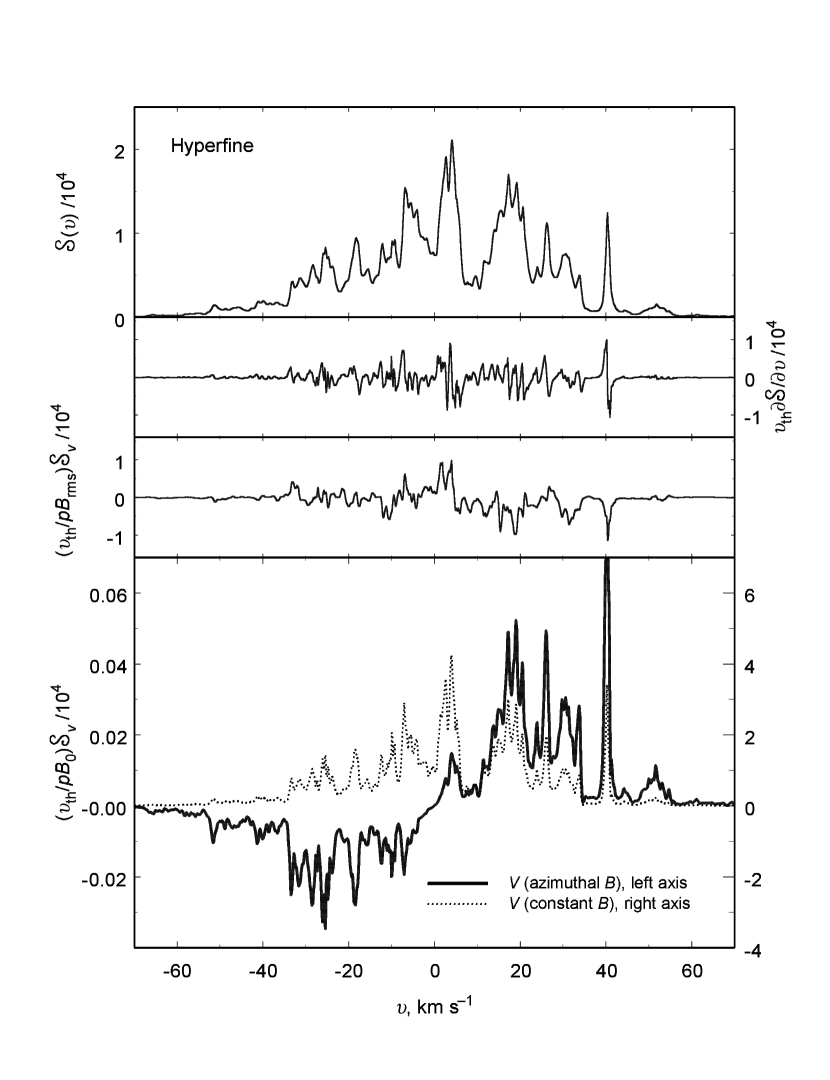
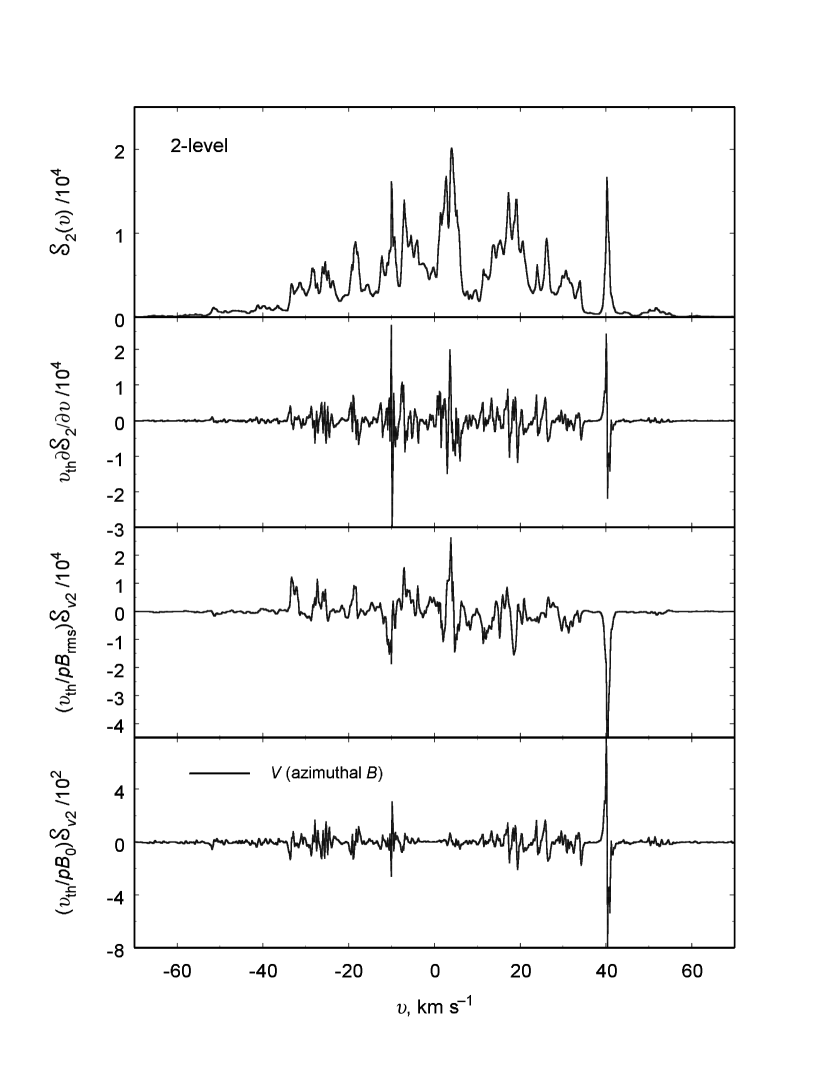
The general appearance of the spectrum of the maser radiation from directions toward the center of the disk (the systemic emission) is less sensitive in our calculations to the specific statistical realization of the velocity field than is the spectrum computed in the foregoing Section for the emission at the sides of the disk. It is noteworthy that the appearance of the spectrum of the central emission from NGC4258 has varied considerably over the decade or so in which it has been observed. The variability of this central emission in comparison with that from the sides of the disk is not surprising (e.g., Paper II). Comparison of the top panels in Figures 8 and 9 indicate that, as for the spectrum for the sides of the disk, the appearance of the spectrum for the energy flux is relatively insensitive to whether all three hyperfines are included in the calculation. The normalized fluxes in these figures are much smaller than those for the masers at the sides of the disk because the central masers are believed to be amplifying a bright continuum source with of about to degrees K. We have reasoned in Papers I and II that magnitudes of the normalized fluxes in Figures 8 and 9 are then appropriate for comparisons with the observations. When the normalized spectrum for the circular polarization resulting from the turbulent magnetic field is compared with the derivative spectrum in the second and third panels of Figure 8 for calculations that properly include the blending of hyperfine components, it is evident that they are dissimilar. Clearly, an analysis in which the observed Stokes- spectrum is fit to the derivative spectrum to obtain the line-of-sight component of the magnetic field is inappropriate. This is expected (as it was for the side features) since we already know that such comparisons are invalid when all three hyperfine components are properly included, even when there is no turbulence in the magnetic field. What may be surprising is that in Figure 9 where the hyperfine structure is ignored, there also is little if any similarity between the derivative and Stokes- spectra. That is, changes in the magnetic field along the line of sight are sufficient to alter completely the appearance of Stokes- even though the source function for Stokes- at any location along the path of the ray is proportional to the derivative of the source function for the energy flux at that location. To extract information from our calculations which may be useful to obtain a measure of the strength of the irregular magnetic field from potential observations, we have computed the standard deviation of the ratio over the range of Doppler velocities in the central emission. That is, we have computed the standard deviation for the spectrum in Figure 8 of the ratio of the flux in panel (c) to that in panel (a). From equation (8), we suspect that this quantity may be a measure of that is insensitive to uncertainties in the calculation other than the correlation length of the turbulence. For the realization on which Figure 8 is based, as well as for a second representative realization, this standard deviation is approximately 0.5. The analogous calculation for the same statistical realizations, but for a two-level masing transition, yields standard deviations that are approximately one. The mean value of the ratio should be close to zero. For both types of transitions, we compute means that are much smaller than the standard deviations. To obtain an indication of the sensitivity of this standard deviation to uncertainties in the calculation, we have performed computations with a larger value for the maser opacity so that the normalized flux is increased by a factor of ten. The standard deviations are increased by approximately fifty percent.
The bottom panels in Figures 8 and 9 show Stokes- spectra for a magnetic field that is constant and entirely in the azimuthal direction—that is, in circles about the center of the disk. Because of the rotation of the disk, an averaged magnetic field with this geometry is expected. No other magnetic field—including a turbulent magnetic field—is present in this case. Whereas in Figure 9, the spectrum for the two-level transition exhibits sign reversals on scales of 1–2 km s-1 similar to those of the derivative spectrum as is expected, the spectrum in Figure 8 with blended hyperfine components is quite different. Stokes- at negative Doppler velocities are entirely of one sign, and at positive velocities Stokes- is entirely of the opposite sign. The reversal in sign is, of course, caused by the reversal in sign of the line-of-sight component of the azimuthal magnetic field from one side of the disk to the other. The absence of sign reversals on scales of 1–2 km s-1 in this spectrum is to be expected from the spectra in Figure 3 and in earlier calculations (Nedoluha & Watson 1992). We also show the Stokes- spectrum for a constant magnetic field along the line-of-sight in the bottom panel of Figure 8. Since the angular portion of the disk that contributes to the central emission of NGC4258 is quite small, this spectrum is a good indication of Stokes- due to a constant, radial magnetic field.
The ratio of Stokes- for constant in Figure 8 (bottom panel) to the energy flux for the same spectrum (top panel of Figure 8), expressed as a dimensionless quantity, is given explicitly in Figure 10. The rapid variations of this ratio over a few km s-1 seem to be due mainly to the shift between the peaks of and for the spectral features (e.g., Figure 3). When these rapid variations are averaged, the ratio in Figure 10 changes only by about fifty percent over the approximately 80 km s-1 range of the Doppler velocities within which the central emission from NGC4258 is observed. If sharp spectral features can be distinguished in the central emission, equation (9) can be utilized to infer information about the strength of the magnetic field.
4 Discussion
As a first requirement for assessing the circular polarization based on calculations, it seems that the calculated spectrum for the energy flux should resemble the observed spectra and that this should be achieved within a plausible (albeit idealized) description for an accretion disk and for the masing process. Turbulence that is generally similar to what is being utilized here is believed likely to be a key feature of accretion disks and our calculated spectra do resemble those from the observations of NGC4258. The possibility cannot be excluded, however, that there are alternative descriptions which also can lead to spectra that are similar to what is observed. In detail, the thickness of the disk (potentially including a significant non-masing component) is poorly known (Papers I & II; Desch, Wallin & Watson 1998). This thickness tends to determine the longest wavelengths to which the turbulence extends, and is thus a key consideration for changes in direction of the magnetic field along the path of a ray of maser radiation. At a quantitative level, the results of our calculations should thus clearly be taken only as indications.
The strongest conclusions from these calculations might have been anticipated from our earlier calculations (Nedoluha & Watson 1992) for the circular polarization of water masers in the absence of turbulence and Keplerian rotation. That is, because the transition of water actually consists of three hyperfine components, the spectral profile for Stokes- is not proportional to the derivative (with respect to Doppler velocity) of the energy flux even when the magnetic field is constant. When the magnetic field varies along the path of a ray as it does for turbulent fields, the resulting spectral profile for Stokes- may (as a statistical fluctuation) in some cases appear to have a shape that is similar to that of the derivative of the energy flux. Conversely, when the magnetic field is turbulent, the profile for Stokes- for a two-level transition (which has no hyperfine structure) can be completely different from the derivative of the observed energy flux. Because of the sign reversals of a turbulent magnetic field that occur along the path of the radiation, the resulting circular polarization of the masing transition ordinarily will be reduced by an amount that will vary from one spectral line to another. For the turbulent magnetic fields that we adopt as representative, the magnetic field strengths that would be inferred from the radiation emitted at the sides of the disk by utilizing standard methods [equation (9)] will typically be about one-third of the rms value of the turbulent magnetic field (Figure 6). When the magnetic field does not change sign along the path of the radiation, the resulting Stokes- for the transition will be mostly of one sign across the line profile. As a consequence, Stokes- for the central (or systemic) maser emission that is due to an azimuthal magnetic field will only change sign at the center of the approximately 80 km s-1 range of Doppler velocities over which it is observed. For a radial magnetic field, Stokes- for the central emission will be essentially of one sign. Greater sensitivity to Stokes- and hence to the magnetic field can be achieved in observations of the central maser emission since the flux is much greater than that in the features from the sides of the disk of NGC4258. However, the azimuthal component of the magnetic field is likely to be the strongest in a Keplerian disk. Whereas this component is essentially parallel to the path of the radiation in the side features, its projection along the line-of-sight is only a few percent of the total azimuthal field for emission at Doppler velocities of a few tens of km s-1 relative to the systemic velocity of the galaxy.
Circular polarization of maser radiation where the Zeeman splitting is much less than the spectral line breadth can be caused by mechanisms other than the Zeeman effect (Nedoluha & Watson 1994; Wiebe & Watson 1998). Such mechanisms probably dominate for the circular polarization of the circumstellar SiO masers. However, they do require that the fractional linear polarization typically be greater than the fractional circular polarization by a factor of ten or more. Though perhaps not sensitive enough to exclude completely such possibilities, the absence of detectable linear polarization at the level of a few percent of the total flux does tend to support the premise that the circular polarization which may be detected can be interpreted in terms of the Zeeman effect to infer information about the strength of the magnetic field in the disk. It is noteworthy that the spectral line profile for Stokes- due to these non-Zeeman effects would probably be similar to that of a two-level transition. In any case, the observations can provide upper limits to the magnetic fields.
References
- Anderson & Watson (1993) Anderson, N., & Watson, W. D. 1993, ApJ, 407, 620
- Balbus & Hawley (1998) Balbus, S. A., & Hawley, J. F. 1998, Reviews of Modern Physics, 70, 1
- Brandenburg et al. (1995) Brandenburg, A., Nordlund, Å., Stein, R. F., & Torkelsson, U. 1995, ApJ, 446, 741
- Deguchi et al. (1995) Deguchi, S., Nakai, N., & Barvainis, R. 1995, AJ, 109, 507
- Deguchi & Watson (1989) Deguchi, S., & Watson, W. D. 1989, ApJ, 340, L17
- Desch et al. (1998) Desch, S., Wallin, B. K., & Watson, W. D. 1998, ApJ, 496, 775
- Desch et al. (1995) Dubinski, J., Narayan, R., & Phillips, T. G. 1995, ApJ, 448, 226
- Fiebig & Güsten (1989) Fiebig, D., & Güsten, R., 1989, A&A, 214, 333
- Gwinn (1994) Gwinn, C. R., 1994, ApJ, 429, 253
- Herrnstein et al. (1998) Herrnstein, J. R, Moran, J. M., Greenhill, L. J., Blackman, E. G., & Diamond, P. J. 1998, ApJ, 508, 243
- Miyoshi et al. (1995) Miyoshi, M., Moran, J. M., Herrnstein, J. R., Greenhill, L. J., Nakai, N., Diamond, P. J., & Inoue, M. 1995, Nature, 373, 127
- Moran (2000) Moran, J. M. 2000, Phil. Trans. Roy. Soc. Lond. A, 358, 797
- Nedoluha & Watson (1991) Nedoluha, G., & Watson, W. D. 1991, ApJ, 367, L63
- Nedoluha & Watson (1992) Nedoluha, G., & Watson, W. D. 1992, ApJ, 384, 185
- Nedoluha & Watson (1994) Nedoluha, G., & Watson, W. D. 1994, ApJ, 423, 394
- Stone et al. (1996) Stone, J. M., Hawley, J. F., Gammie, C. F., & Balbus, S. A. 1996, ApJ, 463, 656
- Vázquez-Semadeni et al. (2000) Vázquez-Semadeni, E., Ostriker, E. C., Passot, T., Gammie, C. F., Stone, J. M. 2000, in Protostars and Planets IV, eds V. Mannings, A. P. Boss, S. S. Russell (Tucson: Univ. of Arizona Press), p. 3
- Wallin et al. (1998) Wallin, B. K., Watson, W. D., & Wyld, H. W. 1998, ApJ, 495, 774 (Paper I)
- Wallin et al. (1999) Wallin, B. K., Watson, W. D., & Wyld, H. W. 1999, ApJ, 517, 682 (Paper II)
- Watson & Wallin (1994) Watson, W. D., & Wallin, B. K., 1994, ApJ, 432, L3
- Watson & Wyld (2000) Watson, W. D., & Wyld, H.W. 2000, ApJ, 530, 207
- Wiebe & Watson (1998) Wiebe, D. S., & Watson, W. D. 1998, ApJ, 503, L71