Rapid Follow-up of the Highly Collimated Optical Afterglow of GRB 010222111Based on observations collected at the FLWO 1.2-m telescope and the 1.8-m VATT
Abstract
We present the earliest optical observations of the optical counterpart to the Gamma-Ray Burst (GRB) 010222, obtained with the Fred L. Whipple Observatory 1.2-m telescope in passbands, starting hours after the burst (0.4 hours after public notification of the burst localization). We also present late -band observations of the afterglow obtained with the 1.8-m Vatican Advanced Technology Telescope days after the burst. The temporal analysis of our data joined with published data indicates a steepening decay, independent of wavelength, asymptotically approaching at early times (day) and at late times, with a sharp break at days. This is the second earliest observed break of any afterglow (after GRB 980519), which clearly indicates the importance of rapid multi-band follow-up for GRB afterglow research.
The optical spectral energy distribution, corrected for small Galactic reddening, can be fit fairly well by a single power-law with . However, when we fit using our data only, we obtain a shallower slope of , in excellent agreement with the slope derived from our low-resolution spectrum ().
The spectral slope and light curve decay slopes we derive are not consistent with a jet model despite the presence of a temporal break. Significant host dust extinction with a star-burst reddening law would flatten the spectral index to match jet predictions and still be consistent with the observed spectral energy distribution. We derive an opening angle of , smaller than any listed in the recent compilation of Frail et al. The total beamed energy corrected for the jet geometry is erg, very close to the “standard” value of erg found by Frail et al. for a number of other bursts with light-curve breaks.
1 INTRODUCTION
The BeppoSAX satellite (Boella et al. 1997) has brought a new dimension to gamma-ray burst (GRB) research, by rapidly providing good localization of several bursts per year. This has allowed many GRBs to be followed up at other wavelengths, including X-ray (Costa et al. 1997), optical (Groot et al. 1997; van Paradijs et al. 1997) and radio (Frail et al. 1997). Good positions have also allowed redshifts to be measured for a number of GRBs (e.g. GRB 970508: Metzger et al. 1997), providing a definitive proof of their cosmological origin.
The very bright GRB 010222 was detected by BeppoSAX on February 22.30799 UT (Piro 2001) and ranked as second in fluence and third in flux from all GRBs observed by BeppoSAX (in ’t Zand et al. 2001).
We began the effort to optically monitor the field of GRB 010222, starting on February 22.4595 UT, i.e. only hours after the burst (with hours of that delay being external to our effort), using the Fred L. Whipple Observatory (FLWO) 1.2-m telescope. The optical counterpart to GRB 010222 was first announced by Henden (2001a) and we discovered it independently (McDowell et al. 2001). The optical transient (OT) was easily recognized as a bright (), new object not present in the DSS image at the position of (McDowell et al. 2001). The OT declined by mag during about hours of the first night’s observations (Henden & Vrba 2001; Stanek et al. 2001a). Absorption line systems at and possibly also at 0.928 were seen in the optical spectrum of GRB 010222 taken within five hours of the burst with the FLWO 1.5-m telescope (Garnavich et al. 2001; Jha et al. 2001a), providing a lower limit to the redshift of the GRB source. The BeppoSAX NFI follow-up of GRB 010222 started about hours after the burst (Gandolfi 2001) and detected a strong X-ray afterglow with a position consistent with the optical transient. The afterglow was also detected in the radio (Berger & Frail 2001), in the sub-millimeter (Fich et al. 2001) and in the near infrared (Di Paola et al. 2001).
Jha et al. (2001b) have presented our spectroscopic data for GRB 010222, and Masetti et al. (2001b), Lee et al. (2001) and Sagar et al. (2001) have presented results of multi-band optical observations of the afterglow. In this paper we discuss rapid photometric follow-up of the GRB 010222 afterglow, with particular attention to the multi-band temporal behavior and broad-band spectral properties of the GRB OT.
2 THE PHOTOMETRIC DATA
Most of our data were obtained with the F. L. Whipple observatory (FLWO) 1.2-m telescope on three nights: 2001 February 21/22, February 22/23 and February 24/25 UT. We used the “4Shooter” CCD mosaic (Szentgyorgyi et al. 2001) with four thinned, back-side illuminated, AR-coated Loral CCDs. The camera has a pixel scale of /pixel and a field of view of roughly on a side for each chip. The data were taken in the CCD binning mode. We have obtained useful images, with exposure times ranging from sec to sec222 photometry and our CCD frames are available through anonymous ftp on cfa-ftp.harvard.edu, in the directory pub/kstanek/GRB010222, and through the WWW at http://cfa-www.harvard.edu/cfa/oir/Research/GRB/..
Deep images at late-time were obtained at the 1.8-m Vatican Advanced Technology Telescope (VATT) on 2001 March 18 and 19 (UT). Twelve exposures of 900 seconds each were taken in -band over two nights with an average seeing of 1.2′′. The VATT CCD was binned to provide a scale of 0.4′′/pixel.
The data were reduced using elements of the photometric data pipeline of the DIRECT project (Kaluzny et al. 1998; Stanek et al. 1998), based on the DAOphot PSF-fitting image reduction package (Stetson 1987; 1992). VATT data were shifted and then combined using a minmax rejection algorithm.
A calibration of the field was obtained by Henden (2001b) in the bands. We obtained an independent calibration with the VATT telescope on 2001 March 19 (UT) using all-sky photometry of Landolt standard stars (Landolt 1992). Comparison of our calibration in the -bands with that of Henden (2001b) and Sagar et al. (2001) reveals small differences of about mag for the stars in the field. Such small differences do not affect significantly any of the results in this paper, so for consistency with other photometric studies of GRB 010222 we adopt the calibration of Henden (2001b). For the -band, these differences are larger, with the VATT-calibrated bright stars in the field being fainter from Henden’s by about mag. We decided to use VATT calibration for our -band data.
3 THE TEMPORAL BEHAVIOR
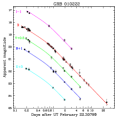
We plot the GRB 010222 light curves in Fig.1. Most of the early data come from the FLWO 1.2-m telescope (McDowell et al. 2001; Stanek et al. 2001a), with additional later data from FLWO (Stanek et al. 2001b; Stanek & Falco 2001) and from the VATT 1.8-m telescope (Garnavich et al. 2001b). To obtain as clear a picture as possible of the temporal evolution of the afterglow, we include a few other uniformly reduced data sets into the analysis. These are data of Masetti et al. (2001b) (their -band magnitudes were revised upwards by about mag: Masetti, private communication), -band data of Billings (2001) reduced by Masetti et al. (2001b), -band data of Holland et al. (2001) and -band data of Veillet (2001a,b). To allow for small differences in the reduction procedures and photometric calibration, uncertainties smaller than mag in our and other data were increased to mag. The combined data set has the following number of points: , for a total of 88 points.
As noticed by Masetti et al. (2001a), the optical -band data from days after the GRB showed clear departure from the initial shallow power-law of about (but see below) determined by Price et al. (2001b), Fynbo et al. (2001) and Stanek et al. (2001b). This trend of a steepening decay was confirmed by Stanek & Falco (2001), Veillet (2001a) and Holland et al. (2001).
To describe the temporal evolution of the GRB 010222 optical counterpart, we fit the compiled data with the smoothly broken power-law model of Beuermann et al. (1999) (see also Sagar et al. 2000):
| (1) |
where is the time of the break, is the flux at and controls the sharpness of the break, with larger implying a sharper break. This formula describes power-law decline at early times () and another power-law decline at late times (). For this formula converts to the one used by Stanek et al. (1999) to describe the behavior of GRB 990510 afterglow. This combined fit has nine free parameters: five normalization constants (one for each band) and four shape parameters . We obtain the following values for the parameters: day. These numbers are in good agreement with these derived by Sagar et al. (2001), but are quite different from those of Masetti et al. (2001), which can be probably explained by somewhat different data sets used for fits. When we ran the combined fit to our data only (24 points), we obtained day.
The results of the combined fit are shown as the continuous lines in the Fig.1. Considering that these data are inhomogeneous, the combined fit represents very well the overall temporal behavior of the data, with . It should be noted that the afterglow has a very blue color, , compared to most field stars (star “A” of McDowell et al. 2001 has ), so special care should be taken when deriving OT magnitudes in the filter, which is notorious for exhibiting strong color terms.
4 BROAD-BAND SPECTRAL ENERGY DISTRIBUTION
GRB 010222 is located at Galactic coordinates of . To remove the effects of the Galactic interstellar extinction we used the reddening map of Schlegel, Finkbeiner & Davis (1998, hereafter: SFD). The SFD Galactic reddening towards the burst is small, , which corresponds to expected values of Galactic extinction ranging from to , for the Landolt (1992) CTIO filters and the standard () reddening curve of Cardelli, Clayton & Mathis (1989).
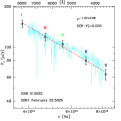
We synthesize the spectrum from our data by interpolating the magnitudes to a common time. As discussed in the previous section, the optical colors of the GRB 010222 counterpart do not show significant variation. We therefore select the epoch of February 22.5025 UT (hours after the burst) for the color analysis, which coincides with our first -band image and is roughly in the middle of our first night’s data. We convert the magnitudes to fluxes using the effective frequencies and normalizations of Fukugita, Shimasaku & Ichikawa (1995). These conversions are accurate to about 5%, so to account for the calibration and interpolation errors we assign to each flux a 7% error (10% for the -band). Note that while the error in the reddening value has not been applied to the error-bars of individual points, we include it in the error budget of the fitted slope (following SFD we took the error in to be mag).
The results are plotted in Fig.2 for the dereddened fluxes. The spectrum is fitted reasonably well by a single power-law with , somewhat steeper than the spectral slope derived from our low-resolution spectrum (: Jha et al. 2001b), although there is a hint of slight downward curvature towards the blue end of the FLWO 1.5-m spectrum overplotted in Fig.2. Indeed, when we fit using only our data, we obtain a slope of , in excellent agreement with Jha et al. (2001b). Also, the spectral slope of found by Lee et al. (2001) agrees very well with Jha et al. We agree as well with Lee et al. in the slopes derived when also using data.
As mentioned above, both in our broad-band spectrum and in the low-resolution spectrum of Jha et al. (2001b) there is a hint of downward curvature towards the blue end of the spectrum, which is also present in Lee et al. (2001) data. Lee et al. (2001) discuss possible reasons for such a downturn, including SMC-like extinction in the host galaxy (possibly close to the GRB). They find a good fit to their broad-band spectrum when fitting a spectrum with an intrinsic slope of extincted by mag of SMC-like extinction.
5 DISCUSSION
We find that GRB 010222 is another example of an optical afterglow which shows a break in its light curve. GRB 010222 has the second earliest observed break (after GRB 980519: Jaunsen et al. 2001) and one of the most shallow initial decay rates. Here we compare this burst to other well-observed GRB afterglows.
While the Lorentz factor is large, there is little observational difference between a spherically expanding shell and a jet. Only when the inverse Lorentz factor exceeds the opening angle of the jet does the difference between an isotropic model and a beamed model become apparent and this should appear as a break in the afterglow light curve. Sari, Piran, & Halpern (1999) showed that the length of time between the burst and the afterglow break can be used to estimate the jet opening angle, although the estimate depends weakly on the burst fluence and the density of the surrounding gas (which we take to be 0.1 ). The GRB 010222 fluence in the keV range of BeppoSAX was (in ’t Zand et al. 2001) at a redshift of (Jha et al. 2001b argue that the system is very likely the GRB host galaxy itself), corresponding to a luminosity distance of Gpc (assuming ). Thus, the isotropic -ray energy release was erg. GRB 010222 had the earliest observed break of any afterglow, occurring at days after the burst, which suggests a highly collimated jet. The derived opening angle of is indeed smaller than any listed in the compilation of Frail et al. (2001). The total beamed energy corrected for the jet geometry becomes erg, which is extremely close to the “standard” value of erg found by Frail et al. (2001) for a number of other bursts with light-curve breaks.
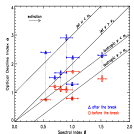
The optical light curve and spectral indices for the burst are expected to depend on the electron energy distribution and whether the observations are made above or below the electron cooling break frequency. Sari et al. (1999) predict that at frequencies less than the cooling break, the light curve index, , is related to the spectral index, by for an isotropic burst and for a jet. Here, denotes the index before the temporal break, since at that time it is expected to be indistinguishable from an isotropic burst. For frequencies above the cooling break the initial slope is and the final slope is simply . We can plot these relations in an versus space as four lines with the slope for a beamed burst being steeper than that of an isotropic afterglow. We expect the index before the temporal break to fall on one of the two isotropic models and indeed, when we place a number of well-observed afterglows with temporal breaks on the plot (Fig.3), tends to fall near the isotropic models and along the jet models. Well-observed bursts with light curve breaks are shown: GRB 990123 (Holland et al. 2000), GRB 990510 (Stanek et al. 1999), GRB 991216 (Garnavich et al. 2000a; Halpern et al. 2000), GRB 000301C (Garnavich et al. 2000b; Rhoads & Fruchter 2001), GRB 980519 (Jaunsen et al. 2001), GRB 000926 (Price et al. 2001a). We do not include GRB 991208 (Castro-Tirado et al. 2001), which is well observed until the ‘break’ defined by only one point.
GRB 000926 (the rightmost pair of points in the figure) does not fit very well on the plot as the light curve index after the break is much too small for the Sari et al. (1999) jet model. Price et al. (2001a) suspect that extinction could explain the mismatch between the temporal and spectral slopes of this object. Extinction will steepen the spectral slope, moving the points to the right in Fig.3, while leaving the light curve parameters unaffected as long as there is no significant color change in the afterglow.
For GRB 010222, the final temporal slope is also too small for jet models given the observed . The model can be saved if the spectral slope was intrinsically in the range and has been steepened by host extinction. Indeed, Lee et al. (2001) find a good fit to their broad-band spectrum when fitting an intrinsic slope of extincted by mag of SMC-like extinction (their Fig.2).

The magnitude of the shift in light curve slope across the break, , is independent of extinction to first order so it can provide clues to the break process without the uncertainty introduced by dust. The size of the shift depends on the electron energy distribution, but Panaitescu & Kumar (2000) point out that the spectral cooling break moving through the optical band could also cause or contribute to a light curve break. The density distribution of the circumburst environment further influences the break amplitude making it difficult to sort out all the possible combinations of parameters. We plot the change in slope versus the equivalent isotropic energy release of the burst in Fig.4. For an interstellar medium an electron cooling break alone could only change the slope by which is inconsistent with all but one burst. But, for a circumstellar gas distribution the cooling break can change the slope by as much as 1.25 for large values of the spectral index. This slope change is still too small to explain two observed bursts requiring that at least some of the events be collimated.
The number of well-observed break afterglows is still small, making any conclusions about Fig.4 somewhat foolhardy. A majority of the break bursts have while two of the bursts have significantly larger break amplitudes of . There may be a mild correlation with equivalent isotropic energy which suggests that the smallest jump in light curve index occurs at the highest isotropic energies. Why this apparent correlation may exist is unclear, but given the relation between isotropic energy and jet opening angle suggested by Frail et al. (2001), the break amplitude may be related to the geometry of the burst.
6 CONCLUSIONS
We presented rapid observations of GRB 010222, starting hours after the burst. Analysis of the data indicates a steepening decay, independent of optical wavelength, with power-law behavior at early times (day) and second power-law at late times, with the break time at days. This is yet another example of such a broad-band break for a GRB OT and it is very well documented. The broad-band spectral slope and early break time stress the importance of multi-band optical observations for GRB studies, especially early after the burst.
The spectral slope and light curve decay slopes we derive are not consistent with the Sari et al. (1999) jet model despite the presence of a temporal break. As shown by Lee et al. (2001), significant host dust extinction with a star-burst reddening law would flatten the spectral index by as much as 0.5 and match predictions of a jet geometry. Such extinction would still be consistent with our observed spectral energy distribution. We derive an opening angle of , smaller than any listed in the recent compilation of Frail et al. (2001). The total beamed energy corrected for the jet geometry is very close to the ‘standard’ energy value found by Frail et al. for a number of other bursts with light-curve breaks.
We find a correlation between the estimated isotropic energy release and the change in power-law index across the light curve break with the higher energy bursts showing the smallest change in light curve slope. It is not clear why this correlation might exist, but the relation between isotropic energy and jet opening angle suggests that the jet geometry may be involved, with bursts which are more highly collimated showing a shallower break.
References
- (1)
- (2) Berger, E., & Frail, D. A. 2001, GCN Circular 968
- (3)
- (4) Beuermann, K., et al. 1999, A&A, 352, L26
- (5)
- (6) Boella, G., Butler, R. C., Perola, G. C., Piro, L., Scarsi, L., & Bleeker, J. A. M. 1997, A&AS, 122, 299
- (7)
- (8) Cardelli, J. A., Clayton, G. C., & Mathis, J. S. 1989, ApJ, 345, 245
- (9)
- (10) Castro-Tirado, A. J., et al. 2001, A&A, in press (astro-ph/0102177)
- (11)
- (12) Di Paola, A., et al. 2001, GCN Circular 977
- (13)
- (14) Fich, M., et al. 2001, GCN Circular 971
- (15)
- (16) Frail, D. A., Kulkarni, S. R., Nicastro, L., Feroci, M., & Taylor, G. B. 1997, Nature, 389, 261
- (17)
- (18) Frail, D. A., et al. 2001, Nature, submitted (astro-ph/0102282
- (19)
- (20) Fukugita, M., Shimasaku, K., & Ichikawa, T. 1995, PASP, 107, 945
- (21)
- (22) Fynbo, J. P. U., et al. 2001, GCN Circular 975
- (23)
- (24) Gandolfi, G. 2001, GCN Circular 966
- (25)
- (26) Garnavich, P. M., Jha, S., Pahre, M. A., Stanek, K. Z., Kirshner, R. P., Garcia, M. R., Szentgyorgyi, A. H., & Tonry, J. L. 2000a, ApJ, 543, 61
- (27)
- (28) Garnavich, P. M., Loeb, A., & Stanek, K. Z. 2000b, ApJ, 544, L11
- (29)
- (30) Garnavich, P. M., Pahre, M. A., Jha, S., Calkins, M., Stanek, K. Z., McDowell, J., & Kilgard, R. 2001a, GCN Circular 965
- (31)
- (32) Garnavich, P. M., Quinn, J., & Stanek, K. Z. 2001b, GCN Circular 1009
- (33)
- (34) Groot, P. J., et al. 1997, IAU Circ. 6584
- (35)
- (36) Henden, A. A. 2001a, GCN Circular 961 and 962
- (37)
- (38) Henden, A. A. 2001b, GCN Circular 987
- (39)
- (40) Henden, A. A., & Vrba, F. 2001, GCN Circular 967
- (41)
- (42) Holland, S., et al. 2000, A&A, 364, 467
- (43)
- (44) Holland, S., et al. 2001, GCN Circular 1002
- (45)
- (46) Jaunsen, A. O., Hjorth, J., Bjornsson, G., Andersen, M. I., Pedersen, H., Kjernsmo, K., Korhonen, H., Sorensen, P. M., & Palazzi, E. 2001, ApJ, 546, 127
- (47)
- (48) Jha, S., Matheson, T., Calkins, M., Pahre, M. A., Stanek, K. Z., McDowell, J., Kilgard, R., & Garnavich, P. M. 2001a, GCN Circular 974
- (49)
- (50) Jha, S., Pahre, M. A., Garnavich, P. M., Calkins, M. L., Kilgard, R. E, Matheson, T., McDowell, J. C., , & Stanek, K. Z. 2001b, ApJ, 554, L155
- (51)
- (52) Kaluzny, J., Stanek, K. Z., Krockenberger, M., Sasselov, D. D., Tonry, J. L., & Mateo, M. 1998, AJ, 115, 1016
- (53)
- (54) Landolt, A. 1992, AJ, 104, 340
- (55)
- (56) Lee, B. C., et al. 2001, ApJ, in press (astro-ph/0104201)
- (57)
- (58) Masetti, N., et al. 2001a, GCN Circular 985
- (59)
- (60) Masetti, N., et al. 2001b, A&A, submitted (astro-ph/0103296)
- (61)
- (62) McDowell, J., Kilgard, R., Garnavich, P. M., Stanek, K. Z., & Jha, S. 2001, GCN Circular 963
- (63)
- (64) Metzger, M. R., et al. 1997, Nature, 387, 879
- (65)
- (66) Monet, D., et al. 1996, USNO-SA2.0, (U.S. Naval Observatory, Washington DC)
- (67)
- (68) Panaitescu, A., & Kumar, P. 2000, ApJ, submitted (astro-ph/0010257)
- (69)
- (70) Piro, L. 2001, GCN Circular 959
- (71)
- (72) Price, P. A., et al. 2001a, ApJ, 549, L7
- (73)
- (74) Price, P. A., et al. 2001b, GCN Circular 973
- (75)
- (76) Sari, R., Piran, T., & Halpern, J. P. 1999, ApJ, 519, L17
- (77)
- (78) Sagar, R., Mohan, V., Pandey, S. B., Pandey, A. K., Stalin, C. S., & Castro Tirado, A. J. 2000, BASI, 28, 499
- (79)
- (80) Sagar, R., Stalin, C. S., Bhattacharya, D., Pandey, S. B., Mohan, V., Castro Tirado, A. J., Pramesh Rao, A., Trushkin, S. A., & Nizhelskij, N. A. 2001, BASI, submitted (astro-ph/0104249)
- (81)
- (82) Schlegel, D. J., Finkbeiner, D. P., & Davis, M. 1998, ApJ, 500, 525
- (83)
- (84) Stanek, K. Z., Kaluzny, J., Krockenberger, M., Sasselov, D. D., Tonry, J. L., & Mateo, M. 1998, AJ, 115, 1894
- (85)
- (86) Stanek, K. Z., Garnavich, P. M., Kaluzny, J., Pych, W., & Thompson, I. 1999, ApJ, 522, 39
- (87)
- (88) Stanek, K. Z., Jha, S., McDowell, J., Kilgard, R. Roll, J., Garnavich, P. M., & Kaluzny, J. 2001a, GCN Circular 970
- (89)
- (90) Stanek, K. Z., Challis, P., Jha, S., Kilgard, R., McDowell, J., & Garnavich, P. M. 2001b, GCN Circular 983
- (91)
- (92) Stanek, K. Z., & Falco, E. 2001, GCN Circular 991
- (93)
- (94) Stetson, P. B. 1987, PASP, 99 191
- (95)
- (96) Stetson, P. B. 1992, in ASP Conf. Ser. 25, Astrophysical Data Analysis Software and Systems I, ed. D. M. Worrall, C. Bimesderfer, & J. Barnes (San Francisco: ASP), 297
- (97)
- (98) Szentgyorgyi, A. H., et al. 2001, in preparation
- (99)
- (100) van Paradijs, J., et al. 1997, Nature, 386, 686
- (101)
- (102) Veillet, C. 2001a, GCN Circular 1000
- (103)
- (104) Veillet, C. 2001b, GCN Circular 1003
- (105)
- (106) in ’t Zand, J. J. M., et al. 2001, ApJ, submitted
- (107)