Sco X-1: Energy Transfer from the Core to the Radio Lobes
Abstract
The evolution of the radio emission from Sco X-1 is determined from a 56-hour continuous VLBI observation and from shorter observations over a four-year period. The radio source consists of a variable core near the binary, and two variable compact radio lobes which form near the core, move diametrically outward, then fade away. Subsequently, a new lobe-pair form near the core and the behavior repeats. The differences in the radio properties of the two lobes are consistent with the delay and Doppler-boosting associated with an average space velocity of 0.45c at to the line of sight. Four lobe speeds, between 0.32c to 0.57c, were measured for several lobe-pairs on different days. The speed during each epoch remained constant over many hours. The direction of motion of the lobes over all epochs remained constant to a few degrees.
Two core flares are contemporaneous with two lobe flares after removal of the delay associated with an energy burst moving with speed in a twin-beam from the core to each lobe. This is the first direct measurement of the speed of energy flow within an astrophysical jet. The similarity of the core and lobe flares suggests that the twin-beam flow is symmetric and that the core is located near the base of the beam.
1 Introduction
Sco X-1 is a low-mass binary system (LMXB) with strong, persistent X-ray emission. It is a ‘Z-type’ LMXB, named for a characteristic shape of its X-ray color-color diagram. It also exhibits quasi-periodic X-ray oscillations (Hasinger & van der Klis 1989; van der Klis et al. 1996). The binary has an orbital period of 0.787d (Gottlieb et al., 1975), the degenerate object is probably a neutron star, with a one solar mass companion of unknown spectral type (Cowley & Crampton 1975).
From eight Very Long Baseline Array (VLBA) observations between 1995 and 1998, a distance of kpc was obtained from measurements of the trigonometric parallax of Sco X-1 (Bradshaw et al., 1999). The radio emission also varied over tens of minutes and relativistic motion was detected. Thus, Sco X-1 exhibited the properties of Galactic-jet sources (Mirabel & Rodriguez, 1999) with similarities to extragalactic radio sources (Blandford & Rees 1974). However, these observations were too short and too intermittent to determine the properties of Sco X-1.
We, therefore, observed Sco X-1 with milliarcsecond (mas) resolution over a 56-hour period on 1999 June 11-13 (MJD 51340-2). Extensive optical and X-ray observations were also made. This letter reports on the general properties of Sco X-1 with emphasis on the kinetic properties of the source. Further discussions of the radio observations and the nature of Sco X-1 are given in Paper II (Fomalont et al., 2001). The nature of the x-ray emission and accretion processes in Sco X-1, and the interaction of the radio core and the binary system are given elsewhere (Titarchuk et al., 2001; Bradshaw et al., 2002; Geldzahler et al., 2002).
2 The Radio Observations:
The observations in 1999 June consisted of seven consecutive 8-hour VLBI observations cycling among three different arrays: the VLBA with the VLA, the APT (Asia-Pacific Telescope: Australia Telescope Compact Array, Ceduna, Hartebeesthoek, Kashima, Mopra, Parkes and Shanghai), and the EVN (European VLBI Network: Effelsberg, Jodrell Bank, Medicina, Noto, Westerbork, plus Hartebeesthoek and the Green Bank 140-ft). With the VLBA, 1.7 GHz and 5.0 GHz observations were interleaved in time. With the APT and EVN, observations were made at 5.0 GHz only. All data associated with the observations of Sco X-1 were calibrated using simultaneous observations of a nearby background 10-mJy radio source111This source is one of the two radio objects which were previously thought to be associated with Sco X-1. They are unrelated background objects (Fomalont & Geldzahler, 1991) at a distance from Sco X-1 of in position angle . The radio emission from Sco X-1 extends in position angle ., by which all images were registered to an accuracy of mas (Bradshaw et al., 1999). Because of the significant flux density variations and component motions, images were made from data sets as short as 50 minutes (snap-shots) in order to follow the changes in the radio emission.
3 The Radio Snap-shots of Sco X-1
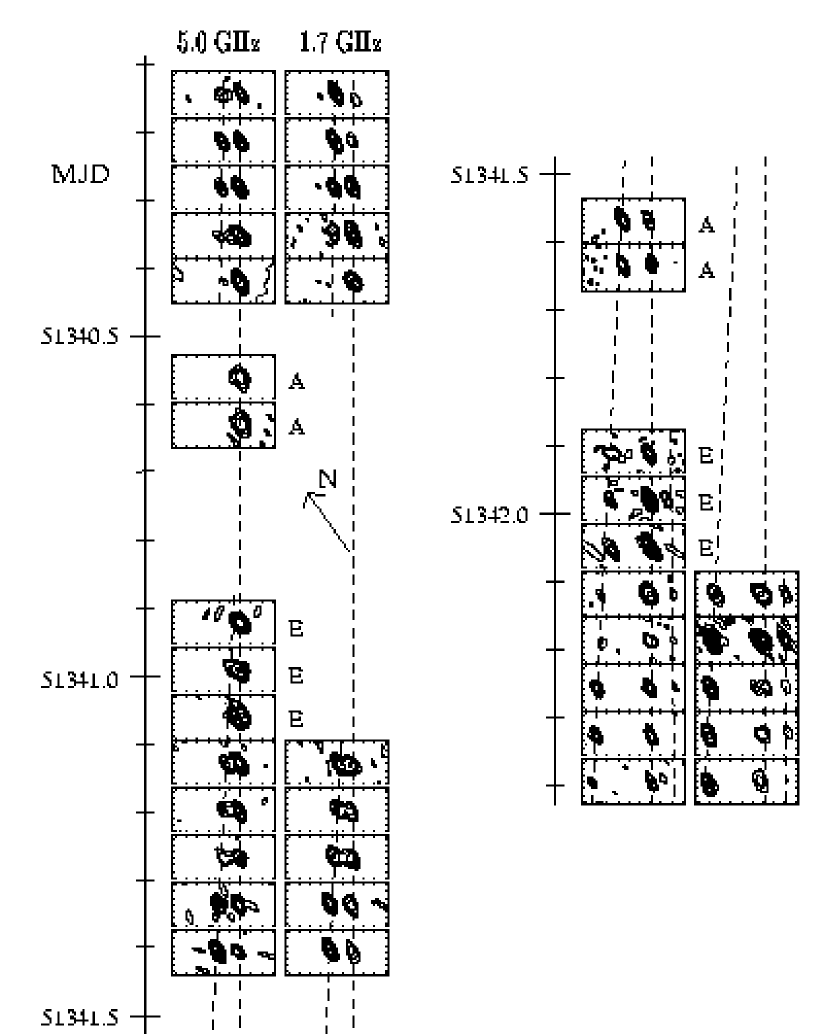
The sequence of the radio snap-shots of Sco X-1 during the 1999 June observations is displayed in Figure 1. More frequent, higher-resolution 5-GHz snap-shots are displayed in Paper II. The radio structure showed three components: a radio core within a few mas of the binary; a compact moving component north-east of the core, called the NE lobe, and a fainter component south-west of the core, called the SW lobe, detected most strongly on MJD 51342. Occasionally, faint extended emission was detected between the core and NE lobe.
The flux density variations of the three major components are shown in Figure 2. Sco X-1 evolved through several stages during these observations. The first NE lobe disappeared at MJD 51340.4 after reaching a distance of 20 mas from the core. The core component, on the other hand, increased in flux density during this period. For the next nine hours, Sco X-1 consisted of only the core component. At MJD 51340.7 the core brightened and by MJD 51340.9 a new NE lobe (#2) emerged from the core. Some extended emission between these two separating components persisted until MJD 51341.3, during which time the flux density of both components decreased. Over the next 30 hours the NE lobe moved directly away from the core, reaching a separation of 50 mas. Both the core and NE lobe varied significantly in flux density; The NE lobe peak (N3) at MJD 51341.1 and the core peak (C4) at MJD 51341.9 reached 20 mJy at 5 GHz. There was no apparent correlation of the core flares with the phase of the binary orbit. The SW lobe, detected most strongly on MJD 51342, was located about half as far from the core as the NE lobe.
For the observations between 1995 and 1998, Sco X-1 was relatively weak and an accurate motion of the NE lobe could not be measured. The one exception was the observations on 1998 February 27-28 1998 (MJD 50871-2), consisting of two six-hour VLBA observations separated by 18 hours, and these images are shown in Paper II, Figure 5. On MJD 50871, the NE lobe was about 20 mas from the core, and moved away at a speed similar to that in 1999 June. The SW lobe was also present and its motion, in the opposite direction as the NE lobe, was measured.
4 Lobe Velocities and Relativistic Effects
Figure 3 shows the observed separation of the NE and SW lobes from the core. For the 1999 June observations the velocity in the plane of the sky of the NE lobe (#1) was mas hr-1. (For a measured distance to Sco X-1 of 2.8 kpc, one mas = 2.8 AU = km. A projected velocity of 1 mas hr-1 = 0.388c.) After emerging from the core, the NE lobe (#2) lobe speed was mas hr-1. At MJD 51341.4 the NE lobe flared and its speed abruptly decreased to mas hr-1. Although the NE lobe varied considerably in flux density over the next 30 hours, its speed remained nearly constant. For the 1998 February observations, the velocity of the NE lobe on MJD 50871 was mas hr-1, with no significant departure from uniform motion.
The speeds for the weaker SW lobes were determined less accurately. On MJD 50872 mas hr-1, and on MJD 51342 mas hr-1. Further evidence of the motion of the SW lobe is described in Paper II which shows that whenever the SW lobe is detected, its distance from the core is always about half that of the NE lobe. Since the NE lobe was clearly moving away from the core, this ratio is also equal the ratio of the speed of the SW lobe, , to the speed of the NE lobe, and is using all observations of Sco X-1. Such lobe velocity differences have been observed in other Galactic-jet sources (Mirabel & Rodriguez, 1999) and are caused by delay effects from their relativistic motion.
The expected Doppler-boosting (attenuation) of the approaching (receding) component was observed in Sco X-1. An analysis in Paper II derives an average flux density ratio between the SW and NE lobes of . On the other hand the spectral index, (S), of the two lobes should not be affected significantly by a large space motion and, indeed, both lobes had during the flaring states. The lobe angular diameters were also similar. This comparison of the radio emission from the NE and SW lobes suggests that they are intrinsically similar, but their appearances are strongly affected by the delay and Doppler effects of their space motion.
With an accurate distance to Sco X-1, the lobe space motion can be determined solely from the observed lobe kinetics. Although four speeds between 0.28c and 0.68c in the plane of the sky were measured for the NE lobe, there were two periods when the lobe speed remained constant for over one day: MJD 50871-2 with and MJD 51341-2 with . Thus, we adopt a typical speed of the NE lobe of with the estimated error derived from the spread of the measured speeds and the distance uncertainty to Sco X-1. Since the position angle of the radio axis of Sco X-1 in the plane of the sky over the five year observation period remained within a few degrees of (Paper II), the direction of the space velocity of the lobes was also constant to this same level. Hence, any change in the observed speed of the lobes is caused by changes in speed and not in direction. With the derived values of and , the average space velocity of the lobes can be determined (Blandford et al., 1977):
| (1) |
| (2) |
where is the true speed of the lobes moving in direction with respect to the observer. The average space velocity of the lobes is then . The quoted errors are the one-sigma uncertainty. The four measured space velocities for different lobe-pairs were: 0.32c, 0.43c, 0.46c and 0.57c.
The flux density ratio for the SW to NE lobe from Doppler-boosting expected from the derived space velocity is (Blandford & Königl, 1979). For k=2, which is appropriate for an optically thin discrete component, and as measured, we predict R. However, if the magnetic field distribution in the lobes is anisotropic, the flux ratio could be considerably smaller (Cawthorne, 1991). The observed flux density ratio, R=0.12 is in reasonable agreement with that expected from the Doppler boosting which was derived solely from the lobe motions.
5 The Correlation of Flux Density Variations and the Jet Speed
The large flux density variations of the core and the lobes during the 1999 June observations are shown in Figure 2. The flare characteristics of all components were similar; a factor of 2 to 10 increase in flux density; (except for flare C1); a sharper rise time than decay time; a flare width of about three hours; and a lobe angular size mas.
In Paper II we suggest that the NE and SW lobes are moving hot-spots whose internal and kinetic energies are supplied by the disruption of the energy flow in an oppositely-directed twin-beam formed near an accretion disk around the neutron star. Therefore, we searched for a correlation of the intensity variations of the lobes versus the core using the following model: (1) A core flare responds in an unspecified manner to an event near the binary system; (2) This event is also associated with an energy surge which propagates down the twin-beam with an average velocity of ; (3) Each lobe flares when this increased energy flux reaches them. With this model the expected delay, as seen by an observer, between a core flare and its manifestation in the NE and SW lobes can be determined since the lobe space velocity, and , are accurately known. The expected delays, , are:
| (3) |
| (4) |
where is the time of ejection of the lobes from the core, and is the time of a core flare. The factor is related to the time for the flare ‘information’ to travel in the beam from the core to the lobes.
Figure 4 shows the flux density variations of the three components, after removal of the delay associated with the NE and SW lobes for and near the flare peaks for . The temporal correlations for the flares C3-N3 (h), C4-N4 (h) and C3-S3 (h) with are excellent, and the sensitivity of these correlations to are illustrated from those points plotted for . A fit of the correlation of the three observed flare-pairs as a function of the jet speed gives a formal solution, (Paper II). Even with these limited statistics and an over-simplified model, these observations suggest that the speed of energy flow in the beam is c. This result is the first direct measurement of energy flow velocity in an astrophysical beam. The velocity close to the speed of light suggests that the energy flux is probably carried by leptons with , rather than with protons or heavier particles moving at velocities considerably less than c Blandford & Rees (1974).
For flare 3, the Doppler-corrected flux densities, the general shapes, and spectral properties of the NE and SW lobes are similar. This suggests that the energy flow in the twin-beam is symmetric, and that the production of radio energy in each lobe depends mainly on the beam energy flow, rather than on interaction details at the working surfaces in the lobes. For flare 4 the flux density of the core is about ten greater than that for the NE lobe. (This flare in the SW lobe did not occur until thirty hours after the termination of the experiment.) Possible explanations on the relative weakness of the NE lobe for this flare are discussed in Paper II.
The similar properties of the two core flares with the lobe flares are surprising since the processes producing the radio emission in the lobes and in the core are thought to be different. Since these core flares are clearly associated with the energy flow in the beam, we suggest that the core component is located near the base of the beam rather than within the binary system. A symmetric ‘core’ component at the base of the beam to the south-west of the binary should also be present, but would be strongly Doppler-attenuated. Further discussion of the relationship between the radio core and the binary system are given elsewhere (Geldzahler et al., 2002), and includes a discussion of flare 2 which is associated with the formation of a new pair of lobes, and flare 1 which is anti-correlated with NE lobe in the sense that the NE lobe vanishes when the core reached a maximum.
6 Conclusions
The relatively simple and recurrent nature of the radio properties of Sco X-1 permit the determination of its kinetics. The compact lobes move directly away from the core with an average velocity of at an angle to the line of sight, with a range for four different lobe-pairs between 0.32c to 0.57c. The lobe advance remains constant for many hours despite significant flux density variations. The excellent correlations among some of the core and lobe flares suggest that energy flux within the twin-beam flows at a speed c, that the energy flow is symmetric in the twin-beams, that the radio luminosity of the lobes and core depends strongly on the energy flux in the beam but weakly on other environmental parameters, and that the location of the radio core is more likely to be at the base of the beam rather than near the binary system or accretion disk.
References
- Blandford & Königl (1979) Blandford, R. D. & Königl, A. 1979, ApJ, 232, 34
- Blandford et al. (1977) Blandford, R. D. , McKee, C. F. & Rees, M. J. 1977, Nature, 267, 211
- Blandford & Rees (1974) Blandford, R. D. & Rees, M. J. 1974, MNRAS, 169, 395
- Bradshaw et al. (1999) Bradshaw, C. F., Fomalont, E. B. & Geldzahler, B. J. 1999, ApJ, 512, L121
- Bradshaw et al. (2002) Bradshaw, C. F., Geldzahler, B. J & Fomalont, E. B. 2002, in preparation
- Cawthorne (1991) Cawthorne, T. V. 1991, in Beams and Jets in Astrophysics, ed. P. A. Hughes(Cambridge:Cambridge Univ. Press), 187
- Cowley & Crampton (1975) Cowley, A. P. & Crampton, D. 1975, ApJ, 201, L65
- Fomalont & Geldzahler (1991) Fomalont. E. B. & Geldzahler, B. J. 1991, ApJ, 383, 289
- Fomalont et al. (2001) Fomalont, E. B., Geldzahler, B. J. & Bradshaw, C. J. 2001, ApJ, submitted [Paper II]
- Geldzahler et al. (2002) Geldzahler, B. J., Fomalont, E. B. & Bradshaw C. J. 2002, in preparation
- Gottlieb et al. (1975) Gottlieb, E. W., Wright, E. L. & Liller, W. 1975, ApJ, 195, L33
- Hasinger & van der Klis (1989) Hasinger, G. & van der Klis, M. 1989, A&A, 225, 79
- Mirabel & Rodriguez (1999) Mirabel, I. F. & Rodriguez, L. F. 1999, A&A Rev., 37, 409
- Titarchuk et al. (2001) Titarchuk, L. G., Bradshaw, C. F., Geldzahler, B. J. & Fomalont, E. B. 2001, in preparation.
- van der Klis et al. (1996) van der Klis, M., Swank, J. H., Zhang, W., Jahoda, K., Morgan, E. H., Lewin, W. H. G., Vaughan, B. & van Paradijs, J. 1996, ApJ, 469. L1