The Obscuring Starburst of NGC 6221 and Implications for the Hard X-ray Background
Abstract
We present NGC 6221 as a case study of “X-ray loud composite galaxies,” which appear similar to starbursts at optical wavelengths and resemble traditional active galactic nuclei in X-rays. The net optical spectrum of NGC 6221 is properly characterized as a starburst galaxy, but in X-rays, NGC 6221 is similar to Seyfert 1 galaxies, exhibiting a power-law continuum spectrum, a broad Fe K line, and continuum variability on timescales of days and years. High-resolution images reveal that the detected active nucleus is relatively weak, not only at optical, but also at near-infrared wavelengths. An obscuring starburst, in which the interstellar gas and dust associated with the starburst conceal the active nucleus, accounts for these peculiar features. We demonstrate quantitatively that obscuration by column density combined with relatively weak intrinsic nuclear activity can produce an optical spectrum characteristic of the surrounding starburst alone. While optical surveys would not identify the active nuclei that make these galaxies significant X-ray sources, such galaxies may in fact be important contributors to the X-ray background.
1 Introduction
Since the discovery of the cosmic X-ray background (XRB) (Giacconi et al., 1962), great progress has been made in understanding its origin. Surveys with ROSAT successfully resolved 70–80% of the soft X-ray background at energies 0.5 to 2 keV into discrete sources (Hasinger et al., 1998; Schmidt et al., 1998). Current work with the Chandra X-ray Observatory demonstrates that discrete sources account for similar fractions of the harder X-ray background, at energies up to 10 keV (Giacconi et al., 2001). The problem is not completely solved, however. Although much of the XRB is made up of what we might classify as the nuclei of otherwise normal bright galaxies or typical active galactic nuclei (AGNs), a significant fraction of the discrete sources are not easily identified. If they are AGN, they appear to have unusual properties. Mushotzky et al. (2000) find a population of optically faint sources, which could either be the active nuclei of dust-enshrouded galaxies or the first quasars at very high redshifts. The obscuration of some AGNs is so strong that they are not detected in X-rays at all. If the SCUBA submillimeter sources, for example, are not driven entirely by star formation, they may contain AGNs with Compton-thick tori and little circumnuclear X-ray scattering (Hornschemeier et al., 2000).
Among nearby X-ray emitters are galaxies that have X-ray characteristics of AGN, but whose optical spectra are typical of H ii regions or starbursts. These objects may comprise some of the “unusual” discrete sources of the XRB, seeming innocuous in larger optical surveys, but generating significant hard X-ray emission. Moran, Halpern, & Helfand (1996) dub them “composite galaxies” because they share some characteristics of both starbursts and AGNs, albeit at different energies. We prefer “X-ray loud composite galaxies,” however, to distinguish these objects from the larger class of AGN/starburst composite galaxies that exhibit their dual nature consistently at all wavelengths (e.g., Levenson, Weaver, & Heckman, 2001a; Cid Fernandes et al., 2001). While physically, members of both classes contain AGN and starburst components, their observational characteristics are distinct.
The X-ray loud composite galaxies comprise a small fraction of soft X-ray selected sources. Moran et al. (1996) examined optical spectra of the Boller et al. (1992) catalog of IRAS sources detected in the ROSAT All-Sky Survey and found 7 of this type among the 210 galaxies they classified, and they suggest that obscuration, including of the narrow-line region, may play a role in accounting for their unusual properties. The optical spectra have the characteristics of starburst and H ii region systems, rather than AGNs, based on diagnostic diagrams of their emission line ratios (e.g., Veilleux & Osterbrock, 1987). Only on closer examination do the optical spectra hint at additional activity, such as broadened [O iii] lines or a weak broad component underneath the Balmer lines. At X-ray energies, however, the X-ray loud composites appear to be typical AGNs, sharing characteristics of luminosity and variability.
Here we present NGC 6221 as a case study of the X-ray loud composite galaxies. Advantageously, this galaxy has been observed over a wide energy range, and we utilize ground-based optical spectroscopy, high-resolution optical and near-infrared images from the Hubble Space Telescope (HST), and X-ray imaging and spectroscopy from ASCA and ROSAT to physically account for the emission sources. We adopt a distance of 19.8 Mpc to NGC 6221, with for recession velocity , so pc. Although NGC 6221 has been classified as a Seyfert 2, its optical spectrum is more characteristic of a starburst galaxy. The X-ray emission of NGC 6221 certainly qualifies it as an active galaxy, and, as we argue below, it is more like a type 1, in fact. We propose the “obscuring starburst” model to account for these properties and demonstrate in general that a starburst can easily hide an AGN. While previous studies of the starburst-AGN connection have faced the initial task of finding starbursts in active galaxies (e.g., Heckman et al. 1997; González Delgado et al. 1998; González Delgado, Heckman, & Leitherer 2001), the X-ray loud composite galaxies represent the other extreme composition, in which the dominant starburst conceals the weaker AGN at optical wavelengths.
2 Optical Spectroscopy
2.1 Observations
A long-slit optical spectrum of NGC 6221 was obtained on the night of 1997 September 24 with the CTIO 4-m telescope using the Cassegrain Spectrograph and Loral 3K CCD. The - (144 pc-) wide slit was oriented along the paralactic angle at position angle . The spectral range covered was 3650–7300Å, at a resolution of approximately 4Å. The seeing was . After the long-slit spectrum was reduced and flux-calibrated, one-dimensional spectra were extracted. We binned together 3 pixels along the slit, which corresponds to or 144 pc, except the outermost spectra, centered from the nucleus, in which 6-pixel ( pc) regions were combined.
2.2 The AGN Narrow-Line Region
The net optical spectrum of NGC 6221 is typical of a reddened starburst (Phillips, 1979; Morris & Ward, 1988; Storchi-Bergmann, Kinney, & Challis, 1995). The only sign of non-stellar activity at these wavelengths is an [O III]5007 component broader than and blue-shifted with respect to H. This feature, as well as the early detection of NGC 6221 as an X-ray source (Marshall et al., 1979), motivated Véron, Véron, & Zuiderwijk (1981) to propose a composite Seyfert 2/starburst scenario, in which a faint AGN narrow-line region (NLR) is superposed on a dominant H II region powered by massive stars. Our spectra confirm the presence of the NLR-like [O III] component, as illustrated in Figure 2.2, where we show the [O III] and H profiles for the nucleus and six off-nuclear positions along the slit. In the nuclear () spectrum, the broad and blue component dominates the [O III] profile, extending to more than 1000 , while in H, the narrow component dominates.
The flux ratio, , increases from 0.3–0.5 (typical of starburst nuclei) within 100 of the H peak to (typical of Seyferts) for toward the blue, in agreement with the results of Véron et al. (1981) and Pence & Blackman (1984). We agree with previous studies that the broadened feature likely originates in an AGN NLR. The observed high in the blue wing of the lines can in principle be achieved in metal poor starbursts, but this would be inconsistent with the approximately solar metallicity inferred for NGC 6221 (Storchi-Bergmann, Calzetti, & Kinney 1994; see also Durret & Bergeron 1988). The width of this high excitation component as well as its flux ratio is more typical of AGNs than of starburst galaxies.
![[Uncaptioned image]](/html/astro-ph/0104316/assets/x1.png)
H (solid line) and [O III] (dotted line) line profiles across the slit. The five central extractions are wide, while each of the extreme extractions averages the emission from to from the nucleus. Profiles are normalized from 0 to 1 and offset by constant values for ease of comparison. The actual [O III]/H integrated flux ratio ranges from 0.5 to 0.9. The angular scale for NGC 6221 is , so the profiles shown here correspond to distances up to 500 pc from the nucleus.
We quantify the characteristics of the two components, modelling the line profiles with two Gaussians. We performed a global fit of the H and H + [N II] profiles using common kinematic parameters (centroid and FWHM) for all lines. The [S II] lines were not used in this fit to determine the kinematic parameters but were later deblended with the two resulting Gaussians. In all extractions, these combined fits yield a broad component of FWHM 500–600 (after correcting for instrumental broadening) blue-shifted by 150–250 with respect to a narrower unresolved component (whose intrinsic FWHM ; Véron et al. 1981). The [O III] line was modelled separately, with one component fixed to have the same centroid and FWHM of the narrow Gaussian identified in the H + H + [N II] fits and the other component unconstrained. This yields a more satisfactory fit to the [O III] profile because, even though all lines have the same general structure, the broad component is much stronger in [O III]. Fitting the [O III] yields a broad component with FWHM shifted by approximately with respect to the narrow unresolved component, which better represents the kinematic properties of the NLR.
With this evidence of line width and flux ratios, we refer to the broad component as the NLR or AGN component and the narrow one as the starburst or H II component, corresponding to gas photoionized by the AGN and massive stars, respectively. Table 1 lists the fluxes of the main emission lines for five positions along the slit. The percentage of the flux contained in the NLR component is listed in parentheses except in the case of [O I], to which we have not applied the profile decomposition.
![[Uncaptioned image]](/html/astro-ph/0104316/assets/x2.png)
All the total nuclear emission line ratios are consistent with a starburst classification on conventional diagnostic diagrams: [O III]/H; [N II]/H; [O I]/H; and [S II]/H. We note, however, that [N II]/H lies at the boundary between AGN and H II-region-like objects when plotted against [O III]/H (Veilleux & Osterbrock, 1987). While the [O III]/H ratio for the broad and narrow components yields NLR and H II-region-like ratios (2.1 and 0.2 respectively), the [N II]/H and [S II]/H ratios are only slightly larger for the broad component than for the narrow one. Because [O III] is the brightest line in NLRs, it is not surprising that our simple profile decomposition does not disentangle NLR and H II-like line ratios for [N II] and [S II] as effectively as for [O III]. Our modelling of the starburst and NLR components in §5 uses only the results for the H and [O III] lines, so we have not attempted a more detailed profile decomposition. Table 1 also lists the electron density inferred from the total [S II] line emission, calculated using the IRAF111IRAF is distributed by the National Optical Astronomy Observatories, operated by the Association of Universities for Research in Astronomy, Inc., under cooperative agreement with the National Science Foundation. task temden. The density decreases outwards, from cm-3 in the nucleus to 100–300 cm-3 at about 500 pc, in common with other starburst systems (Lehnert & Heckman, 1996).
Besides revealing the NLR component of the AGN, Figure 2.2 shows that the region producing this component is spatially resolved. The [O III] asymmetry is easily detected in the extractions centered (corresponding to 290 pc) away from the nucleus, and we marginally detect it in the outer (and noisier) spectra. This projected size of 300–500 pc is typical of observed NLR sizes in Seyferts (e.g., Schmitt & Kinney, 1996). While the blue [O III] wing gradually fades farther from the nucleus, its profile increasingly resembles that of H, and the NLR share of the total line flux decreases (Table 1).
The fact that the NLR feature is seen on both sides of the nucleus gives an indirect clue of the geometry of the AGN-photoionized gas in NGC 6221. This symmetry implies that the NLR is not projected as a one-sided cone. More importantly, the broad [O III] component is also extended along several other position angles (H. A. Fraquelli & T. Storchi-Bergmann, in preparation), so the NLR is approximately symmetric in NGC 6221. If the intrinsic shape of the NLR is roughly conical, then these results indicate that we see it from within the opening angle of the cone. Projected onto the plane of the sky, the NLR thus appears nearly circular. This geometry implies that if we could turn off the starburst, NGC 6221 would be classified as a Seyfert 1.
2.3 No Sign of a Broad-Line Region
There is no indication at all of broad (FWHM ) permitted emission lines in NGC 6221, characteristic of Seyfert 1s, even at longer wavelengths (Moorwood & Oliva, 1988). (We stress that the “broad” component we refer to above is not associated with an AGN Broad-Line Region (BLR), since (1) it is present in [O III], and (2) it is too narrow for BLR standards.) Given that the only measurable optical signature of an AGN in NGC 6221 is the relatively subtle broadened [O III] feature, we determine the upper limit on BLR characteristics in the optical spectrum. By adding a BLR-like (FWHM between 2500 and 7000 ) component to the observed H profile, we estimate that any such BLR component has a maximum equivalent width EW of 10 Å; in comparison, the measured equivalent width of H is 21.5 Å. In terms of flux, this limit corresponds to , which, correcting for mag (see below), translates into an upper limit on the corresponding intrinsic luminosity.
A Seyfert galaxy without detectable broad optical emission lines would be classified as a type 2, as Véron et al. (1981) originally proposed for NGC 6221, but several pieces of evidence indicate that its orientation is characteristic of Seyfert 1s. First, the extended NLR emission noted above suggests that we view the nuclear region face-on. Second, all the X-ray properties, including luminosity, variability, and emission line attributes, are typical of Seyfert 1s. We return to this issue in §5, developing a physical model of the geometry of NGC 6221 that explains the absence of broad optical lines despite the orientation.
![[Uncaptioned image]](/html/astro-ph/0104316/assets/x3.png)
2.4 Extinction
A distinctive feature of NGC 6221 is its large extinction. The values of listed in Table 1 were computed from the measured H/H ratio using the extinction law of Cardelli, Clayton & Mathis (1989, with ) and assuming a case B intrinsic ratio of 2.86 (Osterbrock, 1989) appropriate to starburst nebulae. In the nuclear extraction, we measure mag, compatible with the estimate of Storchi-Bergmann et al. (1994), and we agree with their conclusion that the correction for underlying absorption in the Balmer lines has a negligible effect on the estimated extinction, so we have not considered it in our analysis. The H/H ratio for the NLR component is 7.9, somewhat larger than the 7.2 obtained for the starburst component. This suggests that that the NLR suffers an additional 0.3 mag extinction with respect to the starburst lines. Since this is a small difference, we adopt a common visual extinction of 3 mag for the entire emission line region in NGC 6221. Dust within the Milky Way accounts for mag (Schlegel, Finkbeiner, & Davis, 1998), so the intrinsic extinction in NGC 6221 . We summarize the observed fluxes, de-reddened fluxes, and luminosities of the NLR and starburst components of several important lines in Table 2 for both the nuclear extraction and the total spectrum integrated from to along the slit.
2.5 Properties of the Starburst in NGC 6221
We characterize the starburst in NGC 6221 using the Starburst 99 models of Leitherer et al. (1999). For a constant star formation rate model with solar metallicity and Salpeter IMF between 1 and 100 M⊙, the star formation rate is related to the H luminosity as SFR . Applying this relation to the starburst component in the nuclear spectrum (Table 2) gives SFR or . Having such a high central SFR, NGC 6221 certainly qualifies as a true starburst, rather than a normal galaxy, compared with the samples of Kennicutt (1998a), for example. The strongest star formation is concentrated within the central region, extending to a radius of approximately 400–500 pc, and it is not confused with ongoing star formation in the galaxy’s disk.
Within the limited circumnuclear region of NGC 6221, however, the star formation is widespread, as the spectral extractions and HST images (§3) demonstrate. This can also be seen in Figure 43 of Cid Fernandes, Storchi-Bergmann, & Schmitt (1998), where the equivalent widths of absorption lines and continuum colors are plotted as a function of distance from the nucleus. The bluer colors and highly diluted absorption lines in the extended central region are typical of other starburst and Seyfert 2/starburst composite galaxies observed by those authors and others (González Delgado et al., 2001). The widespread star formation is further confirmed by Storchi-Bergmann et al. (1995), who measure the H flux in a aperture to be 5.4 times larger than the H flux we measure in our nuclear window.
The far-infrared (FIR) luminosity of NGC 6221 . Using the bolometric correction of Meurer, Heckman, & Calzetti (1999), this translates into . A constant SFR model predicts per of star formation, so the implied total SFR M⊙yr-1, 20 times larger than the rate inferred for the nuclear () region alone.
3 High-Resolution HST Images
HST acquired optical and near-infrared (NIR) images of NGC 6221, which we obtained from the HST archive at the Space Telescope Science Institute. The Wide-Field Planetary Camera 2 observation provides spatial resolution of about pc) in the pixels of the Planetary Camera (PC), which covered the nuclear region. The F606W filter was in place, for broad coverage at optical wavelengths; the total system throughput is centered at wavelength Å, with width Å. We use the standard pipeline processing of this single 500 s exposure from 1995 April. The Near Infrared Camera and Multi Object Spectrometer (NICMOS) camera 2 observed NGC 6221 for 320 s in 1998 May with the F160W filter (). The camera’s plate scale is , for resolution.
We aligned the two images in order to identify the galaxy nucleus and other sources common to both, although subsequent photometry was performed on the original calibrated data. First we used the nominal astrometry to perform a two-dimensional polynomial transformation of the NICMOS image to the PC orientation and scale. Second, we measured the centroids of five point sources common to both frames and located outside the nuclear region. We then linearly shifted the transformed NICMOS frame along the rows and columns by the average measured offsets.
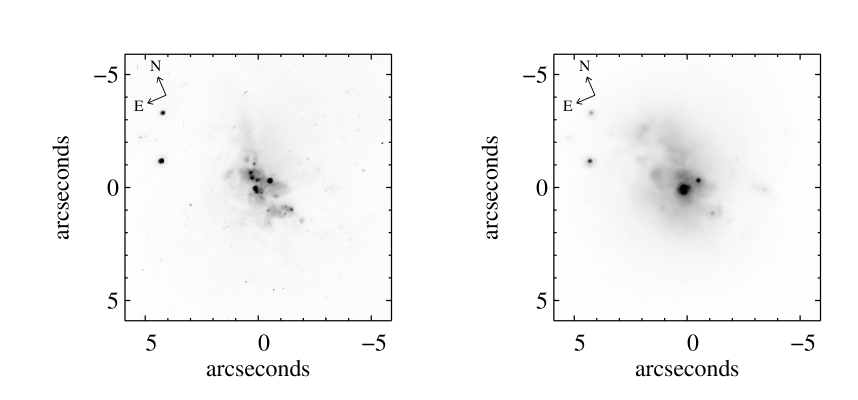
We display the results in Figure 1. We identify the brightest central NIR source as the AGN, with colors and luminosity similar to other active galaxies, as we discuss below. The source is evident in the optical image, but it is not the brightest one. In the optical band, the nucleus is relatively weak compared with the diffuse emission and the other bright sources, which we identify as stellar clusters.
We measure the brightness of the nuclear source alone using point spread function (PSF) subtraction. Because the PSF varies significantly across the field of the PC, we obtained a calibration observation of an unsaturated point source located at a similar position in the PC. We scaled this empirical PSF to match the flux of the AGN within the central pixel background-subtracted region, computing the total flux from the integration of the entire scaled PSF. In the F606W filter, which is comparable to a filter, the net result is mag on the Vega scale, or flux density mJy. Because the NICMOS PSF does not vary significantly across the field, we use a point source within the field of view to define the PSF. The PSF fitting yields mag on the Vega scale in the F160W filter, which is comparable to the standard band, or mJy. At 1.6µm, the PSF subtraction reveals an incomplete ring of diffuse emission whose radius is approximately and hints at a source about away from the nucleus, which is clearly resolved in the optical image.
The central point source is very red compared with quasars, and therefore must suffer substantial extinction if it is the active nucleus. Specifically, we compare with the colors of quasars that Elvis et al. (1994) observed. Although this sample includes radio-loud as well as radio-quiet objects, it is appropriate for comparison because the relative contribution of the host galaxies is small, so it yields reasonable measurements of the colors of the nuclei alone. The nucleus of NGC 6221 equals the median mag of the sample, assuming standard interstellar extinction (; Cardelli et al., 1989) for , the same value deduced from the steep Balmer decrement measured in the optical spectrum (§2.4).
The high-resolution images clearly reveal that the nucleus of NGC 6221 is weak with respect to the surrounding starburst, especially at optical wavelengths. Through the F606W filter, the nucleus provides only 6% of the observed flux within the aperture of the central region in which the central optical spectrum was extracted (§2), as Figure 3 graphically illustrates. Even at 1.6µm, where the AGN is relatively bright, it accounts for only 32% of the flux within a region.
![[Uncaptioned image]](/html/astro-ph/0104316/assets/x5.png)
Central region of NGC 6221 observed with the HST PC. A circle of radius, corresponding to the width of the point spread function, is drawn around the active nucleus. The overlaid square is on a side, which corresponds to the aperture of the central optical spectrum.
We calculate H flux of the AGN broad-line region from these measurements of the point source. For , the spectral slope between the and bands , so mJy. The equivalent width of H in active galaxies is approximately 100Å (e.g., Boroson & Green, 1992; Binette, Fosbury, & Parker, 1993), nearly all of which is due to the BLR in type 1 sources. Thus, we estimate the observed (and extincted) from the combined HST data. This value is at the detection limit of the optical spectrum and higher than the estimates of the intrinsic AGN strength based on X-ray luminosity we compute below (§5). Note that although the extinction in the lines and continuum may be somewhat different (e.g., Witt, Thronson, & Capuano 1992), in this rough calculation, we have reasonably assumed that they are equal.
While the evidence for identifying this red central source as the AGN is indirect, it offers the most plausible account of all the data. First, the observed color of this source is typical of active nuclei, given the reddening we measure in the spectrum. Second, the , , and X-ray luminosities simultaneously match the spectral energy distribution of a typical quasar (§5). Third, the expected line emission of the point source is consistent with the upper limit on detection of the BLR. Finally, none of the other detected sources share these characteristics, so they are unlikely to be the active nucleus. We could fail to detect the AGN entirely, even at 1.6µm. Within the bright central region of NGC 6221, we would not detect a source fainter than on the Vega scale. In this case, the intrinsic AGN would be extremely weak. While a faint, buried AGN is certainly possible, it would leave the problem of explaining the nature of the central source, with its exceptionally red color compared with the surrounding stellar clusters and diffuse emission. Near-infrared spectroscopy of the red central knot would clearly test its identification as the AGN. High spatial resolution is feasible, and the contrast between this source and its surroundings is greater at NIR than optical wavelengths. The NIR characteristics of AGN, including high-ionization lines and the BLR component of hydrogen recombination lines, could be observed.
4 X-ray Imaging, Spectroscopy, and Variability
4.1 Data Reduction
NGC 6221 was observed with the ROSAT HRI for 12 ks in 1995 September and with ASCA in 1997 September, resulting in exposure times of 35 ks and 37 ks in the SIS and GIS detectors, respectively. The ASCA data were processed to exclude times of high background rates and to be appropriate for the SIS 1-CCD observation mode. The accepted data were selected to be outside of and greater than 16 s after passages through the South Atlantic Anomaly, at elevations above the Earth’s limb greater than , at times greater than 16 s after a satellite day/night transition, and with geomagnetic cutoff rigidity greater than . We grouped the spectra into bins having a minimum of 30 counts, so statistics are applicable.
4.2 NGC 6221
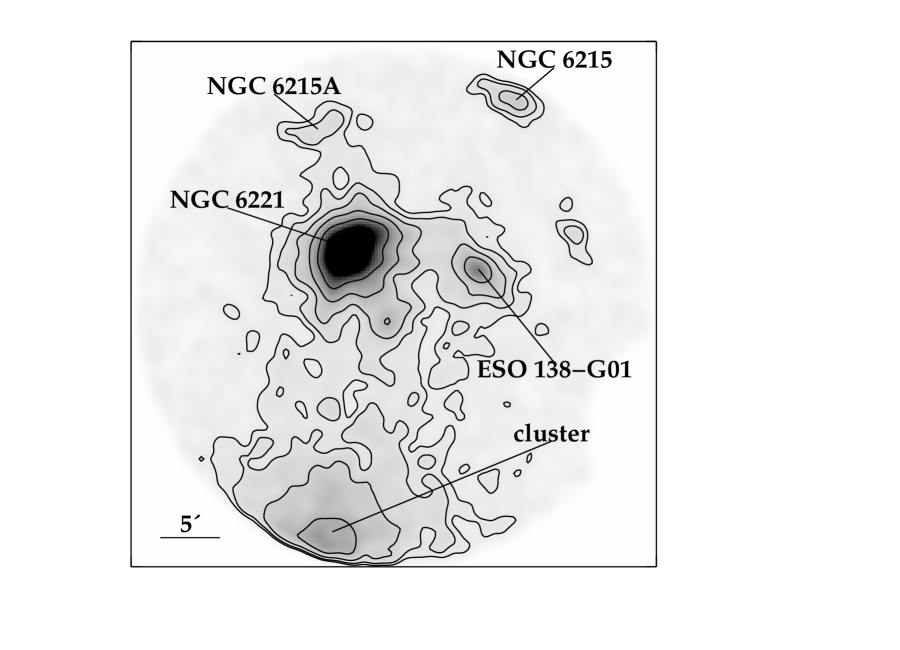
The X-ray data are described in detail in Levenson, Weaver, & Heckman (2001b), and we summarize these results below. The ASCA image of NGC 6221 obtained with the GIS2 detector (Figure 2) illustrates the X-ray-emitting environment of this galaxy. NGC 6221 is in a group. Extended diffuse emission around NGC 6221 and ESO 138-G01 implies that these galaxies are dynamically related, and NGC 6215A may also be included in this group. Observations at 21-cm and a similar recession velocity indicate that NGC 6215 may be interacting with NGC 6221 (Pence & Blackman, 1984), possibly accounting for its peculiar morphology, although the X-ray emission from NGC 6215 is separated from the group’s emission. The ASCA field of view also includes part of the nearby cluster 1RXSJ165259.4-594302, identified in the ROSAT All-Sky Survey (Voges et al., 1999).
NGC 6221 is significantly extended in ROSAT HRI observations, on a physical scale of at least 5 kpc. The resolved component accounts for more than half the soft X-ray emission in this observation from 1995 September. By analogy with normal starburst galaxies lacking active nuclei, this extended component is likely due to heating of the interstellar medium by stellar winds and supernovae, possibly including a large-scale outflow where the starburst “superwind” has broken out of the galaxy’s disk (Chevalier & Clegg, 1985; Heckman, Lehnert, & Armus, 1993). The characteristic X-ray spectrum of this diffuse component observed in pure starburst galaxies and active galaxies that are known to contain starbursts is soft thermal emission, which is due to gas that has been heated to temperatures of 0.2 to 1.0 keV.
Spectrally, in the ASCA observations obtained two years later, NGC 6221’s AGN characteristics dominate, and the soft flux increased by a factor of 3. The total soft (0.5–2 keV) X-ray luminosity , and the hard (2–10 keV) X-ray luminosity , where both are corrected for Galactic absorption and measured in the SIS0 detector. Levenson et al. (2001b) model the 0.5–10 keV spectrum with four components: 1) the AGN as a power law with photon index , absorbed by ; 2) the scattered AGN spectrum, with 7% of the intensity of the intrinsic nucleus; 3) a broad ( keV) emission line centered on keV; and 4) thermal emission with keV. Because the X-ray absorption of the intrinsic AGN is small, even at softer energies (0.5–2 keV), 80% of the soft X-rays are due to the AGN viewed directly, and most of the remainder constitute the scattered component. Only 5% of the soft emission included in the spectral model is thermal.
The variation in X-ray intensity between the HRI and ASCA observations is due to changes in the AGN, a change of either its intrinsic luminosity or its obscuring column density. The measured flux difference requires either an increase by a factor of about 5 in the intrinsic AGN luminosity or a decrease in column density from at the time of the ROSAT observation to . While the relative fraction of spatially extended X-ray emission, which we associate with thermal emission (Levenson et al., 2001b, a), diminished from more than half to only 5% of the soft flux, its total flux likely remained constant.
![[Uncaptioned image]](/html/astro-ph/0104316/assets/x7.png)
![[Uncaptioned image]](/html/astro-ph/0104316/assets/x8.png)
Light curves of NGC 6221 in GIS3 (top) and SIS0 (bottom) detectors. The count rates, extracted in 400-s bins for clarity, have been background-subtracted. The best-fitting constant rate for each case is overlaid. In neither case does the constant model fit the data acceptably.
![[Uncaptioned image]](/html/astro-ph/0104316/assets/x9.png)
On shorter timescales, within the ASCA observation, we also measure significant variability. Background-subtracted lightcurves are shown in Figure 4.2 for the GIS3 and SIS0 detectors, where 400-s bins clearly illustrate the significant variablity. The best-fitting constant count rate is drawn, but this constant flux model fits the data unacceptably in both cases. We extracted spectra over limited time intervals to examine the (earlier) lower flux and (later) higher flux states separately. With the limited statistics of these shorter exposures, however, we could not identify significant spectral differences between the two states. The same physical model that fits the total spectrum are also appropriate for the time-constrained spectra, with measurable variation only in the intensity. Similarly, the hardness ratio, defined in terms of the hard and soft fluxes as , shows no trend with the variation of total intensity.
The X-ray flux varies by about 50% over a timescale of s. We quantify the variation in terms of the “excess variance,” , defined by Nandra et al. (1997a). Sampling in 256-s bins in order to compare with published results, we find for the GIS3 lightcurve of NGC 6221. Thus, NGC 6221 is similar to broad-lined Seyfert 1 galaxies in the trend of increasing with decreasing hard X-ray luminosity; e.g., Turner et al. (1999) measure at , rising to for .
In addition to the unusual variability, its Fe line emission makes NGC 6221 unlike most other Seyfert 2s. It contains a broad Fe K line centered at keV with EW eV and line width keV with 90% confidence. The Fe line properties of this galaxy are more characteristic of Seyfert 1s, where the reprocessing material is inferred to be close to the galaxy nucleus (Nandra et al., 1997b), as opposed to the narrow K lines at keV due to neutral Fe farther from the nucleus, which is typical of Seyfert 2s, including Seyfert 2/starburst composites (Levenson et al., 2001b).
4.3 Other Sources
The group members NGC 6215 and NGC 6215A are included in the larger field of view of the GIS detectors, and we analyze their X-ray spectra here. NGC 6215 lies near the extreme edge of the field of view, so we extracted the spectrum from an elliptical region having semimajor axes and to maximize the included emission. The spectrum of NGC 6215A was extracted from a circular region of radius . Source-free regions of each detector were used for the corresponding background measurements.
With the limited data, only simple models are appropriate. In both cases, we fit the data reasonably well with a single power law. The model parameters are listed in Table 3. NGC 6215 has been identified as a weak LINER (Durret & Bergeron, 1988). The relatively strong X-ray emission of NGC 6215A suggests that this galaxy also contains an active nucleus. In addition to NGC 6215 and NGC 6215A, we observe the Seyfert 2 ESO 138-G1 in the GIS fields. Collinger & Brandt (2000) discuss the spectrum of ESO 138-G1 and find that either a partial covering or Compton reflection model fits it well.
The GIS3 calibration source blocks the cluster 1RXSJ165259.4-594302, and we observe it in the GIS2 detector alone. The cluster is centered outside the GIS field, and we extract its spectrum from a circular region on the detector. We fit the spectrum with a thermal bremsstrahlung model having keV absorbed by fixed Galactic column density. The model parameters are listed in Table 3.
5 The Obscuring Starburst Model
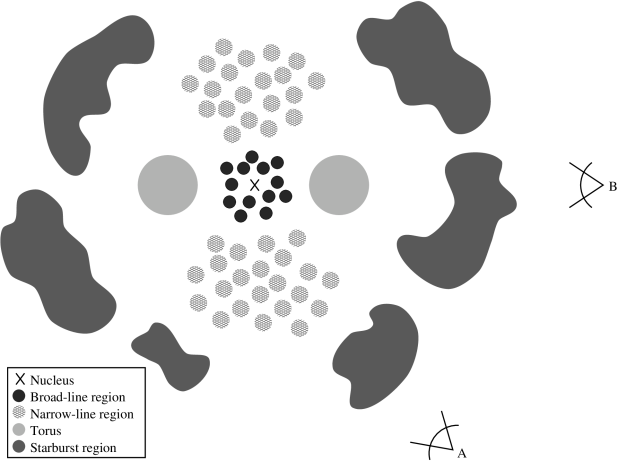
To account for the optical and X-ray observations of NGC 6221, we suggest a scenario in which the gas and dust associated with the starburst is the material that obscures the AGN. The extent of the starburst-like optical emission line ratios indicates that the physical scale of the starburst is a few hundred parsecs. This size is sufficient to block not only the broad-line region, but also the narrow-line region of the AGN. This is unlike the putative obscuring “torus” that distinguishes type 1 and type 2 Seyfert galaxies because the latter hides only the broad-line region (Figure 3). The total obscuring column density to the AGN measured at X-ray energies is only . The Seyfert 1-like characteristics of NGC 6221, such as variability and Fe K line properties, are therefore not surprising. Without the obscuring starburst, we would have a direct view of the AGN (Figure 3, viewpoint A). The column density to the nucleus of a true Seyfert 2 with an obscuring starburst is even greater (viewpoint B), as both the star-forming region and the material very close to the central engine (the “torus”) block the view (Levenson et al., 2001a).
The starburst itself is dusty, as the optical spectra demonstrate. The extinction mag (§2) is consistent with the model geometry, which places the starburst along the line of sight to the AGN. For (Gorenstein, 1975), we have . This measures the minimum obscuration due to the starburst, since most of the detected emission comes from its exterior regions that are not so extremely absorbed. Specifically, the direct conversion from to assumes that all the dust is located in a uniform foreground screen of material, separate from the emission sources. As more complex model calculations demonstrate, the effective extinction that we measure can severely underestimate the total dust and gas content of the starburst. In the starburst model of Witt et al. (1992), for example, in which the stars are more centrally concentrated than the embedding dust, the effective extinction is only even when the total extinction to the center of the galaxy reaches . Similarly, with a clumpy obscuring medium near the stars, Calzetti, Kinney, & Storchi-Bergmann (1994) find would be measured from the Balmer decrement when the total extinction along the line of sight , assuming a large number of individual clumps.
In addition to the distinct physical location of the X-ray and optical emission, a second uncertainty in comparing the X-ray and optical measurements arises because they are directly sensitive to different obscuring material. Photoelectric interaction with heavy elements is the immediate culprit at X-ray energies, and determining the hydrogen column density then is a function of abundance. Similarly, the optical extinction is due to dust, and the equivalent hydrogen column density depends on the gas-to-dust ratio. Nevertheless, the lower limit on column density of the starburst is at least comparable to that obscures the AGN as measured in X-rays, and more complex geometries of emission sources and dust within the starburst indicate that it is likely to be greater, which implies that the starburst intervening along the line of sight to the active nucleus of NGC 6221 is the primary source of obscuration. Note that because the extinction we measure is to the extended starburst region, we expect standard Galactic ratios to be appropriate, in contrast with some AGNs, in which extinction to the broad-line region is lower than expected for the absorbing column density measured in X-rays and may be due to fundamentally different distributions of grain size or dust composition close to the central engine (e.g., Maiolino et al., 2001).
The presence of both a starburst and an AGN in this geometry naturally results in observed [O III] lines that are broader than other lines if the two components are not resolved. The detectable AGN contribution to Balmer lines and other features that are characteristically strong in starbursts is relatively small. The starburst is relatively weaker in [O III], however, so the fraction of observed luminosity in this line that is due to the AGN is greater. The AGN line broadening then weights the total measured line width more heavily. Broadened [O III] lines in fact indicate the presence of AGNs in substantial fractions of galaxies with starburst and H II-region-like nuclei (Kennicutt, Keel, & Blaha, 1989), in addition to NGC 6221 and the other X-ray loud composites.
High spatial resolution observations of starburst galaxies demonstrate that the starbursts are inhomogenous (e.g., Calzetti et al., 1997), so in this case, we do not expect the AGN to be covered uniformly. While the physical scale of individual clumps may be as small as distinct star-forming clouds, however, the net obscuration to the center of NGC 6221 is large. Similar to other starburst galaxies, in which total nuclear column densities of to are typical (e.g., Dahlem, Weaver, & Heckman 1998; Kennicutt 1998b), the line of sight intersects many dusty regions, so the AGN is never directly exposed. If changes in the intrinsic AGN and its obscuring medium can be distinguished, X-ray variability measurements may best constrain the physical scale of the obscuring clouds.
![[Uncaptioned image]](/html/astro-ph/0104316/assets/x11.png)
Net observed ratio, , of [O III]/H intensity vs. AGN fraction of total intrinsic H flux, calculated for , , 2, 4, and 6 (increasing from upper left to lower right), and and 1.0. With some obscuration, even a strong AGN may not be detected in the observed line ratios. The AGN fraction of observed H flux is marked with ticks corresponding to 0.1, 0.2, 0.3, 0.4, and 0.5 along the curves. The relationship between the observed and intrinsic H fractions depends only on , not or . For example, with , the observed H fraction equals 0.1 when the intrinsic H fraction is 0.4.
The HST images demonstrate that the observed optical flux due to the AGN is small compared with the surrounding starburst. Both sources are strongly extincted, and the AGN is also intrinsically weak with respect to the starburst at optical wavelengths. We roughly estimate the AGN properties from the X-ray luminosity. First we estimate the broad H line luminosity from the hard X-ray luminosity, . Xu, Livio, & Baum (1999) compile the X-ray measurements, and we find the corresponding H values of the Seyfert 1s in Whittle (1992) and Dahari & de Robertis (1988). The median ratio of these is . In the high-flux state of NGC 6221, as observed with ASCA, , so we predict , or flux from the intrinsic AGN. Expecting to the broad-line region based on the X-ray column density, the resulting expected detectable flux , which is well below the upper limit on detection of the BLR estimated from the optical spectrum. Even adopting the minimum to the AGN based on the optical data, the expected measured flux , at the detection limit in the optical spectrum and less than the total observed in the nuclear region. Using the X-ray–Balmer line luminosity correlation of Ho et al. (2001) for broad-line galaxies produces similar results, with the weak BLR undectable in our optical spectrum.
![[Uncaptioned image]](/html/astro-ph/0104316/assets/x12.png)
Net observed ratio, , of [O III]/H intensity vs. AGN fraction of total intrinsic H flux, calculated for , , 2, 4, and 6 (increasing from upper left to lower right), and and 10. The AGN fraction of observed H flux is marked with ticks corresponding to 0.1, 0.2, 0.3, 0.4, and 0.5 along the curves. The combination of obscuration and relatively low AGN power can produce line ratios typical of pure starbursts.
Second, we crudely estimate the intrinsic AGN [O III] luminosity, which is produced in the NLR, from . The median ratio of these two quantities for the Seyfert 1s of the Xu et al. (1999) compilation. For the observed , , or intrinsic flux . The advantage of calibrating this relationship with only the Seyfert 1s is that the ratio is sensitive to intervening column density, although fitting all radio quiet galaxies in the data set produces similar results. From the AGN component observed at optical wavelengths, we expect the reddening-corrected in the central aperture, or , integrated over the whole slit. Two uncertainties relevant to both of these X-ray estimates are that the data set of X-ray and optical fluxes is not uniform and the optical fluxes of this sample have not been corrected for reddening. The scatter in the data is large, which may therefore account for our underprediction of the observed [O III] luminosity. Although the flux measured in the optical spectrum is approximately four times greater than the intrinsic [O III] flux we predict based on the hard X-ray flux, our main point is to demonstrate that the X-ray and optical data all provide a generally consistent description of the starburst and AGN in NGC 6221.
![[Uncaptioned image]](/html/astro-ph/0104316/assets/x13.png)
Spectral energy distributions of unobscured sources illustrate the X-ray prominence of AGNs. The average intrinsic starburst (solid line; Schmitt et al. 1997) and radio-quiet quasar (dotted line; Elvis et al. 1994), are each normalized at 5000Å. We model the X-ray spectrum of the starburst as thermal emission due to gas at keV, and the dashed line covers the UV region where there intrinsic spectrum is unknown. When the optical fluxes are equal, the AGN is two orders of magnitude brighter than the starburst in X-rays, although the bolometric luminosities of the different emission sources are comparable.
Mixing starburst and AGN components can produce an ambiguous optical spectrum, as Hill et al. (2001) and Nelson & Whittle (2001) demonstrate for several diagnostic line ratios. Additional obscuration of the AGN can completely hide this component to produce an optical spectrum that mimics a pure starburst. We compute some simple models to illustrate the detected changes in the important flux ratio in general circumstances. In the first example (Figure 5), we adopt a typical AGN ratio and optical extinction to the starburst , and we consider the effects of additional extinction to the AGN (, 2, 4, and 6) and different starburst line ratios (, and 1.0). Even when the intrinsic AGN is strong, providing up to 50% of the completely unobscured narrow H luminosity, the net observed can be indistinguishable from a pure starburst. Similarly, we consider and 10 and show that for the typical , some combination of obscuration and relative AGN luminosity can hide the AGN in the observed line ratio (Figure 5). In all cases, only the additional obscuration of the AGN, , is relevant, and the plots are identical for and , 5, 7, and 9, which encompasses the likely parameters in the case of NGC 6221. We also note the observed fraction of H flux due to the AGN with ticks corresonding to observed fractions 0.1, 0.2, 0.3, 0.4, and 0.5. For example, with , 10% of the detected H emission is due to the AGN when its intrinsic fraction is 0.4, while for , 10% of the detected H emission is due to the AGN only when the an intrinsic AGN fraction reaches 0.8. The relationship between the intrinsic and observed H fractions depends only on , not or .
The effect of obscuration on typical spectral energy distributions also illustrates that an AGN can be hidden at optical wavelengths while remaining the dominant X-ray source in composite galaxies. We compare the average unobscured starburst galaxy (Schmitt et al., 1997) with the median radio-quiet QSO (Elvis et al., 1994), normalized at 5000Å (Figure 5). The bolometric luminosities of the two sources are comparable, with the starburst much stronger in the FIR and the AGN dominating in X-rays.
![[Uncaptioned image]](/html/astro-ph/0104316/assets/x14.png)
Observed spectral energy distribution of NGC 6221, modelled with typical AGN and starburst contributions. The AGN component is measured in X-rays and as the point source alone in HST images (filled symbols). Imaging and spectroscopy of NGC 6221 that encompass larger scales are predominantly sensitive to the starburst (open symbols). The average AGN (dotted line) is extincted by , as we measure in the X-ray spectrum of NGC 6221, while the average starburst (solid line) is extincted by , as we measure optically. In NGC 6221, the AGN is intrinsically weak compared with the starburst, as well as heavily absorbed. While the starburst accounts for nearly all the bolometric luminosity of NGC 6221, the AGN still produces its X-ray emission. Additional data in the FIR, optical–NIR, and UV bands are from Sanders et al. (1995), McAlary et al. (1983), and Kinney et al. (1993), respectively.
We model NGC 6221 with these two components, scaling the empirical spectral energy distributions to the data values and applying the measured extinctions (Figure 5). The X-ray and HST measurements of the point source indicate the contribution of the AGN, and we use the X-ray determination of its extinction. Lower-resolution imaging and large-aperture spectroscopy measure the starburst component, and the Balmer decrement indicates its exctinction. In this calculation, we adopt the extinction laws of Cardelli et al. (1989) at long wavelengths, that of Calzetti et al. (2000) in the NIR-to-UV bandpass, and that of Morrison & McCammon (1983) at higher energies. While the empirical Calzetti et al. (2000) law is based on observations of starburst galaxies, it is also reasonably applied to the AGN component. Specifically, it is relatively grey and lacks the strong Galactic feature at 2175Å, which is not detected in distant quasars (Pitman, Clayton, & Gordon, 2000, and references therein). The AGN is much weaker than the starburst at all wavelengths except X-rays. The AGN accounts for only about 1% of the galaxy’s bolometric luminosity, while providing nearly all the observed X-rays. In NGC 6221 and other X-ray loud composites, the dusty starburst is both the obscuring medium and the origin of the detectable optical and infrared spectrum.
The population of starburst-obscured AGNs helps to solve the problem of the spectrum of the XRB. The observed XRB spectrum is much flatter than the spectra of unobscured AGNs or any other extragalactic populations that likely comprise the background. A combination of absorption and redshift of AGNs can produce the observed XRB, however (Setti & Woltjer, 1989; Madau, Ghisellini, & Fabian, 1994; Comastri et al., 1995). As Fabian et al. (1998) have proposed, starburst-obscured AGNs specifically may contribute significantly to the XRB, naturally providing the required large optical depths and high covering fractions of their central engines.
The starburst and AGN phenomena may be related in an evolutionary sequence, with galactic interactions triggering the starbursts and providing a central reservoir of material for accretion in the active nucleus (Cid Fernandes et al., 2001; Storchi-Bergmann et al., 2001). The limited lifetime of the starburst then constrains the timescale of the strongly obscured AGN phase. Typical starbursts persist only over timescales up to several hundred Myr. As a result of the starburst, material is blown out of the galaxy by the superwind or converted into dense stellar remnants, and no longer blocks the active nucleus. Thus, as Heckman et al. (1989) describe, only in a later phase of evolution are direct views of the central engine possible, with characteristic optical spectra that include broad emission lines.
6 Summary and Significance
We have presented NGC 6221 as a case study of an X-ray loud composite galaxy. While the optical spectrum of the nuclear region is typical of a starburst galaxy, its buried AGN is clearly revealed in X-rays. The Balmer decrement indicates that the starburst itself is strongly reddened, and the column density to the AGN measured in X-rays is even greater. We suggest that the very red point source distinguished in HST images is the nucleus, and we crudely derive intrinsic optical properties of the AGN from the X-ray luminosity. We demonstrate generally that the combination of obscuration and contrast in viewing an intrinsically weak AGN against a bright starburst can produce the net optical spectrum of the surrounding starburst, while the active nucleus remains the dominant X-ray source.
Without the obscuring starburst, NGC 6221 would be classified as a Seyfert 1, with the central engine and broad-line region viewed directly. In the simple physical model, the starburst need not completely block the AGN from all lines of sight, but its covering fraction may be larger than that of the dense material very close to the nucleus—the “torus”—that accounts for some of the observed distinctions between Seyfert 1s and 2s. In some cases, the starburst may block only the broad emission lines, not the narrow ones. Consequently, if such obscuring starbursts are common, the observed ratios of Seyfert 1s and 2s do not directly constrain the “torus” characteristics such as covering fraction.
NGC 6221 is not unique, and such objects probably occur more frequently than their small fraction (7/210) in the joint ROSAT-IRAS sample (Boller et al., 1992; Moran et al., 1996) would suggest. Because the ROSAT survey is sensitive only to soft (0.2–2 keV) X-rays, it misses the more heavily obscured members of this class. A column density of reduces the flux in the ROSAT bandpass by a factor of 10, and reduces the flux by more than three orders of magnitude. These column densities are not extreme compared with the observed nuclear column densities of molecular gas in ordinary starburst galaxies. While optical spectroscopy is the primary method of identifying the sources detected through efforts to resolve the X-ray background, it does not always reveal the complex nature of these galaxies. Inverting the problem—considering the X-ray emission of known optically-identified populations—also overlooks the contribution of the X-ray loud composite AGNs. Hard X-ray surveys are the best method to detect this class of galaxies, and they require careful spectroscopy at lower energies to correctly identify their intrinsic emission sources. Future missions with greater sensitivity to harder X-rays will prove most effective at finding X-ray loud AGNs. Constellation-X, for example, is expected to have an effective area of about 5000 cm2 at 10 keV and 1500 cm2 at 40 keV, and will therefore sensitively detect obscured AGNs of all kinds.
References
- Binette, Fosbury, & Parker (1993) Binette, L., Fosbury, R. A., & Parker, D. 1993, PASP, 105, 1150
- Boller et al. (1992) Boller, T., Meurs, E. J. A., Brinkmann, W., Fink, H., Zimmermann, U., & Adorf, H.-M. 1992, A&A, 261, 57
- Boroson & Green (1992) Boroson, T. A., & Green, R. F. 1992, ApJS, 80, 109
- Calzetti et al. (2000) Calzetti, D., Armus, L., Bohlin, R. C., Kinney, A. L., Koornneef, J., & Storchi-Bergmann, T. 2000, ApJ, 533, 682
- Calzetti, Kinney, & Storchi-Bergmann (1994) Calzetti, D., Kinney, A. L., & Storchi-Bergmann, T. 1994, ApJ, 429, 582
- Calzetti et al. (1997) Calzetti, D., Meurer, G. R., Bohlin, R. C., Garnett, D. R., Kinney, A. L., Leitherer, C., & Storchi-Bergmann, T. 1997, AJ, 114, 1834
- Cardelli et al. (1989) Cardelli, J. A., Clayton, G. C., & Mathis, J. S. 1989, ApJ, 345, 245
- Chevalier & Clegg (1985) Chevalier, R. A., & Clegg, A. W. 1985, Nature, 317, 44
- Cid Fernandes et al. (2001) Cid Fernandes, R., Jr., Heckman, T. M., Schmitt, H., González Delgado, R. M., & Storchi Bergmann, T. 2001, submitted to ApJ
- Cid Fernandes et al. (1998) Cid Fernandes, R., Jr., Storchi-Bergmann, T., & Schmitt, H. R. 1998, MNRAS, 297, 579
- Collinger & Brandt (2000) Collinger, M. J., & Brandt, W. N. 2000, MNRAS, 317, L35
- Comastri et al. (1995) Comastri, A., Setti, G., Zamorani, G., & Hasinger, G. 1995, A&A, 296, 1
- Dahari & de Robertis (1988) Dahari, O., & de Robertis, M. M. 1988, ApJS, 67, 249
- Dahlem et al. (1998) Dahlem, M., Weaver, K. A., & Heckman, T. M. 1998, ApJS, 118, 401
- Durret & Bergeron (1988) Durret, F., & Bergeron, J. 1988, A&AS, 75, 273
- Elvis et al. (1994) Elvis, M., et al. 1994, ApJS, 95, 1
- Fabian et al. (1998) Fabian, A. C., Barcons, X., Almaini, O., & Iwasawa, K. 1998, MNRAS, 297, L11
- Giacconi et al. (1962) Giacconi, R., Gursky, H., Paolini, F. R., & Rossi, B. B. 1962, Phys. Rev. Letters 9, 439
- Giacconi et al. (2001) Giacconi, R., et al. 2001, ApJ, in press (astro-ph/0007240)
- González Delgado et al. (2001) González Delgado, R. M., Heckman, T. M., & Leitherer, C. 2001, ApJ, 546, 845
- González Delgado et al. (1998) González Delgado, R. M., Heckman, T., Leitherer, C., Meurer, G., Krolik, J., Wilson, A. S., Kinney, A., & Koratkar, A. 1998, ApJ, 505, 174
- Gorenstein (1975) Gorenstein, P. 1975, ApJ, 198, 95
- Hasinger et al. (1998) Hasinger, G., Burg, R., Giacconi, R., Schmidt, M., Trumper, J., & Zamorani, G. 1998, A&A, 329, 482
- Heckman et al. (1997) Heckman, T. M., et al. 1997, ApJ, 482, 114
- Heckman et al. (1989) Heckman, T. M., Blitz, L., Wilson, A. S., Armus, L., & Miley, G. K. 1989, ApJ, 342, 735
- Heckman, Lehnert, & Armus (1993) Heckman, T., Lehnert, M., & Armus, L. 1993, in “The Environment and Evolution of Galaxies,” ed. Shull & Thronson (Kluwer: Dordrecht), 455
- Hill et al. (2001) Hill, T. L., Heisler, C. A., Norris, R. P., Reynolds, J. E., & Hunstead, R. W. 2001, AJ, 212, 128
- Ho et al. (2001) Ho, L. C., et al. 2001, ApJ, 549, L51
- Hornschemeier et al. (2000) Hornschemeier, A. E., et al. 2000, ApJ, 541, 49
- Kennicutt (1998a) Kennicutt, R. C., Jr. 1998a, ApJ, 541, 552
- Kennicutt (1998b) Kennicutt, R. C., Jr. 1998b, ARA&A, 36, 189
- Kennicutt, Keel, & Blaha (1989) Kennicutt, R. C., Keel, W. C., & Blaha, C. A. 1989, AJ, 97, 1022
- Kinney et al. (1993) Kinney, A. L., Bohlin, R. C., Calzetti, D., Panagia, N., & Wyse, R. F. G. 1993, ApJS, 86, 5
- Lehnert & Heckman (1996) Lehnert, M. D., & Heckman, T. M. 1996, ApJ, 462, 651
- Leitherer et al. (1999) Leitherer, C., et al. 1999, ApJS, 123, 3
- Levenson et al. (2001a) Levenson, N. A., Weaver, K. A., & Heckman, T. M. 2001a, ApJ, 549, in press
- Levenson et al. (2001b) Levenson, N. A., Weaver, K. A., & Heckman, T. M. 2001b, ApJS, 133, in press
- Madau, Ghisellini, & Fabian (1994) Madau, P., Ghisellini, G., & Fabian, A. C. 1994, MNRAS, 270, L17
- Maiolino et al. (2001) Maiolino, R., Marconi, A., Salvati, M., Risaliti, G., Severgnini, P., Oliva, E., La Franca, F., & Vanzi, L. 2001, A&A, 365, 28
- Marshall et al. (1979) Marshall, F. E., Boldt, E. A., Holt, S. S., Mushotzky, R. F., Rothschild, R. E., Serlemitsos, P. J., & Pravdo, S. H. 1979, ApJS, 40, 657
- McAlary et al. (1983) McAlary, C. W., McLaren, R. A., McGonegal, R. J., & Maza, J. 1983, ApJS, 52, 341
- Meurer, Heckman, & Calzetti (1999) Meurer, G. R., Heckman, T. M., & Calzetti, D. 1999, ApJ, 521, 64
- Moorwood & Oliva (1988) Moorwood, A. F. M., & Oliva, E. 1988, A&A, 203, 278
- Moran et al. (1996) Moran, E. C., Halpern, J. P., & Helfand, D. J. 1996, ApJS, 106, 341
- Morris & Ward (1988) Morris, S. L., & Ward, M. J. 1988, MNRAS, 230, 639
- Morrison & McCammon (1983) Morrison, R., & McCammon, D. 1983, ApJ, 270, 119
- Mushotzky et al. (2000) Mushotzky, R. F., Cowie, L. L., Barger, A. J., & Arnaud, K. A. 2000, Nature, 404, 459
- Nandra et al. (1997a) Nandra, K., George, I. M., Mushotzky, R. F., Turner, T. J., & Yaqoob, T. 1997a, ApJ, 476, 70
- Nandra et al. (1997b) Nandra, K., George, I. M., Mushotzky, R. F., Turner, T. J., & Yaqoob, T. 1997b, ApJ, 477, 602
- Nelson & Whittle (2001) Nelson, C., & Whittle, M. 2001, submitted to ApJ
- Osterbrock (1989) Osterbrock, D. E. 1989, Astrophysics of Gaseous Nebulae and Active Galactic Nuclei (Mill Valley, CA: University Science Books)
- Pence & Blackman (1984) Pence, W. D., & Blackman, C. P. 1984, MNRAS, 207, 9
- Phillips (1979) Phillips, M. M. 1979, ApJ, 227, L121
- Pitman, Clayton, & Gordon (2000) Pitman, K. M., Clayton, G. C., & Gordon, K. D. 2000, PASP, 112, 537
- Sanders et al. (1995) Sanders, D. B., Egami, E., Lipari, S., Mirabel, I. F., & Soifer, B. T. 1995, AJ, 110, 1993
- Schlegel, Finkbeiner, & Davis (1998) Schlegel, D. J., Finkbeiner, D. P., & Davis, M. 1998, ApJ, 500, 525
- Schmidt et al. (1998) Schmidt, M., et al. 1998, A&A, 329, 495
- Schmitt & Kinney (1996) Schmitt, H. R., & Kinney, A. L. 1996, ApJ, 463, 498
- Schmitt et al. (1997) Schmitt, H. R., Kinney, A. L., Calzetti, D., & Storchi Bergmann, T. 1997, AJ, 114, 592
- Setti & Woltjer (1989) Setti, G., & Woltjer, L. 1989, A&A, 224, L21
- Storchi-Bergmann et al. (1994) Storchi-Bergmann, T., Calzetti, D., & Kinney, A. L. 1994, ApJ, 429, 572
- Storchi-Bergmann et al. (2001) Storchi-Bergmann, T., González Delgado, R. M., Schmitt, H., Cid Fernandes, R., & Heckman, T. 2001, submitted to ApJ
- Storchi-Bergmann et al. (1995) Storchi-Bergmann, T., Kinney, A. L., & Challis, P. 1995, ApJS, 98, 103
- Turner et al. (1999) Turner, T. J., George, I. M., Nandra, K., & Turcan, D. 1999, ApJ, 524, 667
- Veilleux & Osterbrock (1987) Veilleux, S., & Osterbrock, D. E. 1987, ApJS, 63, 295
- Véron et al. (1981) Véron, M. P., Véron, P., & Zuiderwijk, E. J. 1981, A&A, 98, 34
- Voges et al. (1999) Voges, W., et al. 1999, A&A, 349, 389
- Whittle (1992) Whittle, M. 1992, ApJS, 79, 49
- Witt et al. (1992) Witt, A. N., Thronson, H. A., & Capuano, J. M. 1992, ApJ, 393, 611
- Xu et al. (1999) Xu, C., Livio, M., & Baum, S. 1999, AJ, 118, 1169