Abstract
We have obtained multi-colour imaging of a representative, statistically complete sample of low-frequency selected (Jy) radio loud quasars at intermediate () redshifts. These sources are found in a variety of environments, from the field through to rich clusters. We show that statistical measures of environmental richness, based upon single-band observations are inadequate at these redshifts for a variety of reasons. Environmental richness seems correlated with the size and morphology of the radio source, as expected if the energy density in the radio lobes is approximately the equipartition value and the lobes are in pressure equilbrium with a surrounding intragroup/cluster medium. Selecting on radio size therefore efficiently selects dense galactic sytems at these redshifts.
The environments of radio-loud quasars
1 Introduction
Our sample of quasars were a subset of the statistically complete Molonglo Quasar Sample (MQS) (Kapahi et al., 1998)[], with redshifts 0.65z1.10. and with . Several sources were randomly excluded due to observing-time limitations. Radio luminosities of the sources ranged between , a factor 5 lower than the most luminous (3CR) sources at comparable redshifts.
Most fields were imaged in the optical using either EFOSC or EFOSC2 on the ESO 3.6m telescope with a field of view of 5’x 5’, with some observed with the CTIO and AAT 4m telescopes. Filter bands were chosen to straddle the 4000Å break giving the greatest contrast for early type galaxies at the appropriate redshift (typical images being complete to ). A subset of these fields were imaged in and using IRAC2 on the ESO/MPI 2.2m. with a smaller (2’x 2’) field-of-view (typically complete to ).
2 Single filter clustering statistics

We analysed clustering of faint galaxies around the quasars in two ways. Firstly, we carried out “traditional” statistical tests of clustering on single-band data (or at least not colour-selecting the galaxies), as practiced by others (e.g. see Wold et al., these proceedings). The spatial cross-correlation amplitude Bgq and the magnitude-limited overdensity within 0.5 Mpc, N0.5 (Hill & Lilly, 1991) [] were computed for our fields in either the or band. The results for Bgq are shown in Fig. 1. They show broad agreement with those of Wold et al. (2000) [] and McClure & Dunlop, (2000) [] to a redshift of 0.9. Above this, our data are not deep enough to detect a significant portion of cluster galaxies. Normalising to the expected cluster luminosity function then causes spurious results with large errors. Our observations support the notion that RLQs inhabit a wide variety of environments as found in other studies (e.g. Yee & Green, 1987) [].
Additionally we find several cases where Bgq is misleading. This may be for several reasons. Firstly, interpretation of the the statistical tests in terms of environmental richness assumes that the quasar is at the centre of any (roughly circular) overdensity. At high redshift, clusters are generally not relaxed spheroidal systems, and may have several bright ellipticals within them, rather than one central dominant galaxy. We find that our quasars are not always at the centres of overdensities, and in some cases there are other galaxies that have colours and magnitudes of first-ranked cluster ellipticals within the overdensity.
Secondly, at the magnitude levels of interest, the number density of background objects, and the significant variation in that quantity on the scale-lengths of distant clusters make it very difficult to determine the background in one band to subtract from any overdensity. Thirdly, even when an obvious overdensity is detected, it can sometimes be made up of galaxies with the wrong optical-IR colours to be at the redshift of the quasar. In at least two cases we find a overdensity which gives a large value of Bgq but is a foreground agglomeration, found to be so by reference to optical and infrared colours. Detections such as these can lead to the misidentification of clusters and an increase in the average value of the cross-correlation amplitude.
3 Multicolour analysis
Because of the problems with single-band statistical measures of clustering, we used the colours of galaxies in the quasar fields to estimate clustering. Specifically, we determine the colours expected for passively evolving ellipticals at the centres of clusters at the redshift of each quasar and compare these to the colours of the observed galaxies.
Optical colours can be used to isolate the 4000Å break for ellipticals at . Near-infrared and filters are also useful for identifying galaxies above a redshift of 0.5. Specifically, objects with a colour of 1.7 and above are galaxies at redshift 0.5 and higher (Pozzetti & Manucci, 2000). [] Spirals at these redshifts can also be isolated due to their red (due to dust reddening), but relatively blue optical colours. The colour sets unresolved high redshift galaxies completely apart from stars and brown dwarfs which have .
For each object we determine the distribution of a magnitude limited sample of objects in the field as a function of their colour. Figure 2 shows an example of this. Each greyscale square is the smoothed surface density of objects with with colours ranging between in bins of 0.5 mag in colour in the 5’x 5’ field of a quasar. The grey levels are normalised to give the same object density for the same grey level in each colour bin. Most objects are bluer than . An overdensity of red objects close to the quasar can be seen in the bin, the colour expected for ellipticals at . and imaging of the central region confirm that these red objects have and colours of ellipticals at z=0.9. Narrow band imaging in redshifted [OII] and follow-up spectroscopy confirm faint star forming galaxies in the field at the quasar’s redshift, but not in the region of the red overdensity. This is a clear case of a cluster around a z=0.9 quasar and is discussed in detail in Baker et al. (2001) [].
In contrast Figure 3 shows the distribution of faint objects around a quasar. The R-band image clearly shows a strong overdensity of close to the quasar, leading to a strong N0.5 signal, indicating at first sight that the quasar inhabits a rich cluster . However, the colour distribution peaks at , far too blue for ellipticals at . Similarly the colours of these objects are also too blue to be ellipticals at the quasars redshift. Thus we have a case where the colour information rules out this overdensity being a cluster at the quasar redshift (unless the morphological mix is extremely unusual).
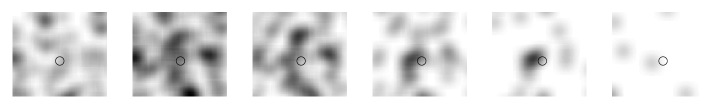
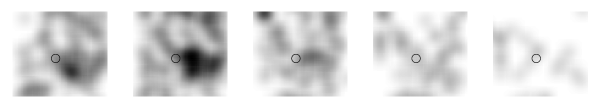
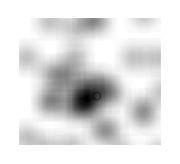
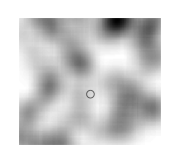
Figure 4 compares the spatial distribution of objects with and in the fields of two quasars with almost identical redshifts (). The first cluster shows a clear overdensity of objects with this colour, consistent with the colour ellipticals at , the second does not (and shows no obvious clustering of objects of any other colour). The colours of the objects around the first quasar are again consistent with being in a cluster associated with the quasar.
Similar analysis of other objects in the sample lead to detections of several other systems of galaxies, from compact groups to clusters along with other systems that at first sight appear to be groups or clusters at the quasar redshift, but have colours consistent with lower (or different) redshift objects.
4 A possible correlation with radio size
The range of radio luminosities for our sample covers less than an order of magnitude, and the lookback time difference between the lowest and highest redshift members is less than 2Gyr, so we cannot probe if these quantities correlate with environmental richness. However, we may expect a correlation with the extent of the radio lobes in low-frequency selected radio sources. If the radio lobes are in pressure equilibrium with a surrounding medium, then if their internal energy densities/pressures are close to (or scale roughly as) the equipartition value, there should be relationship between true (unprojected) angular size and the pressure of the external medium (e.g. see Miley 1980 [], Bremer et al., 1992) []. For sources that evolve self similarly, where is the flux of the source (essentially constant in a flux-limited sample) and is the angular size of the source. The smaller the source, the higher the equipartition pressure, and therefore the higher the external pressure (assuming source pressures scale with the equipartition value, at least statistically). Sources surrounded by a dense ICM should therefore be smaller than those in the field, or lower mass groups.
Excluding flat spectrum point sources, there are seven sources which have a radio extent of less than 20”. We find four obvious clusters, of which three are confirmed by IR data. The fourth has an obvious overdensity with the correct optical colours, but requires IR data to confirm the nature of the constituent galaxies.
5 Summary
Powerful low-frequency selected radio-loud quasars at redshifts exist in a wide variety of environments, from the field through compact groups to rich clusters.
The quasar is not always directly centred on any overdensity we find, nor is any overdensity confined to within 0.5 Mpc of the active galaxy. This has the effect of making clustering statistics like Bgq and N0.5 rather blunt tools for analysing individual clusters. We find that colours must be used when trying to distinguish clusters from their backgrounds. In particular near infrared colours can be used to accurately extract the high redshift galaxy population.
The smallest extended sources are more likely to be classified as being in clustered environments (though not necessarily in clusters). This is to be expected from equipartition arguments. Factoring in an estimate of true source size and excluding core-dominated sources results in an extremely efficient way of selecting fields containing high redshift groups and clusters. The richness of these systems vary from field to field, but (given the results of Martin Hardcastle in these proceedings) we could expect comparable richnesses to many X-ray selected clusters at similar redshifts. Blind, wide-field optical searches for clusters find systems of comparable richness (but with far lower efficiency). Despite the obvious effectiveness of colour selection in detecting these systems, follow-up 8m imaging and spectroscopy is still required to determine the parameters of the systems.
1
References
- [] Baker J.C., Hunstead R.W., Brinkmann W., 1995, MNRAS, 277, 553
- [] Baker J.C., Hunstead R.W., Bremer M.N., Bland-Hawthorn J., Athreya R. M. Barr J.M., 2001, AJ, 121, 1821.
- [] Bremer M.N., Crawford C.S., Fabian A.C., Johnstone R.M., 1992, MNRAS, 254, 614
- [] Bremer, M.N., Baker, J.C., Lehnert, M., 2001, MNRAS submitted.
- [] Ellingson E., Yee H.K.C., Green R.F., 1991, ApJ, 371, 49
- [] Hill G.J., Lilly S.J., 1991, ApJ, 367, 1
- [] Kapahi V.K., Athreya R.M., Subrahmanya C.R., Baker J.C., Hunstead R.W., McCarthy P.J., van Breugel W., 1998, ApJS, 118, 327
- [] McClure R.J., Dunlop J.S., 2000, MNRAS, submitted (astro-ph/0007219)
- [] Miley G., 1980, ARAA, 18, 165
- [] Pozzetti L., Mannucci F., 2000, MNRAS, 317, L17
- [] Wold M., Lacy M., Lilje P.B., Serjeant S., 2000, MNRAS 316, 267
- [] Yee H.K.C., Green R.F., 1987, ApJ, 319, 28
- [] Yee H.K.C., Ellingson E., 1993, ApJ, 411, 43