IONIZATION PROPERTIES AND ELEMENTAL ABUNDANCES IN DAMPED Ly SYSTEMS
Abstract
We analyze extant data of Al2+, Al+ and other low ions with the aim of studying the ionization properties of Damped Ly systems (DLAs) from the analysis of the ratio (Al2+/Al+) (Al2+)/(Al+). We find good correlations - and - that we use to indirectly estimate (Al+) from (Si+) and/or (Fe+) measurements. In this way we determine the ratio (Al2+/Al+) for a sample of 20 DLAs. Contrary to common belief, the ratio can attain relatively high values (up to 0.6), suggesting that gas of intermediate ionization state plays an important role in DLAs. On the other hand, the lack of any trend between abundance ratios, such as Si/H and Si/Fe, and (Al2+/Al+) indicates that abundances are not severely influenced by ionization effects. We find a (Al2+/Al+) - (H∘) anticorrelation that we use, in conjunction with idealized photoionization equilibrium calculations, to constrain the ionization properties and to predict ionization corrections in DLAs. We consider two possible origins for the species of low and intermediate ionization state: (1) neutral regions devoid of Al2+ and/or (2) partially ionized, Al2+-bearing regions. The (Al2+/Al+) - (H∘) anticorrelation can be naturally explained in terms of a two-region model with a soft, stellar-type ionizing radiation field. We present abundance ionization corrections for 14 elements of astrophysical interest derived with different types of ionizing spectra. For most of these elements the corrections are generally below measurements errors, contrary to the predictions of recent models presented in the literature. We briefly discuss the potential effects of inaccuracies of the Al recombination rates used in the photoionization calculations.
1 Introduction
The QSO absorption systems with hydrogen column densities (H∘) cm-2 — called damped Ly systems (DLAs) — are believed to originate in intervening galaxies or protogalaxies located at cosmological distances (Wolfe et al. 1995). High resolution spectroscopy of DLAs is a fundamental tool for probing the chemical and physical properties of the associated high- galaxies and, more generally, of the high-redshift universe. In particular, abundance studies have been performed in order to probe the nature of DLA galaxies and to cast light on the early stages of galactic evolution (Lu et al. 1996, Pettini et al. 1997, Prochaska & Wolfe 1999, Molaro et al. 2000). In abundance studies it is important to take into account both dust depletion and ionization effects before deriving conclusions on the nucleosynthetic processes at work in DLA galaxies. The effects of dust depletion have been investigated by several research groups (Lauroesch et al. 1996; Kulkarni, Fall & Truran 1997; Vladilo 1998, hereafter Paper I; Savaglio, Panagia & Stiavelli 2000). All these studies indicate that dust corrections can have a significant impact on our understanding of the chemical history of DLAs. In order to cast light on the intrinsic abundance trends some authors have analyzed DLAs with modest or negligible dust content (Pettini et al. 2000, Molaro et al. 2000) or elements which are essentially unaffected by dust depletions (Centurión et al. 1998).
In the present work we investigate the effects of ionization on the observed abundances. These effects are generally neglected because the abundances are derived from dominant ionization states of the elements of interest. It is well known from Galactic interstellar studies that the dominant ionization state in H∘ regions is the neutral one for elements with first IP 13.6 eV (e.g. O∘, N∘) and the singly ionized one for elements with first IP 13.6 eV and second IP 13.6 eV (e.g. C+, Mg+, Al+, Si+, S+, Cr+, Mn+, Fe+, and Zn+). The reason for this is that the bulk of the H∘ gas is self-shielded from h 13.6 eV photons, but transparent to h 13.6 eV photons. The first studies of ionization balance in DLAs have indicated that ionization corrections are negligible for the low ions used in abundance determinations (Viegas 1995, Lu et al. 1995, Prochaska & Wolfe 1996). However, the presence of Al2+ in DLAs suggests that ionization corrections may be important. From the aluminium ionization potentials — IP(Al∘)=5.99 eV and IP(Al+)=18.83 eV — one expects Al+ to be dominant and Al2+ to be essentially absent in H∘ regions. The observations indicate that Al2+ is present in DLAs at the same radial velocity of low ions, but at different radial velocity of high ions such as C+3 and Si+3 (Lu et al. 1996, Prochaska & Wolfe 1999, Wolfe & Prochaska 2000). Clearly, Al2+ is a tracer of moderately ionized gas associated to the neutral phase and the study of the Al2+/Al+ ratio must bear important information on the effects of ionization on the derived abundances.
In a previous work we have performed detailed ionization calculations relevant to the ionized layer directly exposed to the ionizing radiation field (Howk & Sembach 1999; hereafter Paper II). In that work the photoionization calculations have been stopped at the point in which the local ionization fraction of neutral hydrogen climbs above 10%. In the present work we first study the Al2+/Al+ ratio from the observational point of view and we then perform photoionization calculations aimed at modeling this ratio. Rather than analyzing individual absorbers, we study the general behavior of the Al2+/Al+ ratio in a relatively large sample of DLAs. In our computations we consider the possibility that the line of sight can intersect both neutral gas and partially ionized gas. At variance with Paper II, we also perform photoionization calculations stopped at fixed (H∘) values.
2 Analysis of observational data.
In Table 1 we present a compilation of aluminium column densities in DLAs collected from the literature. References to the original works are reported in column 6. Only measurements performed on high resolution spectra obtained with 10-m class telescopes have been included in the list. Most of the data have been obtained with the Keck HIRES spectrograph and analyzed by only a few authors. The collected data set is therefore quite homogeneous from the observational point of view. Nevertheless, we paid special attention on the reliability of the published column densities. In particular, we revised the available data for rejecting cases suspected to be affected by saturation or by telluric contamination. In addition, we investigated the velocity distribution of the absorption profiles. In fact the comparison of the column densities of Al+, Al2+ and other low ions that we perform here makes sense only if these ions have similar velocity profiles, suggesting that they are physically related.
The Al+ column densities are derived from the transition at nm which is often saturated. In fact, only lower limits are reported in the literature for a large fraction of cases. We have, in addition, found three more cases of suspected saturation from a revision of the absorption profiles. We treat also these three cases as lower limits even if they are quoted as real measurements in the original works (see note in the table).
The Al2+ column densities are derived from the transitions at nm and nm which are not affected by saturation effects. Our re-analysis of the velocity profiles confirms that Al2+ has, in general, the same velocity distribution of the low ions (Wolfe & Prochaska 2000). However, we found some exceptions which are marked with the explanatory notes and in Table 1. Typically, we found evidence for an additional Al2+ absorption component displaced from the zero velocity component seen in Al+ and/or other low ions. In most of these cases the equivalent width of this extra absorption is negligible compared with the total Al2+ absorption. The bulk of Al2+ originates in the same velocity range as Al+ and the other low ions.
For the absorber at towards QSO 0000-263 we found evidence for telluric contamination of the Al2+ 185.4 nm profile from the analysis of a newly obtained spectrum of this target by means of UVES at VLT (Molaro et al. 2000). In table 1 we report the column density obtained from the analysis of the 186.2 nm line, which is unaffected by contamination. Careful inspection of the full set of profiles in the other DLAs of Table 1 does not reveal evidence for telluric contamination since the profiles of the two lines of the doublet are always similar when they are both available (almost in all cases).
2.1 Column-density correlation analysis
While Al+ and other singly ionized species with IP eV can be present in the inner parts of H∘ regions, the production of Al2+ requires photons with eV which cannot as easily penetrate large H∘ column densities. A careful analysis should therefore reveal a different behavior between Al2+ and singly ionized species. Since the radial velocity analysis does not show evidence for a distinct behavior, we investigated the column density behavior of such species. For two species that are present in roughly constant proportions in the same region we expect to find a linear correlation with slope of unity between their logarithmic column densities. The identification of such a correlation would support a common origin of the different species. The lack of such a correlation could be ascribed to differences in the abundance/depletions patterns or to differences in the ionization properties. By analyzing ions of the same elements, such as Al2+ and Al+, there can be no differences in the intrinsic abundances. Studying such ions, therefore, gives information on the ionization state of the gas, and a slope differing from unity would indicate that ionization properties do affect the observed column densities. Unfortunately, only a modest number of simultaneous determinations of Al+ and Al2+ in DLAs are currently known (Table 1). To by-pass this limitation we compared the column densities of both Al+ and Al2+ ions with those of Fe+ and Si+, for which a large number of measurements are instead available. In practice, we performed a linear regression analysis of the column densities of each possible combination of pairs of the species Al+, Al2+, Si+, and Fe+. The results are summarized in Table 2, where we give for each pair the number of data points available, , the correlation coefficient, , the slope, , and the intercept, , resulting from the linear regression. In Fig. 1 we show the results for Al+ and Si+.
One can see from Table 2 that singly ionized species, including Al+ are well correlated with each other and have slope of unity within the errors111 Chemical evolution and dust effects are hidden within the dispersion of the correlations. At first sight it is surprising that such effects do not introduce a large scatter. However it is possible to show that changes in metallicity level and dust content tend to compensate each other since relative abundances scale with the dust-to-metals ratio (Eq. 17 in Paper I) and at the same time metallicity and dust content are correlated in DLAs (Fig. 2 in Paper I). On the other hand, the intrinsic spread of relative abundances due to chemical evolution may be modest owing to relatively limited range of look-back time explored in DLAs (most absorbers are found at ). . This fact, together with the similarity of the velocity profiles, suggests that all these species originate in the same region. On the other hand, pairs of species including Al2+ show a modest correlation coefficient and a slope significantly lower than 1. In addition, such pairs have larger dispersions than the corresponding pairs with Al+. For instance (Al2+,Si+) 2 (Al+,Si+). This distinct behavior of Al2+ cannot be attributed to differences in the abundances or dust depletions properties of Al, Fe and Si. If such effects were important, they would also tend to cancel the correlations between Al+ and Fe+ and between Al+ and Si+, which are instead clearly detected. Since the distinct behavior of Al2+ is not due to intrinsic variations of the abundances/depletions, it must be due to the ionization properties of DLA clouds. This observational result can be interpreted in two ways:
-
1.
The Al2+ originates in the same H∘ region as the bulk of the low-ionization lines. The local value of the Al2+/Al+ ratio varies among DLA clouds.
-
2.
The Al2+ originates in a region distinct from, but physically related to, the H∘ region where the bulk of the singly-ionized species reside. The relative column density contribution from the two regions varies among DLA clouds.
Studies of the ionization properties of DLAs usually consider only the first of the two possibilities. Here we will also consider the second one. A separate Al2+ region may in fact exist if the photons with eV required for producing Al2+ are not available in the self-shielded parts of the H∘ region. Since the velocity structure of Al2+ and of low ions are generally similar, the Al2+ and H∘ regions must be physically connected. A cloud structure consisting of a partially ionized Al2+-bearing interface bordering a H∘ region opaque to eV photons satisfies the above requirements.
2.2 The Al2+/Al+ ratio in DLAs
The ratio Al2+/Al+ can be used to constrain the ionization conditions and/or ionization structure of DLAs. From the observational point of view we are able to measure the column density ratio (Al2+/Al+) (Al2+)/(Al+), which gives information integrated along the line of sight. Direct measurements of (Al2+/Al+) are currently possible only in a few cases, mainly because reliable Al+ measurements are quite rare (Table 1). For this reason we take advantage of the existence of the – and – correlations to indirectly estimate (Al+) from Fe+ and Si+ measurements. The indirect determinations based on Si+ measurements are displayed in Table 1, column 7. References to the original Si+ measurements are the same given in column 6. These indirect estimates of (Al+) yield results consistent with all the available Al+ data (i.e., 9 determinations and also 9 lower limits). Similar results are obtained when Fe+ is used to track Al+ (see more details in Section 2.4). Because the correlation with (Si+) has lower dispersion, lower slope error, and lower intercept error than the correlation with (Fe+) (Table 2) we use the Si+-based results given in Table 1 in the rest of the paper, unless otherwise specified.
In the last column of Table 1 we list the values of the aluminium ionization ratio in DLAs obtained by using indirect and, when possible, direct measurements of Al+. The ionization ratio shows a spread of more than one order of magnitude, with values ranging from (Al2+/Al+) 0.03 up to 0.6, and a median value 0.2. Values of (Al2+/Al+) as high as 0.6 are detected also in the sub-sample for which (Al+) is measured directly. The presence of high fractions of doubly ionized aluminium suggests that Al+ is not the only ionization state of aluminium present in significant amounts in DLAs. However, it is unsafe to use (Al2+/Al+), which is a quantity integrated along the line of sight, as an indicator of the local ionization ratio. In fact, singly and doubly ionized aluminium may arise in distinct regions, in which case (Al2+/Al+) would reflect the relative contribution of such regions to the column densities, rather than the local ionization ratio.
The (Al2+/Al+) ratio does not show any trend with absorber redshift. In the interval , where most of the measurements are concentrated, the ratio shows the full spread of a factor of 20. Since metagalactic effects are expected to have a smooth variation with redshift, the large spread in a relatively narrow redshift interval suggests that the ionization fraction is severely influenced by local effects. The metagalactic radiation field may play a role in determining the ionization balance, but must be modulated by some local effect. Such modulation may result from emission/absorption of radiation internal to the DLAs or from large changes in cloud density.
2.3 Abundances versus Al2+/Al+ ionization ratio
The presence of high fractions of Al2+ with same velocity distribution of low-ionization might question the reliability of abundance determinations in DLAs. If abundance measurements are strongly affected by ionization conditions, we would expect that they show some dependence on (Al2+/Al+). For instance, the models calculations performed in Paper II predict that [Zn/H] and [Si/H] measurements222 We adopt the usual convention [X/Y] . can be easily overestimated by one order of magnitude when (Al2+/Al+) 1/10 for the relatively low ionization parameters discussed in that work. The collection of (Al2+/Al+) values presented in Table 1 allows us to probe if such effects are indeed present, at least for elements commonly measured in DLAs. We performed a linear regression analysis of [Si/H] and [Si/Fe] against (Al2+/Al+). The [Si/H] analysis yields correlation coefficient , dispersion , and slope (18 data points). The predicted increase of [Si/H] at high (Al2+/Al+), if present, is not significant from the statistical point of view. Similar results are obtained from the study of [Si/Fe], a ratio which is expected to be moderately sensitive to ionization effects (Paper II). The [Si/Fe] analysis yields , , and (19 data points). In this case the null result is even more clear. The lower dispersion than in the case of the Si/H ratio is probably due to the fact that variations of the metallicity and of the dust-to-gas ratio tend to cancel when we consider a relative abundance such as Si/Fe. These results suggest that ionization corrections are not severe, or at least that they do not show a strong, obvious dependence on (Al2+/Al+).
2.4 Al2+/Al+ ratio versus H∘ column density
In Fig. 2 we plot (Al2+/Al+) versus the absorber H∘ column density. The data points show a general decrease of (Al2+/Al+) with increasing log (H∘). A linear regression analysis yields an anti-correlation with slope and intercept . Even if the correlation coefficient is not very high (Pearson’s ), the probability of the null hypothesis (of no correlation) is . The highest value of the ratio, (Al2+/Al+) , is found at (H∘) 1020.3 cm-2, while the lowest value, (Al2+/Al+) , is found at (H∘) 1021.4 cm-2.
The above result is based in large part on indirect Al+ determinations obtained from Si+ measurements. However, the (Al2+/Al+) – log (H∘) anti-correlation is confirmed when Fe+ is used to infer Al+ column densities. In fact, the slope and intercept derived in this case — and — are very similar to the above given values, and the probability of the null hypothesis equals .
The lack of DLAs at the bottom-left and top-right corners of Fig. 2 could be due, in principle, to the impossibility of detecting Al+ and/or Al2+ below their observational limits. However, we have verified that this is not the case. In fact, the strength of the Al+ 167.0 nm transition and of the numerous Si+ and Fe+ transitions used for the indirect Al+ determinations guarantee that Al+ would be easily detected down to much lower column densities than observed. In the case of Al2+, the detection limit with Keck+HIRES is cm-2. In the sample of Table 1, only one case out of 21 measurements has such a low value. Of the remaining (Al2+) data, 9 are 0.5 dex above the detection limit and 11 are 1 dex above the limit. We conclude that the anti-correlation is not an artifact induced by observational limitations.
In addition, we do not have reasons to believe that the observed trend results from a selection bias. The most common bias considered to affect the population of DLAs is dust obscuration of the background QSO (Pei et al. 1991). In fact, this effect may be responsible for the apparent anti-correlation between [Zn/H] and (H∘) found by Boissé et al. (1998), if lines of sight of high metallicity (dust content) and high column density indeed obscure the background QSO. However, the same effect should not be relevant for the anti-correlation reported here given the fact that the ratio (Al2+/Al+) is independent of metallicity.
The existence of an empirical anti-correlation (H∘) - (Al2+/Al+) implies that the neutral hydrogen column density can be used as an indirect estimator of the ionization state of the gas. In this way one can search for ionization effects in DLAs without available Al measurements. Given the importance of Zn in DLA studies we searched for a possible dependence of [Cr/Zn] and [Fe/Zn] on (H∘). A linear regression through the 26 [Cr/Zn] measurements available yields a slope and a correlation coefficient . Very similar results are obtained from the analysis of the 22 [Fe/Zn] available determinations: and . In addition, there is no trace of an increased dispersion at low (H∘) for any of the two ratios. These empirical results suggest that Zn ionization effects are probably negligible in DLAs.
If Al2+/Al+ is relatively constant throughout the cloud, the (Al2+/Al+) ratio should be approximately constant with (H∘). The decrease of (Al2+/Al+) with (H∘) can be interpreted in two ways, depending on which of the two possible origins of Al2+ mentioned at the end of Section 2.1 is more appropriate. (1) If Al2+ is co-spatial with the rest of low-ionization species, the anticorrelation is consistent with a reduction of the gas ionization level with increasing H∘ self-shielding. (2) If Al2+ originates in a partially ionized interface bordering a neutral region, then we expect the column density of the ionized interface and of the neutral region to be unrelated and therefore (Al2+) to be independent of (H∘). On the other hand, we expect Al+ and other species of low ionization to scale with H∘ owing to a common origin in the neutral region. The decrease of (Al2+/Al+) with (H∘) is naturally explained from the fact that (Al2+) does not scale with (H∘) while (Al+) does.
3 Model calculations
On the basis of the observational results discussed above, we consider two possible origins for species of low and intermediate ionization: (1) regions completely opaque to photons with eV and/or (2) regions partially transparent to ionizing photons. Neutral and singly ionized species can arise in both regions, but Al2+ can only be present in type-2 regions. The general idea is that type-2 regions are the photoionized envelopes of type-1 regions. The similarity of the velocity profiles of Al2+ and singly ionized species is naturally explained in this way. On the other hand, radial-velocity studies show a general misalignment of C+3 and Si+3 profiles relative to Al2+ profiles, suggesting that the bulk of high-ionization species originates elsewhere (Wolfe & Prochaska 2000). We expect therefore that type-2 regions are mildly ionized and have low Si+3/Si+ fraction.
In the Appendix we derive the expressions that allow us to compute ionization ratios and abundance ionization corrections in the framework of the two-region model. These expressions do not depend on the metallicity, provided type-1 and type-2 regions have equal metallicity in any given DLA system. The relative contribution of the two regions along the line of sight is specified by the parameter , which is the ratio of the total column densities in region 1 and 2, respectively. The possibility that Al2+ and the species of low ionization originate together in a single layer is included in our treatment as the special case . In fact, the single layer should be a partially ionized region of type 2 given the presence of significant fractions of Al2+.
In order to model the ionization properties of the gas we assume that the DLA regions under study are embedded in a ionizing radiation field of given spectrum and intensity. In type-1 regions we only consider the contribution of species which are dominant ionization states in HI regions. In type-2 regions we compute the ionization fractions by means of photoionization equilibrium calculations. For this purpose we used the CLOUDY code (v90.04; Ferland 1996, Ferland et al. 1998) assuming plane-parallel geometry with ionizing radiation incident on one side. We consider two possible types of radiation fields: a hard, QSO-dominated spectrum representative of the radiation field external to the DLAs at (Haardt & Madau 1996; Madau, Haardt & Rees 1999) and a soft, stellar-type spectrum (=33,000 K; Kurucz 1991) representative of the internal radiation field or of an external field dominated by starlight from galaxies (e.g. Steidel, Pettini & Adelberger 2000). In both cases the intensity of the field is specified by the ionization parameter , where (H) is the total surface flux of ionizing photons (cm-2 s-1) and the hydrogen particle density (cm-3). We refer to Paper II for more details on the model assumptions and on the adopted radiation fields. In the rest of this section we present model predictions of the ionization ratios (Al2+/Al+) and of the abundance ionization corrections.
3.1 Aluminium ionization ratio
3.1.1 Soft-continuum, two-regions model (S2 model)
The photoionization calculations indicate that with the soft, stellar-type spectrum the H∘ column density of the ionized layer, (H∘), cannot attain the high values typical of DLAs for a wide range of . In fact, we find (H∘) cm-2 for . Therefore, we assume that a neutral region of type 1 is present along the line of sight, in addition to the Al2+-bearing, type-2 region. We refer to this soft-continuum, two-regions model as S2.
Because the ionized region does not yield a significant contribution to the neutral hydrogen column density and because in the neutral region, we take (H) = = as the total column density of the type-1 region, where covers the interval cm-2 cm-2, representative of DLAs. For each given (H) we let the ionization parameter vary and we use CLOUDY to determine the column density of the type-2 region, (H), and the mean ionization fractions of the species of interest. We then estimate (Al2+/Al+) by means of Eq. 7, where we take (H)/(H) and we insert the Al+ and Al2+ ionization fractions. In this way we derive model curves of (Al2+/Al+) versus (H∘) that can be compared with the observed data points.
In Fig. 3 we show the results of these calculations for constant values of the ionization parameter. The solutions calculated at (thick curve) are consistent, within the statistical errors, with the linear regression of the observational data points (dashed-dotted line). The corresponding total hydrogen column density of the type-2 layer predicted by the model is (H) cm-2. The solutions calculated at and (lower and upper thin curves, respectively) bracket the observational data points. For these lower and upper envelope curves we find (H) and cm-2, respectively. The total column densities of type-1 and type-2 regions are roughly comparable (). It is remarkable that the (H∘) - (Al2+/Al+) anticorrelation can be easily modeled with very simple assumptions and with a single interval of values in the framework of the S2 model.
3.1.2 Hard-continuum, single-region model (H1 model)
With the QSO-dominated field the H∘ column density of the ionized layer can attain the high values typical of DLAs if is sufficiently high. As a consequence, the presence of a of type-1 region is not required in order to explain the observed (H∘) values. In this case we assume that all the low and intermediate ionization species originate in a single, partially ionized layer. We refer to this hard-continuum, one-region model as H1. We stopped the calculations at a series of (H∘) values representative of DLAs, rather than at a given threshold of ionization fraction. Our treatment of this case is therefore quite similar to those of Lu et al. (1995) and Prochaska & Wolfe (1996). At variance with the S2 model, in the H1 model there is residual ionized gas, and hence Al2+, throughout the interior of the cloud due to the strong high-energy tail of the extragalactic Haardt & Madau spectrum. In Fig. 4 we show the resulting (Al2+/Al+) ratios plotted versus (H∘) at constant values of . We estimated (Al2+/Al+) from Eq. 7 by taking . When is too low there are difficulties with the thermal solution in the CLOUDY computation since the temperature falls well below 1000 K before the total (H∘) is reached. This explains the lack of solutions below in Fig. 4. On the other hand, some of the solutions tend to overproduce Si+3 when is too high. As an example, in Fig. 4 we indicate with empty circles the solutions for which (Si3+/Si+) dex. The intrinsic (Si3+/Si+) is probably much lower than this conservative limit given the very different velocity structure of Si3+ and Si+.
With the H1 model the curves predicted at constant have very different – in some cases opposite – slope from that of the anticorrelation (H∘) - (Al2+/Al+) (Fig. 4). When all the values are considered, the solutions tend to fill the plane (H∘) - (Al2+/Al+) without any preference for the regions populated by observational data. To reproduce the anti-correlation it is necessary to impose very specific constraints to the input parameters. For a given (H∘), there is an allowed interval of values such that the predicted (Al2+/Al+) ratios overlap the observed ones. For instance, at (H∘) = 20.4 we must require that in order to obtain ratios that lie within of the regression to the observed data points (Fig. 4). In addition, the ionization parameter must decrease, on the average, while (H∘) increases. For instance, we must require that in order to reproduce the slope of the observed anticorrelation in the range . This is at variance with the results of the S2 model, for which all the observed data points are easily matched by adopting a single interval of values.
The use of one-side illuminated clouds is inherent to the design of CLOUDY, but may be slightly inappropriate for the external, hard ionizing spectrum case. According to Prochaska & Wolfe (1996) 1-side calculations tend to give a lower degree of ionization than 2-side calculations. We have estimated this effect by doubling the column densities of the 1-side calculations. With this type of estimate we do not find significant changes in the results of the present work, including the abundance corrections discussed below.
3.2 Abundance ionization corrections
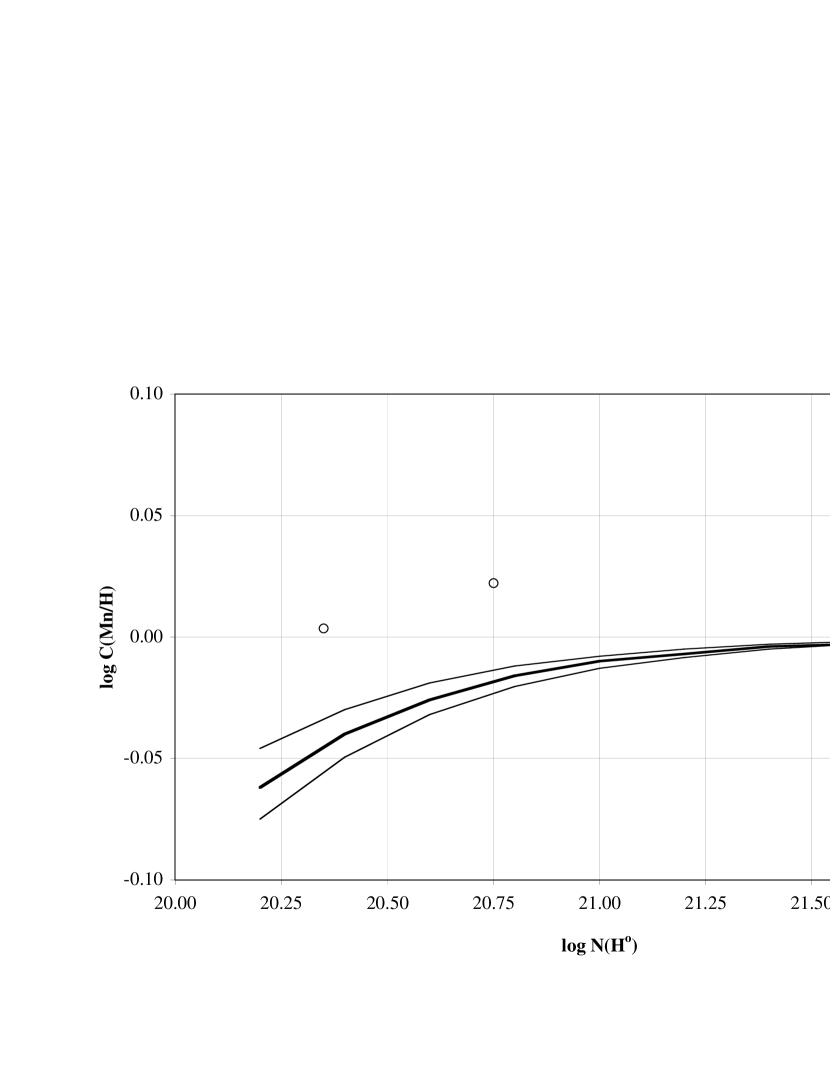
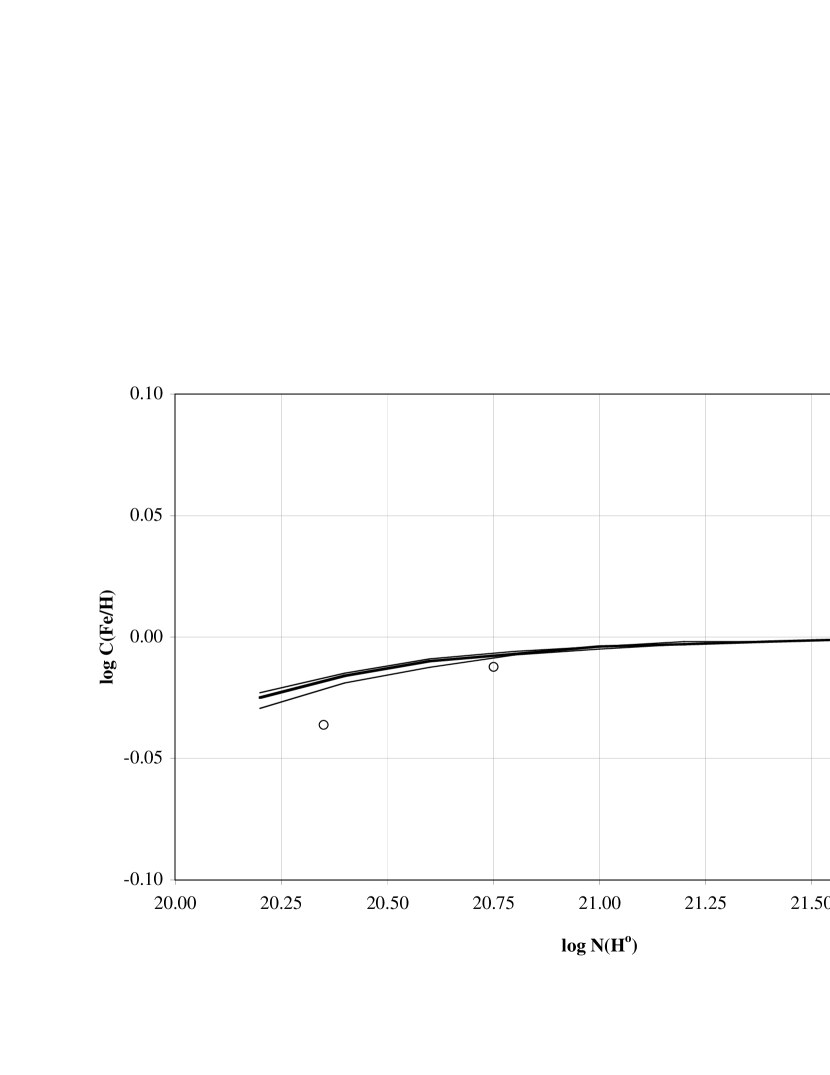
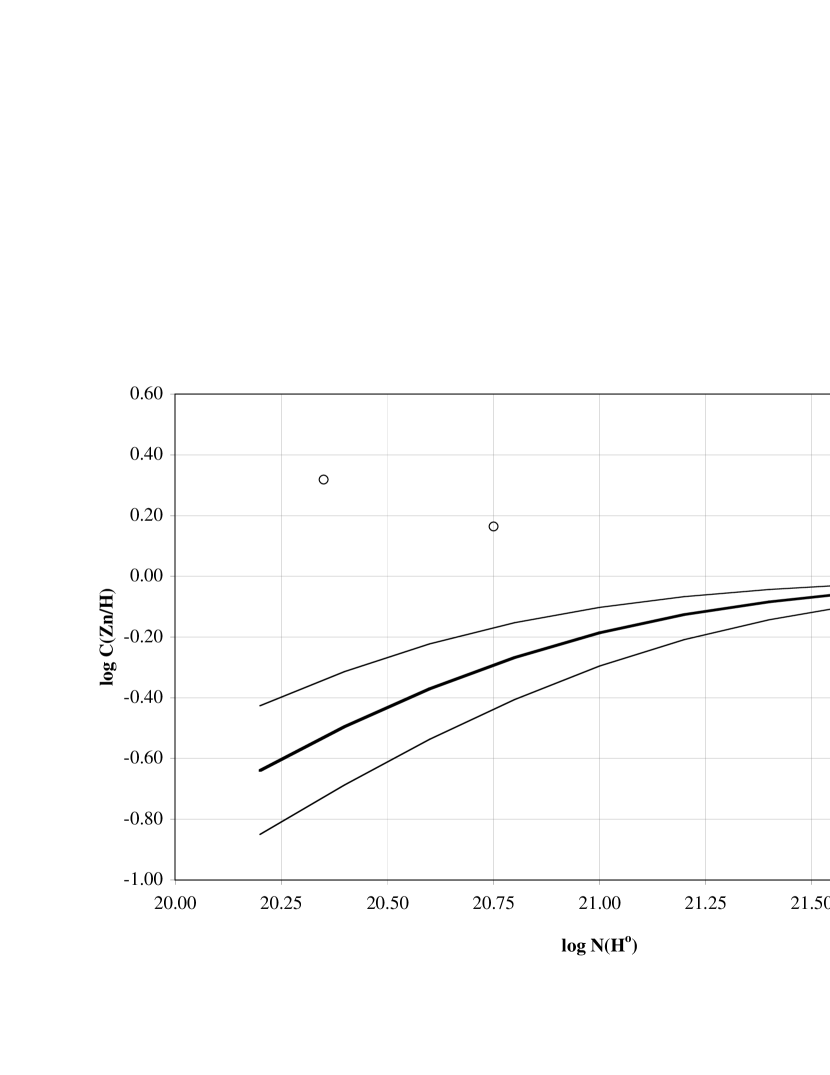
Abundance determinations in DLAs are based on column-density measurements of species which are dominant ionization states in H∘ regions. In the Appendix we define the ionization correction terms that allow us to recover the intrinsic abundances starting from this type of measurements. In order to estimate these correction terms we used the same sets of input parameters — ionizing spectrum, and — that allow us to reproduce the observed {(H∘),(Al2+/Al+)} distribution. In practice, with such parameters we determine the mean ionization fractions with CLOUDY and the correction terms from Eqs. 5 and 6. Thanks to this procedure the input parameters are constrained by the requirement to model the Al2+/Al+ observations. An additional advantage is that the ionization effects are estimated as a function of (H∘), which is a measurable quantity. In this way, the range of predicted ionization corrections is reduced once we know (H∘) for individual DLAs. The resulting corrections for absolute abundances are shown in Figs. 5 through 16. In each figure we display the corrections predicted by the S2 and H1 models discussed above. Corrections for N/H and O/H are not shown in the figures because they are always below abundance measurement errors ( dex).
The corrections estimated with the S2 model are shown in Figs. 5 through 16 (absolute abundances) and Table 3 (relative abundances). In the S2 model the species used for abundance measurements arise mostly in type-1 neutral regions, with an additional contribution from type-2 ionized regions. It is this latter contribution that affects the measured abundances. The correction terms predicted by this model are generally small owing to the high values that we require to match the (Al2+/Al+) versus (H∘) data. In fact, when is high, the species used for abundance measurements tend to vanish in the ionized region since they move to a higher state of ionization. Ionization corrections tend to decrease in absolute value with increasing (H∘). This is due to the fact that the relative contribution of the ionized layer becomes less important at high (H∘).
The predictions for the H1 model have been derived by considering only the solutions which match the empirical (H∘) - (Al2+/Al+) anticorrelation. The empty circles in Figs. 5 through 16 have been calculated using the solutions found at the intersection between the linear regression to the data points and the curves at constant ionization parameter and shown in Fig. 4. Owing to the difficulty of finding solutions at lower and high (H∘) we have not calculated corrections at log (H∘) . It is clear, however, that the correction terms become negligible at high log (H∘). The reason for this is that the corrections decrease (in absolute value) with decreasing and, at the same time, . The predicted corrections are generally small because the match with the observed (Al+2/Al+) ratios is found at low values of .
The correction terms can be negative or positive depending on the model adopted and on the species considered. The corrections for absolute abundances X/H are negative in the S2 model. In this model the dominant species used for the measurements, X and H∘, mostly arises in the type-1 region unaffected by ionization; the type-2 layer gives an extra contribution which enhances the X/H∘ ratio and a negative correction is required to recover the intrinsic abundance. In the H1 model the corrections for absolute abundances can be negative or positive since all the species arise in a single layer in which the X/H∘ ratio can be larger or smaller than the intrinsic abundance.
3.3 Accuracy of Al atomic data
The above calculations rely on the accuracy of the input atomic data. Here we are particularly interested in the accuracy of Al data since our models are constrained by the capability of matching the observed (H∘)-(Al2+/Al+) anticorrelation. The photoionization cross-sections currently used in CLOUDY calculations are generally accurate within 10%, the Al+ cross section having a regular level of accuracy (Verner et al. 1996; Ferland et al. 1998). Radiative recombination rate coefficients can be obtained with an accuracy better than % (Ferland et al. 1998). However, the recombination process can be dominated by dielectronic recombination (DR), which is a far more uncertain mechanism. Low-temperature DR rates, which are critical for determining the ionization balance in photoionization equilibrium, are lacking for many elements (Ferland et al. 1998). Luckily, such coefficients have been calculated for Al. However, given the theoretical and experimental uncertainties it is possible that the Al+ DR rate may be overestimated (Nussbaumer & Storey 1986). If the Al+ recombination rate is overestimated, the predicted (Al2+/Al+) ratio is underestimated. An effect of this type has been reported in a photoionization study of a Lyman Limit system, in which the models that give a good fit to other species are not able to reproduce the relatively high (Al2+/Al+) ratio observed (D’Odorico & Petitjean 2001). In order to test the consequences of an effect of this type we artificially increased the ratio (Al2+/Al+) calculated at any given value of . The results that we found can be summarized as follows. In the S2 model (i) the observed anticorrelation is matched at lower values; (ii) the column density of the ionized layer, which scales with , becomes lower; (iii) the ionization corrections, which scale with , become lower; (iv) the Al correction becomes even lower (in absolute value) owing to the reduced contribution of Al+ from the ionized layer. In the H1 model (i) the solutions that match the observed anticorrelation are shifted to lower values; (ii) the ionization corrections, which in this case scale with , become lower. In summary, if the Al recombination rate is too high, then the ionization parameter and the abundance corrections calculated above should be reduced; in particular, the Al abundance corrections of model S2 would be more in line with those of the other elements.
3.4 Implications for the indirect estimates of (Al+)
The large values of Al correction terms that we find are somewhat surprising given the fact that most Al+ column densities have been indirectly estimated from Si+ column densities.333This discussion could be equally applied to the indirect estimates based on Fe+ column densities. In fact, the (Al+)-(Si+) correlation could, in principle, be destroyed by the large ionization effects predicted. Since this is not the case, we must understand why. One possible reason is that, owing to the uncertainty of Al+ recombination coefficients, the Al correction terms may be overestimated, as we have discussed above. Another possibility is that the Al correction terms are correct, but the correlation is not destroyed because we are considering a limited interval of (H∘). In fact, in the column-density range of the DLAs used for deriving the (Al+)-(Si+) correlation — i.e., 20.3 (H∘) 20.7 — the Al/Si corrections terms are large, but nevertheless they only show a modest variation ( dex). As a consequence, the ionization effects may significantly change the intercept of the (Al+)-(Si+) correlation, but should not change significantly the dispersion and the slope.
The (Al+) values inferred from (Si+) may contain a systematic error when (H∘) 20.7 owing to the variation of (Al/Si) with (H∘). If the Al correction terms are overestimated, the effect is probably small. Otherwise, we can quantify this error from the predicted variation of (Al/Si) between (H∘) and (H∘) . We find that (Al+) may be overestimated by dex in model S2 or underestimated by a similar amount in model H1. These values are generally within the error bars quoted in the last column of Table 1. In any case, these errors would not affect the results of the present work. In the case of model S2, in order to compensate for such errors we should decrease (Al+) and hence increase (Al2+/Al+) by dex at (H∘) 20.7. One can see from Fig. 3 that such increase would even improve the agreement between the S2 model and the observations. In the case of the H1 model, we should instead decrease (Al2+/Al+). This would imply that the interval (,) of allowed solutions should be slightly shifted to lower values at high (H∘).
4 Implications for abundance studies
We briefly discuss how the ionization correction terms presented here can affect studies of DLA abundances. Unless differently specified, the results summarized below are relative to both types of models considered in this work.
The correction terms for N and O are generally negligible. This is not surprising since the ionization fractions of H∘, N∘ and O∘ are held together because of the strong charge exchange reactions (e.g. Sembach et al. 2000). We note, however, that cosmic rays ionization can affect the N∘/O∘ ratio (Viegas 1995). The [N/Si] ratio is slightly underestimated (Table 3). The correction term for [N/S] can be positive or negative, depending on the adopted model. In any case the effect is generally small, with (N/S) dex for (H∘) . These results indicate that the large scatter of [N/Si] and [N/S] abundances found by Lu, Sargent & (1998) and by Centurión et al. (1998) is a genuine nucleosynthetic effect. Claims that nitrogen abundances are severely affected by ionization effects (Izotov & Thuan 1999) are not supported by our study.
The correction terms for Al may be quite large, but with different signs depending on the model adopted (Fig. 6). Measurements of the Al/Fe and Al/Si ratios in DLAs yield [Al/Fe] , with a scatter of dex, and [Al/Si] dex, with values between and dex (Prochaska & Wolfe 1999). Local ISM studies indicate that Al and Fe have similar depletion (Barker et al. 1984; Howk, Savage & Fabian 1999). The [Al/Fe] ratios should not be affected by depletion, while the [Al/Si] ones should be affected as much as the [Fe/Si] ratios, which are underestimated by dex in DLAs (Paper I). So we expect [Al/Fe] 0 and [Al/Si] dex after correcting for dust. For the DLAs with available Al+ measurements we predict (Al/Fe) (Al/Si) dex (S2 model) or dex (H1 model). Therefore, after dust and ionization corrections are applied, the [Al/Fe] and [Al/Si] ratios are below solar in the S2 model, but somewhat enhanced in the H1 model. As we mentioned above, these ionization effects may be weaker if the Al+ recombination rate is overestimated.
Silicon and sulphur are used as a tracers of alpha elements given the difficulty of measuring oxygen in DLAs. The [Si/H] correction term is dex at (H∘) (Fig. 7) and silicon abundances can be accordingly overestimated. However, the effect is not strong and this may explain why [Si/H] measurements in DLAs do not show a trend with (Al2+/Al+), as discussed in Section 2.3. The [S/H] corrections terms are negative for the S2 model and positive for the H1 model, in both cases being dex in absolute value (Fig. 9).
The [Si/Fe] ratio, which is used as a proxy of the /Fe ratio, shows an enhancement of dex in DLAs which has been interpreted as an intrinsic nucleosynthetic effect (e.g. Lu et al. 1996) or as a differential dust depletion (e.g. Paper I). The present study indicates that [Si/Fe] is almost unaffected by ionization corrections, being possibly overestimated by 0.1 dex at low (H∘) in the S2 model. Owing to the negligible dust depletion of both sulphur and zinc, the [S/Zn] ratio has been used as a dust-free [/Fe] indicator in DLAs (Centurión et al. 2000; see however Prochaska et al. 2000). The correction terms for the [S/Zn] ratio are dex in absolute value for the DLAs with available S measurements. Considering that such corrections are dominated by the zinc contribution which may be overestimated (see below), we conclude that the [S/Zn] results presented by Centurión et al.( 2000) are modestly affected by ionization effects. Local interstellar studies yield a S/Zn ratio approximately solar (Howk, Savage & Sembach 1999) suggesting that ionization corrections are unimportant.
Ionization effects tend to lower the measured Ar abundances in the local interstellar medium, at least in lines of sight with (H∘) (Sofia & Jenkins 1998, Jenkins et al. 2000). In DLAs the Ar corrections are negligible in the case of the S2 model; however, Ar may be severely underestimated in the H1 model when the H∘ column density is low (Fig. 10).
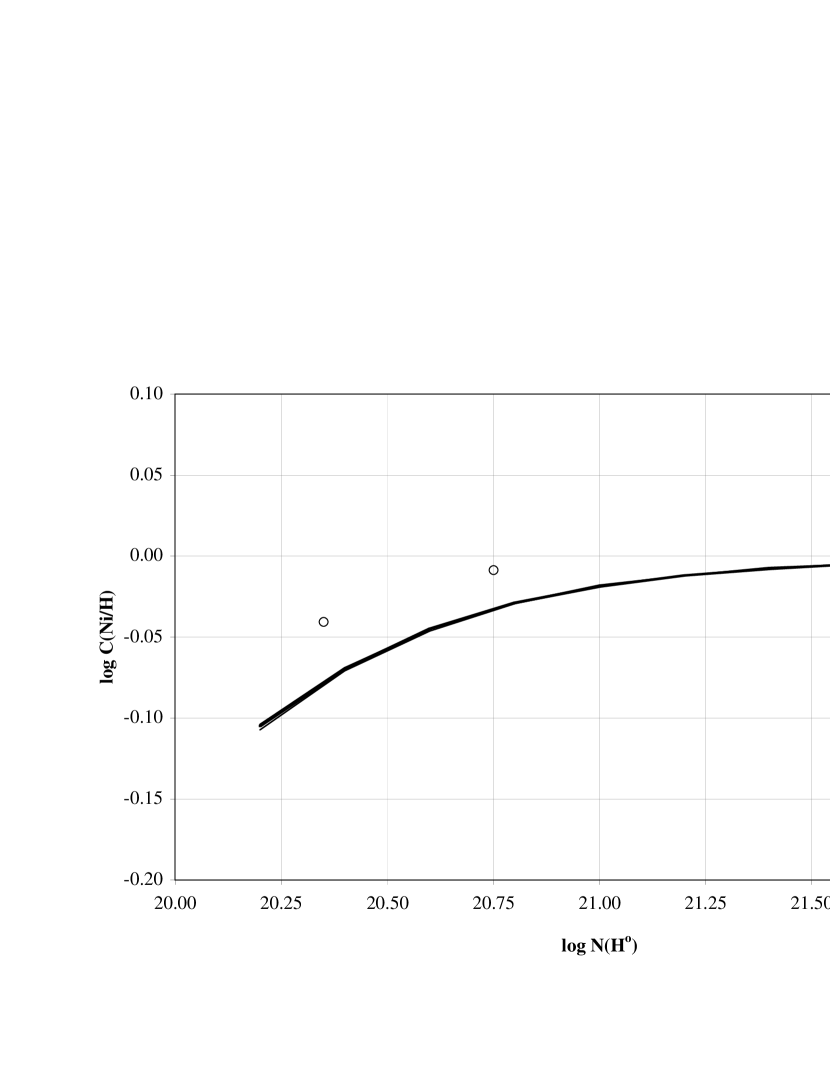
Corrections for Cr and Fe are dex in absolute value (Figs. 12 and 14) and those for Ti, Mn, and Ni are dex (Fig. 11, 13, and 15). Therefore, deviations from solar ratios observed for pairs of iron-peak elements such as [Cr/Fe] and [Mn/Fe] (Lu et al. 1996; Prochaska & Wolfe 1999) must be due either to dust depletion or to nucleosynthetic effects since ionization effects are excluded.
The predicted corrections for Zn are relatively large, with opposite signs depending on the model adopted (Fig. 16). Owing to the predicted variation of the Zn correction terms with (H∘) we would expect to find some trend between the [Cr/Zn] and [Fe/Zn] ratios and (H∘). The lack of any trend (see Section 2.4) suggests that the zinc correction terms may be overestimated. This could be the case since the Zn recombination coefficients and ionization cross sections are rather uncertain (Howk, Savage & Fabian 1999).
5 Summary and conclusions
We have analyzed column density measurements of Al2+ and of singly-ionized species available in literature to cast light on the properties of low-ionization regions in DLA systems. We have found that (Al+) is well correlated with (Si+) and (Fe+) and we have used this result to estimate (Al+) and the ratio (Al2+/Al+) (Al2+)/(Al+) for a sample of 20 DLAs. The ratio can attain relatively high values, up to , with a median value of 0.2. This result is contrary to the common belief that the fraction of Al2+ is generally small in DLAs. In the redshift interval , where most of the measurements are concentrated, the ratio shows the full spread of a factor of 20. Therefore, the ratio must be influenced by local effects not dependent on . Local absorption and/or local radiation fields probably play an important role in determining the ionization properties inside DLAs.
The presence of high fractions of Al2+ with same velocity distribution of low-ionization may question the reliability of abundance determinations in DLAs. We have investigated the behavior of [Si/H] and [Si/Fe] abundance ratios in order to put in evidence possible effects of ionization. However, we do not find any trend between these abundance ratios and (Al2+/Al+). We have considered the possibility that Al2+ originates in a region different from the one where species of low ionization arise. In this case, the ratio (Al2+/Al+) would measure the relative contribution of different regions, rather than the intrinsic degree of ionization of a single region. From a regression analysis of the logarithmic column densities we find some evidence for a distinct behavior of Al2+. In fact, while any pair of species including Al+, Si+ and Fe+ yields correlations with slope unity and low dispersion, pairs including Al2+ yield correlations with lower slopes larger dispersions. One possible explanation of this observational result is that, indeed, Al2+ and singly-ionized species originate in two different regions. However, the two regions must be physically connected since the velocity profiles of Al2+ and of low ions are very similar.
We have also identified the existence of an anticorrelation between (Al2+/Al+) and (H∘). The anticorrelation appears to be an intrinsic property of DLAs not induced by observational bias, at least as far as the detection limits of Al+ and Al2+ are concerned. We have used such anticorrelation, in conjunction with photoionization equilibrium calculations, to constrain the ionization parameter in DLAs and hence the abundance ionization corrections. We have proposed that low-ionization species in DLAs may arise in two types of regions: (1) an H∘ region opaque to photons and/or (2) a partially ionized, Al2+-bearing interface with small/negligible fractions of high ions such as Si+3. We have considered two types of ionizing continuum: a soft, stellar-type (=33,000 K) and a hard, QSO-dominated type at .
We have succesfully reproduced the observed (Al2+/Al+) -log (H∘) anticorrelation by means of a soft-continuum, two-region model (S2 model) with ionization parameter in the range 10-2.6 10-1.7. In this model most of the neutral hydrogen and low ionization species originates in the neutral region of type 1. However, the total hydrogen column density of the partially ionized, type-2 region is relatively high, . At a given value of , is fixed by the photoionization calculation and the contribution of the type-2 region decreases as (H∘) increases. Because Al2+ originates only in the type-2 region, the anticorrelation is naturally explained.
We also tried to reproduce the observed (Al2+/Al+) -log (H∘) anticorrelation by means of a hard-continuum, one-region model (H1 model). In this model all the species of low and intermediate ionization state are assumed to arise in a single layer. In order to reproduce the decrease of (Al2+/Al+) with the correct slope it is necessary to assume that must decrease with a law of the type . The anticorrelation might be due to the decrease of the mean ionization level with increasing self-shielding by neutral hydrogen. The typical values of the ionization parameter at is .
We have estimated abundance ionization corrections for 14 elements of astrophysical interest both with the S2 and the H1 model. In both cases we used the same sets of parameters that allow us to reproduce the anticorrelation between (Al2+/Al+) and log (H∘). Ionization corrections can be negative or positive depending on the model adopted and on the species considered. In any case ionization corrections tend to become smaller in absolute value as (H∘) increases.
Ionization corrections are small in both models, but for different reasons. In the S2 model corrections are small because the species used for abundance measurements tend to shift to a higher ionization state in the type-2 region owing to the high value of that we find. In the H1 model corrections are small because the single region where low-ionization species, together with Al2+, are located has a low level of ionization.
The correction terms for the absolute abundances of N, O, Ti, Cr, Mn, Fe, and Ni are generally below measurement errors ( dex), independently of the adopted ionizing spectrum. Therefore the deviations from solar ratio observed in some pairs of iron-peak elements, such as the [Mn/Fe] or [Cr/Fe] ratios (Lu et al. 1996, Pettini et al. 2000) are not induced from ionization effects. The Ar/H correction term is negligible for the S2 model but may be significant for the H1 model, in which case the measured Ar∘/H∘ value would underestimate the intrinsic Ar/H abundance.
The ionization corrections for Mg, Si, P, and S can attain values somewhat higher than the measurement errors. The [N/Si] and [N/S] ratios are modestly affected by ionization effects. As a consequence, the considerable [N/S] and [N/Si] scatter observed at a given metallicity (Centurión et al. 1998; Lu, Sargent & Barlow 1998) is a genuine characteristic of DLAs. The [Si/Fe] ratio, a typical indicator of the /Fe-peak ratio, may be overestimated by dex at low (H∘) if ionization corrections are not applied. The [S/Zn] ratio might be more sensitive to ionization effects, but the result is uncertain since Zn corrections are probably inaccurate.
The Al corrections can be relatively large. They can be negative or positive, depending whether we adopt the S2 or the H1 model, respectively. The [Al/Fe] and [Al/Si] ratios corrected for dust and ionization effects are below the solar value in the S2 model and somewhat enhanced in the H1 model. These effects, however, are less marked if the Al recombination rate is overestimated.
The Zn corrections are apparently large, but these results may be inaccurate owing to the uncertainties of Zn atomic parameters. From an analysis of [Cr/Zn] and [Fe/Zn] data versus (H∘) we have provided evidence that zinc ionization corrections are likely to be overestimated. Therefore studies of DLAs metallicity based on [Zn/H] data (Pettini et al. 1997; Vladilo et al. 2000) are unlikely to be significantly affected by ionization effects.
We have investigated the stability of the above results in light of possible inaccuracies of Al atomic parameters. In particular we have considered the possibility, consistent with available data, that the Al+ dielectronic recombination rate may be overestimated. We find that in this case the ionization parameter and the abundance corrections would be lower both in the S2 and in the H1 model.
The ionization corrections presented here are significantly smaller than the ones predicted by Izotov, Schaerer & Charbonnel (2000), who have also considered a two-region model of DLA gas. However, these authors assume that the neutral region has much lower metallicity than the ionized one, a strong assumption for which there is little observational support (see Levshakov, Kegel & Agafonova, 2000). With such assumption the metal absorptions originate essentially in the ionized region and the predicted ionization effects are obviously more enhanced than in our case.
Future studies of ionization properties in DLAs would benefit from measurements of ionic ratios other than Al2+/Al+. One possibility is the Fe2+/Fe+ given the presence of the 112.2 nm transition of Fe2+ which could be observed in selected cases. From the point of view of the atomic data it is important to better understand the actual accuracy of atomic parameters, and in particular those of Al and Zn.
6 Appendix: ionization corrections and ionization ratios in the two-region model
We assume that low ionization species in DLAs arise in two type of regions: (1) an H∘ region completely opaque to ionizing photons with eV and (2) a mildly ionized region containing intermediate-ionization species such as Al2+, but not high ions such as C+3 or Si+3. The observed column density of the -th ionization state of the element X is given by the relation
| (1) |
where and indicates the neutral and ionized region, respectively; the integrals are carried on along the portions of line of sight through the two regions; is the local density (atoms cm-3) of X summed over all the possible ionization states ; (Xi) = (Xi)/ is the ionization fraction of the -th state; (X) = (X)/(H) is the absolute abundance of X.
We assume that type-1 and type-2 regions have equal abundances in a given DLA system: . For the dominant ionization state in the type-1 region, , we have and, in particular, (H∘) = 1. From these assumptions and from (1) we can express the intrinsic abundance ratio of two elements X and Y in terms of the column density ratio of the dominant species
| (2) |
where
| (3) |
is, by definition, the ionization correction factor and the mean hydrogen density in the H∘ region. It is easy to obtain similar a expression for the correction term of absolute abundances, , by replacing with in Eq. (3).
We can also derive the column density ratio between two ionization states of a given element. In particular we are interested in comparing the ionization state which is dominant in the neutral region, , with higher ionization states, . Since and we obtain from (1)
| (4) |
We can derive simpler expressions by introducing the average ionization fractions along the line of sight, . With this definition we obtain
| (5) |
| (6) |
and
| (7) |
where is the fraction of the line-of-sight total hydrogen column densities in the two regions. The mean ionization fractions can be estimated by modeling the intensity and spectrum of the ionizing radiation field in which the clouds are embedded. The parameter plays a central role in assessing the importance of ionization effects. When the ionization corrections are negligible since and . In this case the ionization ratio tends to be very low no matter which are the conditions in the ionized envelope. On the other hand, if , the ionization corrections and the ionization ratio are representative of the ionized envelope and not of the neutral region. This latter case is appropriate when we consider that all species of low and intermediate ionization state originate in a single, partially ionized layer.
References
- (1)
- (2) Barker, E.S., Lugger, P.M., Weiler, E.J., & York, D.G. 1984, ApJ, 280, 600
- (3)
- (4) Boissé, P., Le Brun, V., Bergeron, J., & Deharveng, J.M. 1998, A&A, 333, 841
- (5)
- (6) Centurión M., Bonifacio P., Molaro P., & Vladilo G. 1998, ApJ, 509, 620
- (7)
- (8) Centurión M., Bonifacio P., Molaro P., & Vladilo G. 2000, ApJ, 536, 540
- (9)
- (10) D’Odorico, V., & Petitjean, P. 2001, A&A, in press (astro-ph/0102491)
- (11)
- (12) Ferland, G.J., 1996, A Brief Introduction to CLOUDY 90 (Univ. of Kentucky, Dep. of Physics and Astronomy, Internal Report)
- (13)
- (14) Ferland, G.J., Korista, K.T., Verner, D.A., Ferguson, J.W., Kinkgdon, J.B., & Verner, E.M. 1998, PASP, 110, 761
- (15)
- (16) Haardt, F., & Madau, P. 1996, ApJ, 461, 20
- (17)
- (18) Howk, J.C., Savage, B.D., & Fabian, D. 1999, ApJ, 525, 253
- (19)
- (20) Howk, J.C., & Sembach, K.R. 1999, ApJ, 523, L141 (Paper II)
- (21)
- (22) Izotov, Y.I., Schaerer, D., & Charbonnel, C., 2000,ApJ, in press (astro-ph/0010643)
- (23)
- (24) Izotov, Y.I., & Thuan, T.X. 1999, ApJ, 511, 639
- (25)
- (26) Jenkins, E.B., Oegerle, W.R., Gry, C., Vallerga, J., Sembach, K.R., Shelton, R.L., Ferlet, R., Vidal-Madjar, A., York, D.G., Linsky, J.L., Roth, K.C., Dupree, A.K., & Edelstein, J. 2000, ApJ, 538, L81
- (27)
- (28) Kulkarni, V.P., Fall, S.M., & Truran, J.W., 1997, ApJ, 484, L7
- (29)
- (30) Kurucz, R.L. 1991, in Proc. Workshop on Precision Photometry: Astrophysics of the Galaxy, eds. A. C. Davis Philip, A. R. Upgren, & K. A. James (Schenectady: Davis), 27
- (31)
- (32) Lauroesch, J.T., Truran, J.W., Welty, D.E., & York, D.G., 1996, PASP, 108, 641
- (33)
- (34) Levshakov, S.A., Kegel, W.H., & Agafonova, I.I., 2000, A&A, submitted (astro-ph/0011513)
- (35)
- (36) Lopez, S.,Reimers, D., Rauch, M., Sargent, W.L., Smette, A. 1999, ApJ, 513, 598
- (37)
- (38) Lu, L., Savage, B.D., Tripp, T.M., & Meyer, D. 1995, ApJ, 447, 597
- (39)
- (40) Lu, L., Sargent, W.L.W., & Barlow, T.A. 1996, ApJS, 107, 475
- (41)
- (42) Lu, L., Sargent, W.L.W., & Barlow, T.A. 1998, AJ, 115, 55
- (43)
- (44) Madau, P., 1992, ApJ, 389, L1
- (45)
- (46) Madau, P., Haardt, F., & Rees, M.J. 1999, ApJ, 514, 648
- (47)
- (48) Molaro, P., Bonifacio, P., Centurión, M., D’Odorico, S., Vladilo, G., Santin, P., Di Marcantonio, P., 2000, ApJ, 541, 54
- (49)
- (50) Nussbaumer, H., & Storey, P.J. 1986, A&AS, 64, 545 (NS86)
- (51)
- (52) Pei, Y.C., Fall, S.M., & Bechtold, J. 1991, ApJ, 378, 6
- (53)
- (54)
- (55) Pettini, M., Ellison, S.L., Steidel, C.C., Shapley, A.E., & Bowen, D.V. 2000, ApJ, 532, 65
- (56)
- (57) Pettini, M., King, D.L., Smith, L.J., & Hunstead, R.W. 1997, ApJ, 478, 536
- (58)
- (59) Prochaska, J.X., Naumov, S.O., Carney, B.W., McWilliam, A., & Wolfe, A.M. 2000, AJ, 120, 2513
- (60)
- (61) Prochaska, J.X., & Wolfe, A.M. 1996, ApJ, 470, 403
- (62)
- (63) Prochaska, J.X., & Wolfe, A.M. 1997, ApJ, 474, 140
- (64)
- (65) Prochaska, J.X., & Wolfe, A.M. 1999, ApJS, 121, 369
- (66)
- (67) Savaglio, S., Panagia, N., Stiavelli, M., 2000, ”Cosmic Evolution and Galaxy Formation: Structure, Interactions, and Feedback”, J. Franco, E. Terlevich, O. López-Cruz and I. Aretxaga, eds., A.S.P. Conf. Ser., in press, (astro-ph/9912112)
- (68)
- (69) Sembach, K.R., Howk, J.C., Ryans, R.S.I., & Keenan, F.P. 2000, ApJ, 528, 310
- (70)
- (71) Sofia, U.J., & Jenkins, E.B. 1998, ApJ, 499, 951
- (72)
- (73) Steidel, C.C., Pettini, M., & Adelberger, K.L. 2000, ApJ, in press (astro-ph/0008283)
- (74)
- (75) Storrie-Lombardi, L .J., Irwin, M. J., & McMahon, R. G. 1996, MNRAS, 282, 1330
- (76)
- (77) Verner, D.A., Ferland, G.J., Korista, K.T., Yakovlev, D.G. 1996, ApJ, 465, 487
- (78)
- (79) Vladilo, G. 1998, ApJ, 493, 583 (Paper I)
- (80)
- (81) Vladilo, G., Bonifacio, P., Centurión, M., Molaro, P. 2000, ApJ, 543, 24
- (82)
- (83) Viegas, S.M., 1995, MNRAS, 276, 268
- (84)
- (85) Wolfe, A.M., Lanzetta, K.M., Foltz, C.B., Chaffee, F.H., 1995, ApJ, 454, 698
- (86)
- (87) Wolfe, A.M., Prochaska, J.X., 2000, ApJ, in press (astro-ph/0009081)
- (88)
| QSO | log | log (Al2+) | log (Al+) | Ref | log (Al+)predaa Value estimated from (Si+) and from the linear relation shown in Fig. 1. The error bar is obtained from error propagation of the (Si+) error and of the linear regression error. The latter is estimated by taking into account the dispersion of the linear regression, , and the errors and given in the third row of Table 2. | log | |
|---|---|---|---|---|---|---|---|
| 0000263 | 3.3901 | 21.41 0.08 | 12.54 0.10bbValue determined from the UVES spectrum presented by Molaro et al. (2000a). Only the Al2+ line at 186.2 nm has been used. The line at 185.4 nm is affected by telluric contamination. | 13.15 | 2 | 13.66 0.17 | |
| 0100+130 | 2.3090 | 21.40 0.05 | 12.72 0.03 | — | 1 | 14.17 0.25 | |
| 0149+33 | 2.1400 | 20.50 0.10 | 12.56 0.04 | 12.94 0.10 | 1 | 13.14 0.18 | |
| 0201+365 | 2.4620 | 20.38 0.04 | 13.61 0.01 | – | 5 | 14.14 0.24 | |
| 0216+080 | 1.7688 | 20.00 0.18 | 13.20 0.07 | — | 2 | 13.46 0.20 | |
| 0216+080 | 2.2931 | 20.45 0.16 | 13.74 0.02 | 13.88 | 2 | 14.03 0.22 | |
| 03074945 | 4.466 | 20.67 0.09 | — | 13.36 0.06 | 7 | 13.28 0.17 | — |
| 045802 | 2.0400 | 21.65 0.09 | 13.34 0.02 | 13.72 | 1 | — | — |
| 05282505 | 2.1410 | 20.70 0.08 | 12.77 0.08 | 13.46 | 2 | 13.84 0.19 | |
| 05282505 | 2.8110 | 21.20 0.10 | 14.07 | 14.20 | 2 | — | — |
| 0841+129 | 2.3745 | 20.95 0.09 | 12.60 0.10ccMean value of the lines at 185.4 and 186.2 nm. | 13.26 | 1 | 13.82 0.18 | |
| 0841+129 | 2.4764 | 20.78 0.10 | 12.63 0.04 | 13.19ddThe published value is treated as a lower limit since the line is saturated in a substantial part of the profile. | 1 | — | — |
| 0951-0450 | 3.8570 | 20.60 0.10 | — | 13.30 0.02 | 1 | 13.22 0.17 | — |
| 11041805 | 1.6616 | 20.85 0.01 | 13.06 0.02 | 13.43d,ed,efootnotemark: | 3 | 13.96 0.21 | |
| 1215+33 | 1.9990 | 20.95 0.07 | 12.78 0.02 | 13.36 | 1 | 13.61 0.17 | |
| 1331+170 | 1.7764 | 21.18 0.04 | 12.97 0.01ff The Al2+ absorption profile shows one or more features which are not seen, or are much weaker, in the absorption profiles of low ions; the equivalent width of such features is significantly smaller than that of the bulk of the absorption seen also in low ions. | 13.57 | 1 | 13.86 0.19 | |
| 13460322 | 3.7360 | 20.70 0.10 | — | 12.55 0.03 | 1 | 12.52 0.17 | — |
| 1425+603 | 2.8268 | 20.30 0.04 | — | 13.55 | 2 | — | — |
| 1795+75 | 2.6250 | 20.80 0.10 | 13.62 0.04ff The Al2+ absorption profile shows one or more features which are not seen, or are much weaker, in the absorption profiles of low ions; the equivalent width of such features is significantly smaller than that of the bulk of the absorption seen also in low ions. | — | 1 | 14.11 0.24 | |
| 1946+765 | 1.7382 | — | 12.70 0.04 | — | 2 | 13.33 0.17 | |
| 1946+765 | 2.8443 | 20.27 0.06 | 12.26 0.03 | 2,6 | 12.19 0.17 | ||
| 2206199A | 1.9200 | 20.65 0.10 | 13.88 0.01ff The Al2+ absorption profile shows one or more features which are not seen, or are much weaker, in the absorption profiles of low ions; the equivalent width of such features is significantly smaller than that of the bulk of the absorption seen also in low ions. | — | 4 | 14.39 0.28 | |
| 2206199A | 2.0760 | 20.43 0.10 | — | 12.18 0.01 | 4 | 12.32 0.17 | — |
| 2230+025 | 1.8642 | 20.85 0.08 | 13.60 0.01ff The Al2+ absorption profile shows one or more features which are not seen, or are much weaker, in the absorption profiles of low ions; the equivalent width of such features is significantly smaller than that of the bulk of the absorption seen also in low ions. | 14.02 | 1 | 14.24 0.26 | |
| 22310015 | 2.0662 | 20.56 0.10 | 13.14 0.03ccMean value of the lines at 185.4 and 186.2 nm. | — | 1 | 13.83 0.19 | |
| 22370607 | 4.0803 | 20.52 0.11 | — | 12.85 0.02 | 2 | 12.84 0.17 | — |
| 2348147 | 2.2790 | 20.56 0.08 | 11.95 0.08gg The column density refers only to the Al2+ absorption profile in the radial velocity range where the bulk of low ions is observed; a high-velocity Al2+ absorption component is also present, but its column density is not reported here. | 12.65 0.01 | 1 | 12.79 0.17 | |
| 23590216 | 2.0950 | 20.70 0.10 | 12.88 0.05gg The column density refers only to the Al2+ absorption profile in the radial velocity range where the bulk of low ions is observed; a high-velocity Al2+ absorption component is also present, but its column density is not reported here. | 13.66ddThe published value is treated as a lower limit since the line is saturated in a substantial part of the profile. | 1 | 13.99 0.23 | |
| 23590216 | 2.1540 | 20.30 0.10 | 12.96 0.02 | 13.17 0.02 | 1 | 12.88 0.20 |
References. — (1) Prochaska & Wolfe (1999); (2) Lu et al. (1996); (3) Lopez et al. (1999); (4) Prochaska & Wolfe (1997); (5) Prochaska & Wolfe (1996); (6) Lu et al. (1995); (7) Dessauges-Zavadsky et al. (2001)
| Ions | |||||
|---|---|---|---|---|---|
| Si+ vs. Fe+ | 30 | 0.96 | 0.17 | 0.990.06 | 0.640.82 |
| Al+ vs. Fe+ | 8 | 0.91 | 0.20 | 1.200.22 | -3.733.10 |
| Al+ vs. Si+ | 9 | 0.94 | 0.16 | 1.050.15 | -2.202.11 |
| Al2+ vs. Fe+ | 20 | 0.51 | 0.37 | 0.460.18 | 6.252.70 |
| Al2+ vs. Si+ | 17 | 0.74 | 0.35 | 0.830.19 | 0.452.94 |
| (H∘) | 20.2 | 20.4 | 20.6 | 20.8 | 21.0 | 21.2 | 21.4 | 21.6 | 21.8 |
|---|---|---|---|---|---|---|---|---|---|
| [N/O] | +0.002 | +0.001 | +0.001 | +0.001 | +0.000 | +0.000 | +0.000 | +0.000 | +0.000 |
| [N/Si] | +0.149 | +0.100 | +0.066 | +0.043 | +0.028 | +0.018 | +0.011 | +0.007 | +0.004 |
| [N/S] | +0.227 | +0.157 | +0.105 | +0.070 | +0.045 | +0.029 | +0.019 | +0.012 | +0.007 |
| [N/Fe] | +0.027 | +0.017 | +0.011 | +0.007 | +0.004 | +0.003 | +0.002 | +0.001 | +0.001 |
| [N/Zn]bb Systematic errors probably present owing to uncertainty of zinc atomic parameters | +0.642 | +0.498 | +0.372 | +0.269 | +0.188 | +0.128 | +0.085 | +0.055 | +0.036 |
| [O/Mg] | +0.152 | +0.102 | +0.068 | +0.044 | +0.028 | +0.018 | +0.011 | +0.007 | +0.005 |
| [O/Si] | +0.147 | +0.099 | +0.065 | +0.042 | +0.027 | +0.017 | +0.011 | +0.007 | +0.004 |
| [O/S] | +0.225 | +0.155 | +0.105 | +0.069 | +0.045 | +0.029 | +0.018 | +0.012 | +0.007 |
| [O/Fe] | +0.025 | +0.016 | +0.010 | +0.006 | +0.004 | +0.003 | +0.002 | +0.001 | +0.001 |
| [O/Zn]bb Systematic errors probably present owing to uncertainty of zinc atomic parameters | +0.640 | +0.496 | +0.371 | +0.268 | +0.187 | +0.127 | +0.085 | +0.055 | +0.036 |
| [Mg/Si] | 0.005 | 0.004 | 0.002 | 0.002 | 0.001 | 0.001 | 0.000 | 0.000 | 0.000 |
| [Mg/S] | +0.073 | +0.053 | +0.037 | +0.025 | +0.017 | +0.011 | +0.007 | +0.004 | +0.003 |
| [Mg/Fe] | 0.127 | 0.086 | 0.057 | 0.037 | 0.024 | 0.015 | 0.010 | 0.006 | 0.004 |
| [Mg/Zn]bb Systematic errors probably present owing to uncertainty of zinc atomic parameters | +0.488 | +0.394 | +0.304 | +0.224 | +0.159 | +0.109 | +0.073 | +0.048 | +0.031 |
| [Al/Si] | 0.531 | 0.431 | 0.334 | 0.249 | 0.178 | 0.123 | 0.082 | 0.054 | 0.035 |
| [Al/Fe] | 0.653 | 0.514 | 0.389 | 0.284 | 0.201 | 0.137 | 0.092 | 0.060 | 0.039 |
| [Al/Zn]bb Systematic errors probably present owing to uncertainty of zinc atomic parameters | 0.038 | 0.033 | 0.028 | 0.023 | 0.017 | 0.013 | 0.009 | 0.006 | 0.004 |
| [Si/Fe] | 0.122 | 0.083 | 0.055 | 0.036 | 0.023 | 0.015 | 0.009 | 0.006 | 0.004 |
| [Si/Zn]bb Systematic errors probably present owing to uncertainty of zinc atomic parameters | +0.493 | +0.397 | +0.306 | +0.226 | +0.160 | +0.110 | +0.074 | +0.048 | +0.031 |
| [P/Si] | 0.150 | 0.111 | 0.079 | 0.054 | 0.036 | 0.024 | 0.015 | 0.010 | 0.006 |
| [P/Fe] | 0.272 | 0.194 | 0.134 | 0.090 | 0.059 | 0.039 | 0.025 | 0.016 | 0.010 |
| [P/Zn]bb Systematic errors probably present owing to uncertainty of zinc atomic parameters | +0.343 | +0.286 | +0.227 | +0.172 | +0.124 | +0.086 | +0.058 | +0.038 | +0.025 |
| [S/Si] | 0.078 | 0.057 | 0.039 | 0.027 | 0.018 | 0.011 | 0.007 | 0.005 | 0.003 |
| [S/Fe] | 0.200 | 0.139 | 0.094 | 0.063 | 0.041 | 0.026 | 0.017 | 0.011 | 0.007 |
| [S/Zn]bb Systematic errors probably present owing to uncertainty of zinc atomic parameters | +0.415 | +0.341 | +0.267 | +0.199 | +0.143 | +0.098 | +0.066 | +0.044 | +0.028 |
| [Ti/Si] | +0.083 | +0.057 | +0.038 | +0.025 | +0.016 | +0.010 | +0.007 | +0.004 | +0.003 |
| [Ti/Fe] | 0.039 | 0.026 | 0.017 | 0.011 | 0.007 | 0.004 | 0.003 | 0.002 | 0.001 |
| [Ti/Zn]bb Systematic errors probably present owing to uncertainty of zinc atomic parameters | +0.576 | +0.454 | +0.344 | +0.251 | +0.176 | +0.120 | +0.08 | +0.052 | +0.034 |
| [Cr/Si] | +0.134 | +0.091 | +0.060 | +0.039 | +0.025 | +0.016 | +0.010 | +0.006 | +0.004 |
| [Cr/Fe] | +0.012 | +0.008 | +0.005 | +0.003 | +0.002 | +0.001 | +0.001 | +0.001 | +0.000 |
| [Cr/Zn]bb Systematic errors probably present owing to uncertainty of zinc atomic parameters | +0.627 | +0.488 | +0.366 | +0.265 | +0.185 | +0.126 | +0.084 | +0.055 | +0.035 |
| [Mn/Si] | +0.086 | +0.059 | +0.039 | +0.026 | +0.017 | +0.011 | +0.007 | +0.004 | +0.003 |
| [Mn/Fe] | 0.036 | 0.024 | 0.016 | 0.01 | 0.006 | 0.004 | 0.003 | 0.002 | 0.001 |
| [Mn/Zn]bb Systematic errors probably present owing to uncertainty of zinc atomic parameters | +0.579 | +0.456 | +0.346 | +0.252 | +0.177 | +0.121 | +0.080 | +0.053 | +0.034 |
| [Ni/Si] | +0.042 | +0.029 | +0.020 | +0.013 | +0.009 | +0.005 | +0.004 | +0.002 | +0.001 |
| [Ni/Fe] | 0.080 | 0.054 | 0.035 | 0.023 | 0.015 | 0.009 | 0.006 | 0.004 | 0.002 |
| [Ni/Zn]bb Systematic errors probably present owing to uncertainty of zinc atomic parameters | +0.535 | +0.427 | +0.326 | +0.239 | +0.169 | +0.115 | +0.077 | +0.050 | +0.033 |
| [Zn/Fe] | 0.615 | 0.480 | 0.361 | 0.262 | 0.183 | 0.125 | 0.083 | 0.054 | 0.035 |