THE NEARBY FIELD GALAXY SURVEY
Abstract
Abstract. We report on our observing programme to obtain integrated spectrophotometry, intermediate and high-resolution major-axis spectra, and surface photometry of a representative sample of 200 galaxies in the nearby field. The main goal of this programme is to provide a comparison sample for high-redshift studies and to study the variation in star formation rates (SFRs), star formation history (SFH), excitation, metallicity, and internal kinematics over a wide range of galaxy luminosities and morphological types. In particular, we extend the work of Kennicutt (1992) to lower-luminosity systems.
We present the main results of our analysis sofar. In these proceedings, we condense the presented two atlases of 1) images and radial surface brightness profiles and colour profiles, and 2) images and integrated spectra into several example images, profiles and spectra, showing the general trends observed. For the original atlasses we refer the reader to the electronic distribution on CDROM or as available on the Web at http://www.astro.rug.nl/nfgs/.
1 Introduction
As galaxies are now routinely sampled at fainter magnitudes and higher redshifts than ever before, one of the major problems with the interpretation of distant spectroscopic data has become the difficulty of obtaining good comparison samples in the local Universe. Distant galaxies subtend a small angle on the sky and their spectra are unavoidably integrated spectra, while most spectra of nearby galaxies are nuclear spectra only. A direct comparison of distant and nearby galaxy spectra, therefore, is difficult.
In a pioneering effort, Kennicutt (1992) obtained integrated spectrophotometry for 90 galaxies spanning the entire Hubble sequence. His study has been a benchmark for the interpretation of spectra at both high and low redshift. The range in luminosity sampled per type, however, was limited to the brightest galaxies, and no uniform surface photometry or internal kinematic data is available. Also, only 44 out of 90 galaxies were observed at intermediate spectral resolution (5–7Å), the remainder at lower resolution (15–20Å). Large homogeneous samples of intermediate- or high-resolution nuclear and integrated spectrophotometry, supplemented by multifilter surface photometry, for galaxies spanning the entire Hubble sequence and with a large range in luminosity, are absent in the literature to date.
2 The Nearby Field Galaxy Survey
With our Nearby Field Galaxy Survey (NFGS) we aim to remedy this situation. The purpose of our study is to obtain integrated and nuclear spectrophotometry over the entire optical regime, as well as , , , and surface photometry, and high-resolution spectroscopy, for a sample of 196 galaxies in the nearby field, including galaxies of all types and spanning a large range in luminosity. By ‘field’ we imply a selection that includes galaxies in clusters, groups an low-density environments, as opposed to a selection favoring any single one of these.
The data will be used to study the emission- and absorption-line strengths, star formation rate and star formation history, morphologies, structural parameters, colours, magnitudes and internal kinematics of gas and stars, both globally and as a function of radius within a galaxy. We thus aim to extend the work of Kennicutt to lower-luminosity galaxies accross the Hubble sequence and to study the variation in galaxy properties over a wide range of absolute magnitudes and types.
The data can be used as a benchmark for galaxy evolution modelling and comparison with observations of high-redshift galaxies, as will result from future observations with large ground-based telescopes and the NGST.
3 Selection of the sample
The 196 target galaxies in this survey have been objectively selected from the CfA redshift catalog (CfA I, Huchra et al., 1983) to span the full range in absolute magnitude present in CfA I (), while sampling fairly the changing mix of morphological types as a function of luminosity. Absolute magnitudes were calculated directly from blue photografic magnitudes and radial velocities in the Local Group restframe, assuming km s-1 Mpc-1.
To avoid a sampling bias favouring a cluster population, we excluded galaxies in the direction of the Virgo Cluster with velocities smaller than 2000 km sec-1. We also minimized the number of galaxies larger than 3 arcmin (the slit length of the FAST spectrograph) by imposing a luminosity-dependent lower limit on the radial velocity. Thus, we do not impose a strict diameter limit, while avoiding selecting the nearest high-luminosity galaxies (which tend to be the largest on the sky). We sorted the 1006 galaxies remaining after our Virgo Cluster and radial velocity cuts into 1-magnitude-wide bins of absolute magnitude, which in turn were sorted according to Hubble type. We then drew from each bin a number of galaxies chosen to approximately reproduce the local galaxy luminosity function, while preserving the mix of morphological types in each luminosity bin. The total number of galaxies selected is 196, with a median redshift of 0.01 and a maximum redshift of 0.07. Only eight of these have major-axis optical diameters larger than the slit length.


In Figure 1 we give an overview of the global properties of the selected galaxy sample. The number distributions in magnitude, type and colour are broad and, although the distribution in effective surface brightness is peaked, we do have several examples of low surface brightness galaxies.
With very few caveats this sample can be considered a fair representation of the local galaxy population.
4 Observations
4.1 Surface photometry
The photometric observations were obtained at the F.L. Whipple Observatory’s 1.2 m Telescope111The F.L. Whipple Observatory (FLWO) is operated by the Smithsonian Astrophysical Observatory and is located on Mt. Hopkins in Arizona. during 50 dark nights between 1994 March and 1997 March. -filter images were obtained with a thinned back-illuminated CCD, while most and images were obtained with an older camera and a front-illuminated CCD. Typically, we exposed , and seconds to reach limiting surface brightnesses of , , and mag arcsec-1 in , , and .
Radial surface brightness profiles were extracted using an ellipse fitting procedure (Jørgensen, Franx & Kjærgaard, 1992) with centre, position angle and ellipticity fixed at all radii to the average values in the outer parts. Total, effective and isophotal magnitudes were calculated from the radial surface brightness profiles. Tests of the internal and external accuracy of our photometry indicate typical errors of 0.02 mag and 0.05 mag for isophotal and total magnitudes, respectively.
4.2 Spectrophotometry
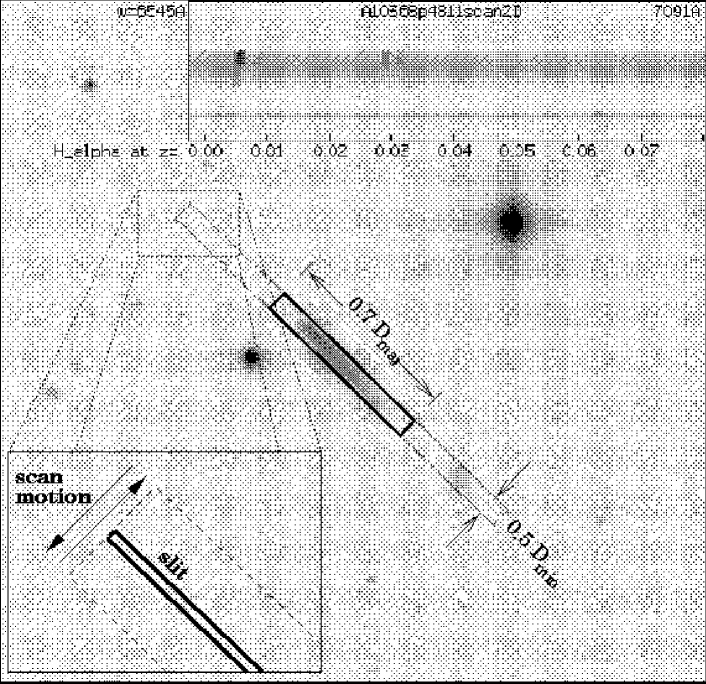
Integrated and nuclear spectra were obtained with the FAST spectrograph (Fabricant et al., 1998) at the FLWO 1.5 m Telescope during 41 nights between 1995 March and 1997 March. The pixel thinned CCD of the FAST in combination with a 300 l/mm grating allowed coverage of the entire near-UV through optical range (3500–7250Å) in a single exposure, at a resolution (FWHM) of 6Å. We aligned the spectrograph slit approximately along the major axis of each galaxy. The integrated spectra were obtained by drift-scanning the slit over a total distance of half the minor-axis optical diameter and extracting over 0.7 times the major-axis optical diameter (Figure 2). Thus, on average, we sample almost 80% of the total galaxy light.
Based on a comparison of the colours measured in our photometry and the synthetic colours measured in the spectra, and on a comparison with several galaxies from Kennicutt’s sample reobserved for this goal, we claim an overall relative spectrophotometric accuracy of 6% (Jansen et al., 2000b).
4.3 Internal kinematics
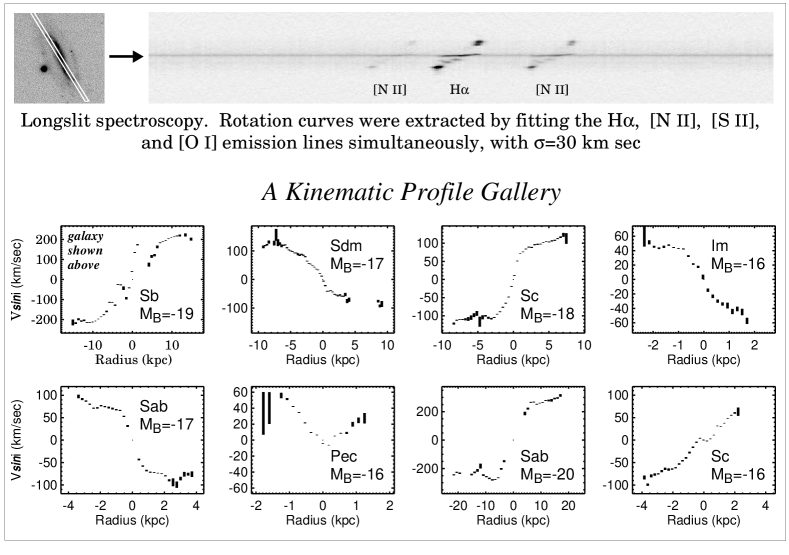
Kannappan (2001) has obtained high-resolution spectra in the range 6000–7000Å (emission-line galaxies) at a resolution (FWHM) of 1Å, and in the range 4000–6000Å (no or relatively little emission) at a resolution (FWHM) of 2.3Å. Rotation curves were derived from the former (see Figure 3) by simultaneously fitting the wavelengths of H, [N ii], [S ii] and [O i] lines as a function of radius in a galaxy. Velocity dispersions were fit using a velocity-broadened stellar template and a Fourier fitting algorithm (Franx, Illingworth, & Heckman, 1989) in the latter spectra.
The main goals of these measurements are to study galaxy mass profiles as a function of morphological and spectrophotometric properties, to compare gas and stellar kinematics and investigate kinematic evidence of galaxy interactions, mergers and mass infall.
4.4 and surface photometry
Pahre et al. (in prep.) have obtained near-infrared and filter surface photometry for half of the NFGS galaxies. The main purpose of these observations is to determine the relative contributions of spheroids and disks to the luminosity density of the local universe.
Previous measurement of this parameter (Schechter & Dressler, 1987) relied on visual total magnitude and bulge estimates from photographic plates, and suffered from relatively poor knowledge of the luminosity functions of different morphological types. Combination of , , , and photometry and our spectrophotometry will allow a better separation of age and metallicity effects, as well as internal extinction, while inversion of our selection and comparison with a deeper complete spectroscopic sample (e.g., Carter 1999) allows us to infer volume densities as a function of type and luminosity.
5 Results
5.1 Surface photometry
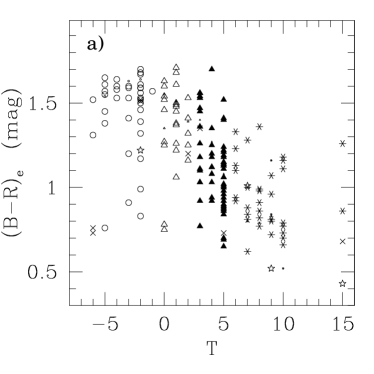
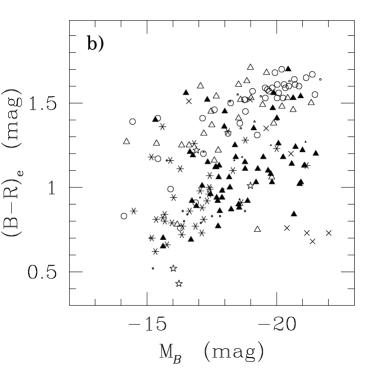
We observe a strong trend of colour with morphological type, with later-type galaxies becoming progressively bluer (Figure 4a). The observed scatter on this trend is 0.19 mag, which is smaller than the 0.24 mag scatter on the colour–magnitude trend where intrinsically fainter systems tend to be bluer than brighter systems (Figure 4b). Estimating a galaxy’s broad type class (E, S, Irr) from its colour can, therefore, be as accurate as estimates based on galaxy asymmetry and central concentration of the light (Abraham et al., 1996).
We find that colour–magnitude relations are useful for early-type systems and to a lesser degree for very late-type systems, but not useful for intermediate-type spirals. We also verify the result of Tully et al. (1996), that the faintest galaxies may become redder with radius instead of bluer. Star formation is the driving force in this trend (Jansen et al., 2000a).
5.2 Spectrophotometry
The bluing of galaxies towards both later morphological types and lower luminosities is apparent in the spectrum continua (Figure 5) as well. Moreover, the emission line strengths increase with respect to the continua going to lower-luminosity systems. This trend is most apparent for the intermediate-type spiral galaxies, but can be seen all accross the Hubble sequence.


Of particular interest is the relative strength of the [O ii]3727Å line with respect to H, as [O ii] is the strongest line available in the optical regime for galaxies with and has been widely used as a tracer of the SFR. Both figures 5 and 6b show that the fainter galaxies tend to have [O ii] in excess of the relation found by Kennicutt (1992), corresponding to EW([O ii]) EW(H). Jansen et al. (2001) demonstrated that this must be attributed to a combination of 1) a smaller amount of interstellar reddening — which boosts the strength of [O ii] relative to the Balmer lines over a large range in temperature — and 2) a higher average excitation temperature in the ISM of low-luminosity galaxies than in high-luminosity galaxies. The underlying cause for both these trends was shown to be metallicity.
References
- [1] Abraham, R.G., Tanvir, N.R., Santiago, B.X., Ellis, R.S., Glazebrook, K., and van den Bergh, S.: 1996, Mon. Not. R. Astron. Soc. 279, L47.
- [2] Carter, B.: 1999, Ph.D. thesis, University of Chicago.
- [3] Fabricant, D., Cheimets, P., Caldwell, N., and Geary, J.: 1998, Publ. Astron. Soc. Pacific 110, 79.
- [4] Franx, M., Illingworth, G., and Heckman, T.: 1989, Astron. J. 98, 538.
- [5] Huchra, J.P., Davis, M., Latham, D., and Tonry, J.: 1983, Astroph. J. Suppl. 52, 89. (CfA I)
- [6] Jansen, R.A., Franx, M., Fabricant, D., and Caldwell, N.: 2000a, Astroph. J. Suppl. 126, 271.
- [7] Jansen, R.A., Fabricant, D., Franx, M., and Caldwell, N.: 2000b, Astroph. J. Suppl. 126, 331.
- [8] Jansen, R.A.: 2000, Ph.D. thesis, University of Groningen
- [9] Jansen, R.A., Franx, M., and Fabricant, D.: 2001, Astroph. J. (in press).
- [10] Jørgensen, I., Franx, M., and Kjærgaard, P.: 1992, Astron. Astroph. Suppl. 95, 489.
- [11] Kannappan, S.J.: 2001, Ph.D. thesis, Harvard University
- [12] Kennicutt, R.C. Jr.: 1992, Astroph. J. 388, 310.
- [13] Schechter, P.L., and Dressler, A.: 1987, Astron. J. 94, 563.
- [14] Tully, R.B., Verheijen, M.A.W., Pierce, M.J., Huang, J.-S., and Wainscoat, R.: 1996, Astron. J. 112, 2471.