Far Infrared Spectroscopy of star-forming galaxies: Expectations for the Herschel Space Observatory
Abstract
ISO has enabled far-infrared spectroscopy of a variety of galaxies. Using the [CII] () and [OI]() lines, we can characterize the physical conditions in the star-forming ISM. These observations also form the basis of our expectations for what the Herschel Space Observatory will observe for high redshift galaxies. While [CII] is suppressed in ULIRGs and normal galaxies with high dust temperatures, it is stronger than expected in metal poor galaxies by factors of a few. Young galaxies at high redshifts might be expected to be both metal poor and actively star-forming, leading to contrary expectations for the [CII] line strength. The best prediction for [CII] detection is derived by using the observed proportionality between [CII] and mid-IR emission from PAHs. Using the observed [CII]/7 ratio and number counts from ISO deep surveys we predict that HSO will be able to detect 100 sources/square-degree in the [CII] line.
keywords:
Galaxies: formation – Stars: formation – Missions: FIRST1 Introduction
Herschel Space Observatory (HSO) will have the wavelength coverage and sensitivity to detect high redshift galaxies at the peak of their dust continuum emission. The three instruments onboard HSO will also carry out spectroscopy in the far-infrared and sub-millimeter. From the FIR lines of and O, we can derive physical conditions in the star-forming ISM at these redshifts. From optical observations it seems that star-formation peaks at z=1-2 (e.g. Madau et al. 1996). It would be interesting to investigate the properties of the ISM in star-forming galaxies at these redshifts, and thus learn the causes and consequences of higher star-formation.
In this paper I use ISO observations of the fine structure lines in nearby galaxies to (a) summarize what we have learned about the ISM of galaxies from ISO and (b) do feasibility calculations about what HSO will see at high redshifts.
2 The [CII] () line
[CII] () line is the dominant coolant of the neutral ISM in all but the hottest galaxies. For most of the observed galaxies 0.1-1% of the FIR continuum emerges in this single line. Not coincidentally, it is the best studied line in this wavelength regime. It has been observed for normal galaxies (Stacey et al. 1991, Malhotra et al. 1997, 1999, 2001, Leech et al. 1999, Pierini et al. 1999), irregular/dwarfs (Smith et al. 1997, Bergvall et al. 2000, Hunter et al. 2001, Madden et al. 2001), Ellipticals (Malhotra et al. 2000, Unger et al. 2000) and luminous and ultraluminous infra-red galaxies (Luhman et al. 1998, Fischer et al. 2001). So now we have a low redshift “basis set” of various types of galaxies to draw upon.
The deficiency in [CII]/FIR in ULIRGs and normal galaxies (Malhotra et al. 1997, Luhman et al. 1998) came as a surprise to many. The decrease in [CII]/FIR correlates best with the IRAS colors of galaxies (Figure 1; Malhotra et al. 2001). It also correlates, but less strongly, with other quantities like FIR/Blue colors and Infrared luminosity. Since , FIR/Blue and FIR luminosity correlate with each other, we cannot say which correlation with [CII]/FIR is primary and which ones are secondary. Luminous and ultraluminous galaxies from the sample of Luhman et al. 1998 follow the same trends. Two high redshift quasars BRI 1202-0752 (z=4.69) and BRI 1335-0415 (z=4.41) have measured upper limits on the [CII] flux and also follow the same trendd (Benford 1999).

3 Irregular galaxies
While FIR colors show the strongest correlation with , there seems to be a second parameter, which is apparent from Figure 1. Irregular galaxies have a higher and Ellipticals have lower ratio. It is not yet clear whether this has to do with the lower metallicity affecting the chemistry of the ISM directly or because low metallicity stellar populations produce a harder radiation field. Hunter et al. 2001 and Madden et al. 2001 discuss in detail how both and [CII]/MIR emission is higher for irregular galaxies.
Even more dramatic is the fact that [OIII] () line from HII regions is very bright in 2 of our irregular galaxies. In IC 4662 and NGC 1569 [OIII]/FIR is fully 1% (Malhotra et al. 2001). This is promising for detection of [OIII] at high redshifts, but it also means that we cannot reliably assume that that the brightest (and sometimes the only) line detected is [CII].
NGC 1569 and IC 4662 are dwarf galaxies and hence not very luminous. We would not be able to see thier counterparts at z=1 or even z=0.5. The [OIII] (88) line from the metal poor irregular Haro 11 (Bergvall et al. 2000) would be observable at z=1, even as the [CII] line falls short.
4 FIR spectroscopy at high redshifts
In figure 2 we compare the luminosity distribution of three prominent FIR lines in the ISO key-project sample. These lines are [CII] (158 ), [OI] (63 ) and [OIII] (88 ). This is not a luminosity function, since our sample is not volume limited, but serves to compare the luminosity distribution among the three brightest lines. We see that in spite of the [CII] deficiency which cuts off the high luminosity tail of the distribution, [CII] is clearly the more luminous of these three lines, and therefore offers the best prospects for being widely detected.
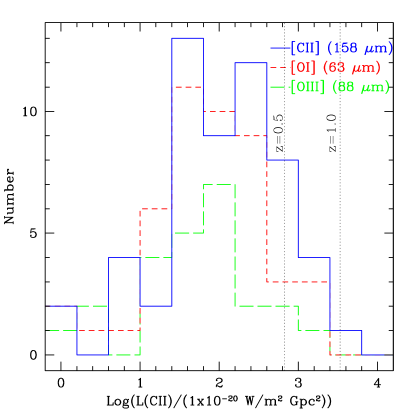
The [CII] deficiency in the most active and luminous galaxies flattens the luminosity function of the line relative to continuum. Since the most luminous objects (e.g. ULIRGs) are deficient in [CII] the prospects for detecting them at redshifts and higher are dim. Observations of known high redshift objects with JCMT and CSO have only yielded upper limits (van der Werf et al. 1998, Benford 1999). These upper limits are consistent with the trend seen between and (Figure 1). It seems that the correlation between and is stronger than between and luminosity (Malhotra et al. 2001). In principle, a cool but luminous source would be detectable at high redshifts. In practice, however, luminous sources also tend to have warm FIR colors. The [CII] deficiency in high redshift galaxies may be somewhat mitigated if starburst galaxies are metal poor, since metal poor galaxies have [CII]/FIR higher by a factor of a few. But this effect is not expected to be large.
4.1 Source density of high-z [CII] targets
While the [CII]/FIR behaviour is complicated and correlates best with , we can exploit the [CII]/MIR constancy to predict the number of galaxies that are observable with Herschel Space Observatory.
Helou et al. 2001 point out that the ratio of [CII] flux and the flux in the mid-infrared band at 7 remains constant with FIR colors and shows a smaller scatter than does . The physical interpretation of the correlation between [CII] and 7 flux is simple. The mid-infrared flux in the 6.75 band of ISO-CAM is dominated by emission from Polycyclic Aromatic Hydrocarbons (PAHs). We interpret the stable [CII]/ ratio as evidence that gas heating is dominated by the PAHs or small grains which are also AFE carriers.
Another interpretation of the constancy of [CII]/ is that PAHs/very small grains and are co-extensive in PDR regions. The decrease in both [CII]/FIR (Malhotra et al. 1997, 2001) and /FIR with F60/F100 (Helou et al. 2001, Lu et al. 2001) are then due to a smaller fraction of FIR arising from the PDR phase.
Regardless of the right explanation/interpretation of the proportionality between [CII] and PAH emission, we can use it to predict what the Herschel Space Observatory will be able to observe.
From the ISO key-project sample we derive
A sensitivity of (HIFI) in the [CII] line then translates to rest-frame 7 micron flux of 1 mJy. Deep observations with ISOCAM (Elbaz et al. 1999) show that the surface density of sources with 15 fluxes is roughly 100 per square-degree.

There are two caveats we need to keep in mind when using the deep counts in the mid-IR to predict the number of galaxies which will have detectable [CII] flux. The first is that the flux in the mid-infrared is dominated by spectral features due to aromatic molecules, which means that as we get to higher redshifts K-corrections for fluxes measured in any broad-band filter are substantial and not always of the same sign (Xu et al. 1998). The other concern has to do with metal poor galaxies. They show a deficiency in PAH features in the mid-IR (Thuan et al. 1999), but also show higher [CII]/MIR and [CII]/FIR by factors of 2-3. In these galaxies presumably most of the heating is due to the very small grain component of dust, which emit in the mid-IR but do not produce aromatic features.
5 Physical conditions in the PDRs
We derive the average physical conditions in the neutral gas in galaxies, by comparing the observed line to continuum ratio and with PDR models (e.g. Kaufman et al. 1999). The main results of this study are (Malhotra et al. 2001):
(1) The derived temperatures at the PDR surfaces range from 270-900 K, and the pressures range from . The lower value of the pressure range is roughly twice the local solar neighborhood value and the upper end is comparable to pressures in HII regions in starburst galaxies (Heckman, Armus & Miley 1990) which also corresponds to the pressure and surface brightness at which starbursts saturate (Meurer et al. 1997).
(2) The average FUV flux and gas density scale as G. This correlation is most naturally explained as arising from Strömgren sphere scalings if much of the line and continuum luminosity arises near star-forming regions. From simple Strömgren sphere calculations (cf. Spitzer 1978) we can derive that the FUV flux at the neutral surface just outside the Strömgren sphere should scale as G, which is consistent (within errors) to the scaling seen in Figure 4. The , and which we derive for given galaxy represent a luminosity weighted average value and mostly represents dense GMCs which lie close to the OB stars.
(3) The range of , and which we derive for the different galaxies can reflect several interesting differences in their star formation processes and histories. If global star formation is episodic then high G0 and imply that the galaxy is observed shortly after a burst because the OB stars have not moved far from their natal clouds. Alternatively, the differences in , and may reflect differences from galaxy to galaxy in the properties of the GMCs which form the OB stars. Larger GMCs may keep their OB stars embedded for a longer fraction of their lifetime, resulting in higher average and . Or the GMCs could be the same size but denser, so that the higher density ambient gas would lead to smaller Stromgren spheres and higher at the edges of the spheres.

6 Conclusions
It seems unlikely that spectroscopy with HSO will be used to find redshifts of infrared bright galaxies with unknown or obscured optical counterparts simply because scanning the possible redshift range would be time consuming. But once the redshifts are known, one can use the observations of [CII] and [OI](63 ) lines to derive the physical conditions in PDRs. Or if photometric redshifts using mid to far-infrared colors can be refined enough, one could search for fine structure lines to get the precise redshifts.
FIR spectroscopy of modest redshift ( ) galaxies would be feasible with the HSO. This would be valuable to understand the higher global rates of star-formation in this epoch at roughly half the age of the universe. With ISO we have been able to characterize the ISM in star-forming local galaxies, so we do have a comparison set.
Acknowledgements.
I would like to thank my collaborators on the ISO Key Project - George Helou, Michael Kaufman, David Hollenbach, Danny Dale, Alexandra Contursi and Gordon Stacey. SM’s research funding is provided by NASA through Hubble Fellowship grant # HF-01111.01-98A from the Space Telescope Science Institute, which is operated by the Association of Universities for Research in Astronomy, Inc., under NASA contract NAS5-26555.References
- [] Benford, D.J., 1999, PhD Thesis, California Institute of Technology.
- [Bergvall, Masegosa, Östlin, & Cernicharo(2000)] Bergvall, N., Masegosa, J., Östlin, G., & Cernicharo, J. 2000, A&A, 359, 41
- [Elbaz et al.(1999)] Elbaz, D. et al. 1999, A & A, 351, L37
- [] Heckman, T. M., Armus, L. & Miley, G. K. 1990, AJS, 74, 833
- [Helou et al.(2001)] Helou, G., Malhotra, S., Hollenbach, D. J., Dale, D. A., & Contursi, A. 2001, ApJ, 548, L73
- [] Hunter et al. 2001, to appear on ApJ (astro-ph/0012354)
- [] Kaufman, M., Wolfire, M.G., Hollenbach, D., Luhman, M 1999, ApJ, in press.
- [Leech et al.(1999)] Leech, K. J. et al. 1999, MNRAS, 310, 317
- [] Luhman, M.L., et al. 1998, ApJ, 504, L11.
- [Madau et al.(1996)] Madau, P., Ferguson, H. C., Dickinson, M. E., Giavalisco, M., Steidel, C. C., & Fruchter, A. 1996, MNRAS, 283, 1388
- [] Malhotra, S. et al. 1997, ApJ, 491, L27
- [] Malhotra, S. et al. 1999, in Universe as seen by ISO, ed: Cox, P., Kessler, M.
- [] Malhotra, S. et al. 2000, ApJ, 543, 634.
- [] Malhotra, S. et al. 2001, Submitted to ApJ.
- [] Meurer, G. R., Heckman, T. M., Lehnert, M. D., Leitherer, C. & Lowenthal, J. 1997, AJ, 114, 54
- [Pierini, Leech, Tuffs, & Volk(1999)] Pierini, D., Leech, K. J., Tuffs, R. J., & Volk, H. J. 1999, MNRAS, 303, L29
- [Smith & Madden(1997)] Smith, B. J. & Madden, S. C. 1997, AJ, 114, 138
- [] Spitzer, L. 1978, Physical Processes in the Interstellar medium, John Wiley & Sons.
- [] Stacey, G.J., Geis, N., Genzel, R., Lugten, J.B., Poglitsch, A., Sternberg, A., Townes, C.H. 1991, ApJ, 373, 423.
- [Thuan, Sauvage, & Madden(1999)] Thuan, T. X., Sauvage, M., & Madden, S. 1999, ApJ, 516, 783
- [Unger et al.(2000)] Unger, S. J. et al. 2000, A&A, 355, 885
- [van der Werf(1999)] van der Werf, P. P. 1999, ASP Conf. Ser. 156: Highly Redshifted Radio Lines, 91
- [Xu et al.(1998)] Xu, C. et al. 1998, ApJ, 508, 576