CI and CO in the spiral galaxies NGC 6946 and M 83
We present =2–1, =3–2, =4–3 12CO and 492 GHz [CI] maps as well as =2–1 and =3–2 13CO measurements of the late type spiral galaxies NGC 6946 and M 83 (NGC 5236). Both galaxies contain a pronounced molecular gas concentration in rapid solid-body rotation within a few hundred parsec from their nucleus. NGC 6946 and M 83 have nearly identical relative intensities in the 12CO, 13CO and [CI] transitions, but very different [CII] intensities, illustrating the need for caution in interpreting CO observations alone. The slow decrease of velocity-integrated 12CO intensities with increasing rotational level implies the presence of significant amounts of warm and dense molecular gas in both galaxy centers. Detailed modelling of the observed line ratios indicates that the molecular medium in both galaxies consists of at least two separate components. These are a warm and dense component ( = 30 – 60 K, ) and a much more tenuous hot component ( = 100 – 150 K, ). Total atomic carbon column densities exceed CO column densities by a factor of about 1.5 in NGC 6946 and about 4 in M 83. Unlike NGC 6946, M 83 contains a significant amount of molecular hydrogen associated with ionized carbon rather than CO. The centers of NGC 6946 and M 83 contain nearly identical total (atomic and molecular) gas masses of about 3 . Despite their prominence, the central gas concentrations in these galaxies represent only a few per cent of the stellar mass in the same volume. The peak face-on gas mass density is much higher in M 83 (120 M⊙ pc-2) than in NGC 6946 (45 M⊙ pc-2). The more intense starburst in M 83 is associated with a more compact and somewhat hotter PDR zone than the milder starburst in NGC 6946.
Key Words.:
Galaxies – individual (NGC 6946; M 83) – ISM – centers; Radio lines – galaxies; ISM – molecules1 Introduction
| M 83 | NGC 6946 | |
|---|---|---|
| Typea | SBc | Scd |
| Optical Centre: | ||
| R.A. (1950)b | 13h34m11.6s | 20h33m48.8s |
| Decl.(1950)b | -29∘36′42′′ | +59∘58′50′′ |
| Radio Centre : | ||
| R.A. (1950)c | 13h34m11.1s | 20h33m49.1s |
| Decl.(1950)c | -29∘36′34.9′′ | +59∘58′49′′ |
| 510 | 55 | |
| Distance | 3.5 Mpc | 5.5 Mpc |
| Inclination | 24∘ | 38∘ |
| Position angle | 45∘ | 60∘ |
| Luminosity | 1.2 LB⊙ | 3 LB⊙ |
| Scale | 59 ′′/kpc | 38 ′′/kpc |
Notes to Table 1:
a RSA (Sandage Tammann 1987);
b Dressel Condon (1976);Rumstay Kaufman 1983;
c Turner Ho 1994; van der Kruit et al. (1977);
d Tilanus Allen 1993; Handa et al. (1990); Carignan et al. (1990);
e Banks et al. 1999; Tully (1988);
Molecular gas is a major constituent of the interstellar medium in galaxies and the dominating component in regions of star formation and the inner disks of spiral galaxies. Within the inner kiloparsec, many spiral galaxies also exhibit a strong concentration of molecular gas towards their nucleus. It is generally thought that such concentrations are the result of angular momentum losses caused by e.g. encounters or mergers with other galaxies, or by bar-like potentials in the central part of the galaxy. However, in some cases, such as the Sb spiral galaxies M 31 and NGC 7331, most or all of the central gas may have originated from mass loss by evolved stars in the bulge (cf. Israel Baas 1999). In order to determine the physical condition of molecular gas in the centers of galaxies, and its amount, we have conducted a programme to observe a number of nearby galaxies in various CO transitions, as well as the 492 GHz 3P1–3P0 CI transition. Results for the Sc galaxy NGC 253 (Israel, White Baas 1995) and the Sb galaxy NGC 7331 (Israel Baas 1999) have already been published, as well as preliminary results on the Sc galaxy NGC 3628 (Israel, Baas Maloney 1990). In this paper, we present the results for the Sc galaxies NGC 6946 and M 83. Basic properties of these galaxies are summarized in Table 1.
Although a member of the NGC 6643 group, NGC 6946 (Arp 29) is relatively isolated. Its distance is variously estimated between 3 Mpc (Ables 1971) and 10 Mpc (Rogstad Shostak 1972; Sandage Tammann 1974); here we adopt = 5.5 Mpc (Tully 1988; McCall 1982). It has been relatively well-studied in the lower CO transitions. In fact, it was one of the first galaxies mapped in =1–0 CO at 65′′ resolution (Morris Lo 1978; Rickard Palmer 1981. Higher-resolution maps at 17–23′′ were published by Sofue et al. (1988) and Weliachew et al. (1988). At a similar resolution, disk spiral arm regions were observed in =1–0 and =2–1 CO by Casoli et al. (1990). The central region was also observed in the =3–2 and =4–3 CO transitions, again at similar resolutions (Wall et al. 1993; Mauersberger et al. 1999; Nieten et al. 1999). Using ISO, Valentijn et al. (1996) obtained a direct detection of warm towards the center of NGC 6946. Early high-resolution (about 6.5′′) =1–0 maps were obtained by Ball et al. (1985) and Ishizuki et al. (1990). Very good maps with a resolution of 3–4′′ can be found in Regan Vogel (1995) and Sakamoto et al. (1999). These maps show an elongated concentration of CO in the center, extending to the northwest with a position angle changing from 315∘ close to the nucleus to 0∘ at 15′′ from the nucleus. Similarly high-resolution maps of nuclear HCN emission by Helfer Blitz (1997) show only a compact source.


| Transition | Object | Date | Freq | Beam | t(int) | Map Parameters | |||||
| Size | Points | Size | Spacing | P.A. | |||||||
| (MM/YY) | (GHz) | (K) | () | (sec) | () | () | (∘) | ||||
| 12CO =2–1 | NGC 6946 | 02-06/89 | 230 | 1100 | 21 | 0.63 | 600 | 36 | 6060 | 10 | 0 |
| M 83 | 02-89 | 1295 | 0.63 | 600 | 49 | 70120 | 10 | 45 | |||
| 12CO =3–2 | NGC 6946 | 12/93 | 345 | 1270 | 14 | 0.53 | 400 | 40 | 5454 | 6 | 70 |
| M 83 | 04/91 | 1985 | 0.53 | 400 | 55 | 70100 | 10 | 45 | |||
| 04/93 | 765 | 0.53 | 300 | ||||||||
| 12/93 | 1335 | 0.53 | 1000 | ||||||||
| 12CO =4–3 | NGC 6946 | 11/94 | 461 | 8500 | 11 | 0.51 | 840 | 22 | 3030 | 6 | 70 |
| 07/96 | 2900 | 0.53 | 360 | ||||||||
| M 83 | 12/93 | 4360 | 0.51 | 400 | 20 | 3030 | 6 | 45 | |||
| 13CO =2–1 | NGC 6946 | 02-89 | 220 | 1000 | 21 | 0.63 | 2640 | 2 | |||
| 06-95 | 420 | 0.69 | 6330 | ||||||||
| 01-96 | 530 | 0.69 | 6000 | ||||||||
| M 83 | 02/05-89 | 1200 | 21 | 0.63 | 6840 | 3 | |||||
| 06-95 | 430 | 0.69 | 1200 | ||||||||
| 13CO =3–2 | NGC 6946 | 01-96 | 330 | 2020 | 14 | 0.58 | 6600 | 1 | |||
| M 83 | 06-00 | 644 | 0.62 | 2400 | 1 | ||||||
| CI 3P1–3P0 | NGC 6946 | 11-94 | 492 | 4710 | 10 | 0.43 | 1280 | 17 | 3024 | 6 | 70 |
| 07-96 | 3115 | 0.53 | 600 | ||||||||
| M 83 | 11-94 | 5000 | 0.43 | 800 | 14 | 1836 | 6 | 45 | |||
M 83 (NGC 5236) is likewise a large Sc galaxy. It is part of the Centaurus A group dominated by the giant elliptical NGC 5128 (the radio source Cen A) and containing the peculiar galaxies NGC 4945 and NGC 5253 among others. All main group members have disturbed morphologies suggesting recent interactions or mergers. The group contains a large number of dwarf galaxies (Banks et al. 1999). For M 83, we adopt the group distance = 3.5 Mpc (cf. Israel 1998; Banks et al. 1999). Presumably because of its southern declination, M 83 has not been studied nearly as well as NGC 6946 at (sub)millimeter wavelengths. Early, relatively low-resolution =1–0 CO measurements were obtained by Rickard et al. (1977), Combes et al. (1978) and Lord et al. (1987). At a higher resolution of 16′′, a =1–0 CO map was published by Handa et al. 1990, showing a compact central concentration superposed on a ‘ridge’ of CO extending over 2′ in a 45∘ counterclockwise position angle. Measurements of the =2–1 and =3–2 transitions of and at 22′′ resolution were analyzed by Wall et al. (1993), whereas Petitpas Wilson (1998) reported on =3–2 and =4–3 CO and 492 GHz CI maps at similar resolutions. High-resolution aperture synthesis maps have been published for M 83 in 1–0 CO both at the center (Handa et al. 1994) and at spiral arm disk positions (Kenney Lord 1991; Lord Kenney 1991; Rand, Lord Higdon 1999) as well as in HCN (Helfer Blitz 1997; Paglione, Jackson Ishizuki 1997) – the center maps showing a compact, slightly extended source.
2 Observations
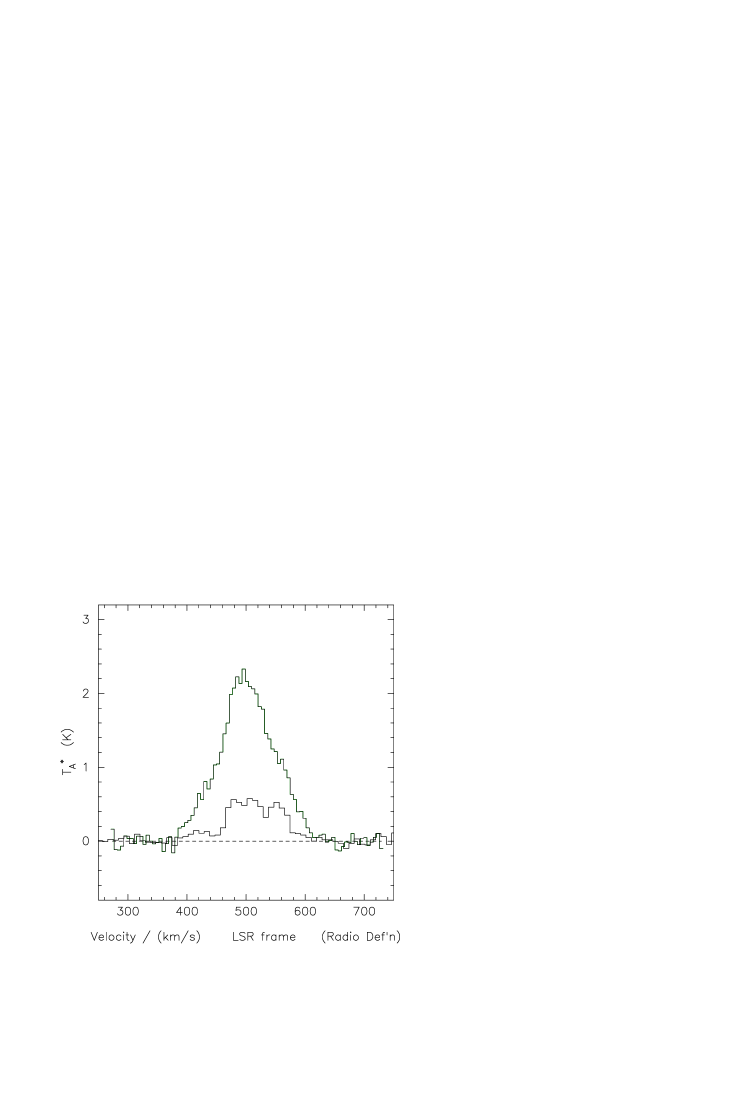
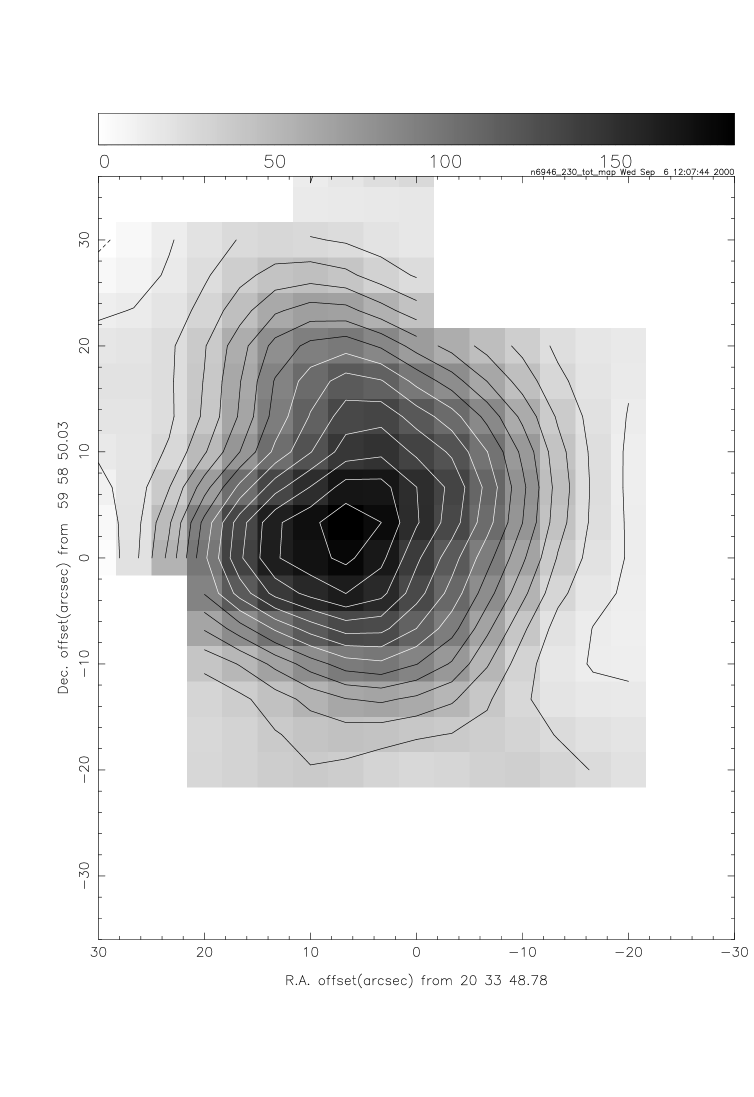
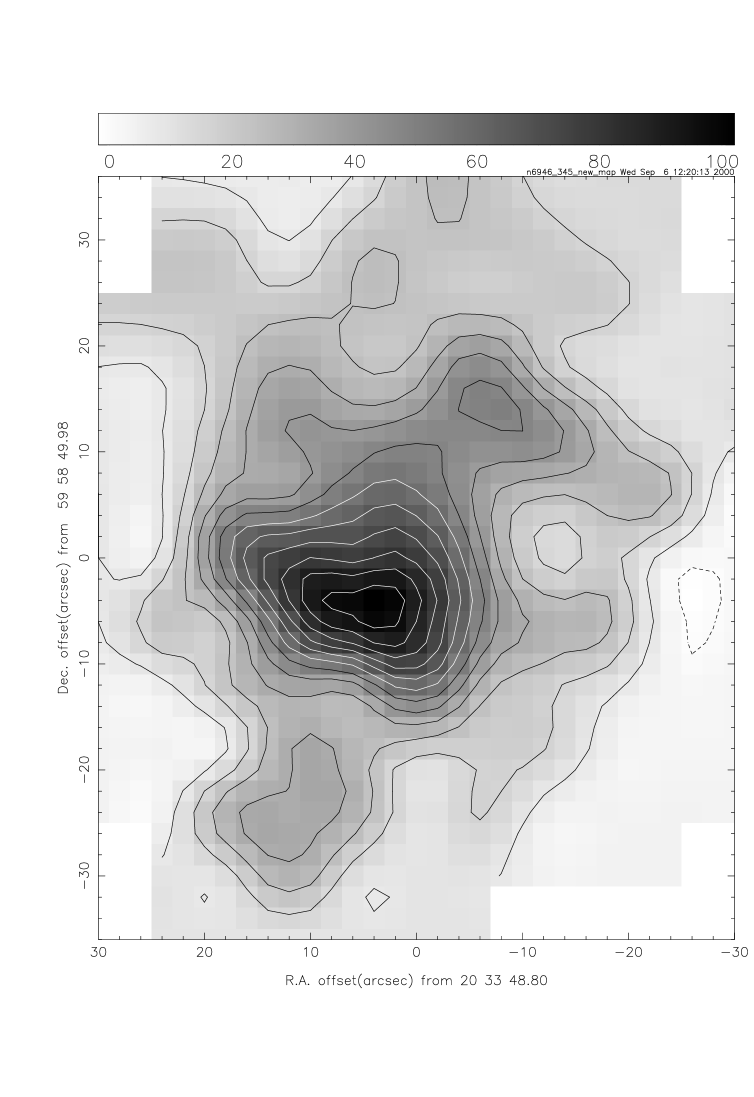
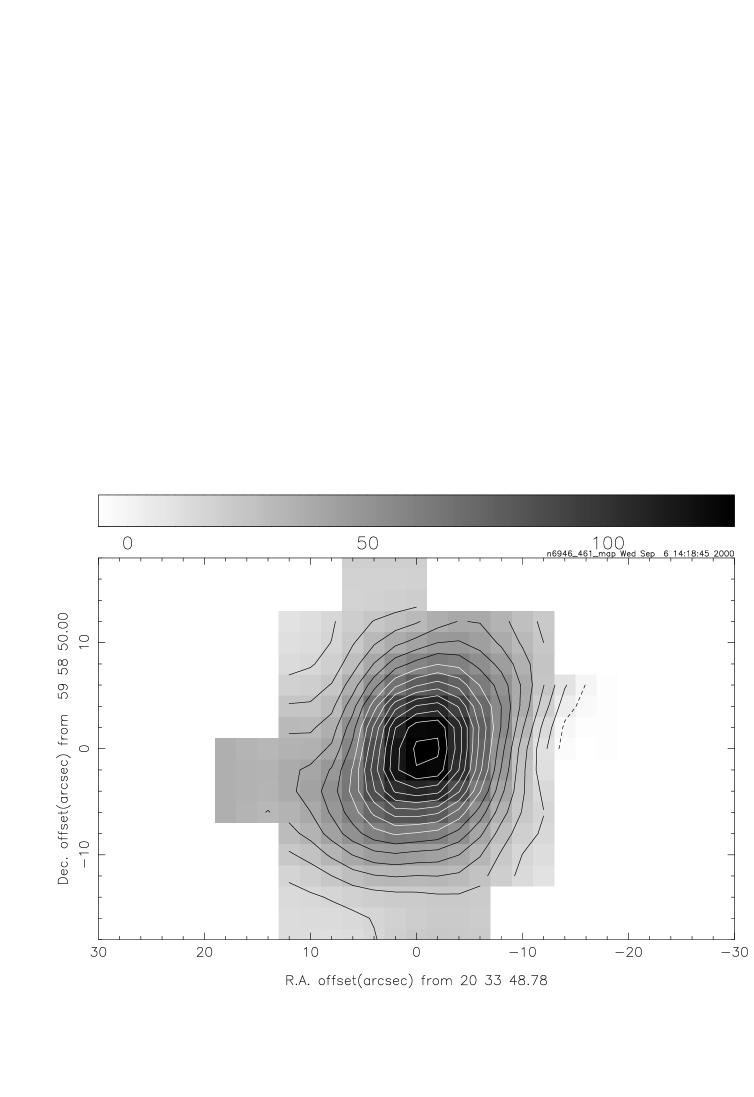
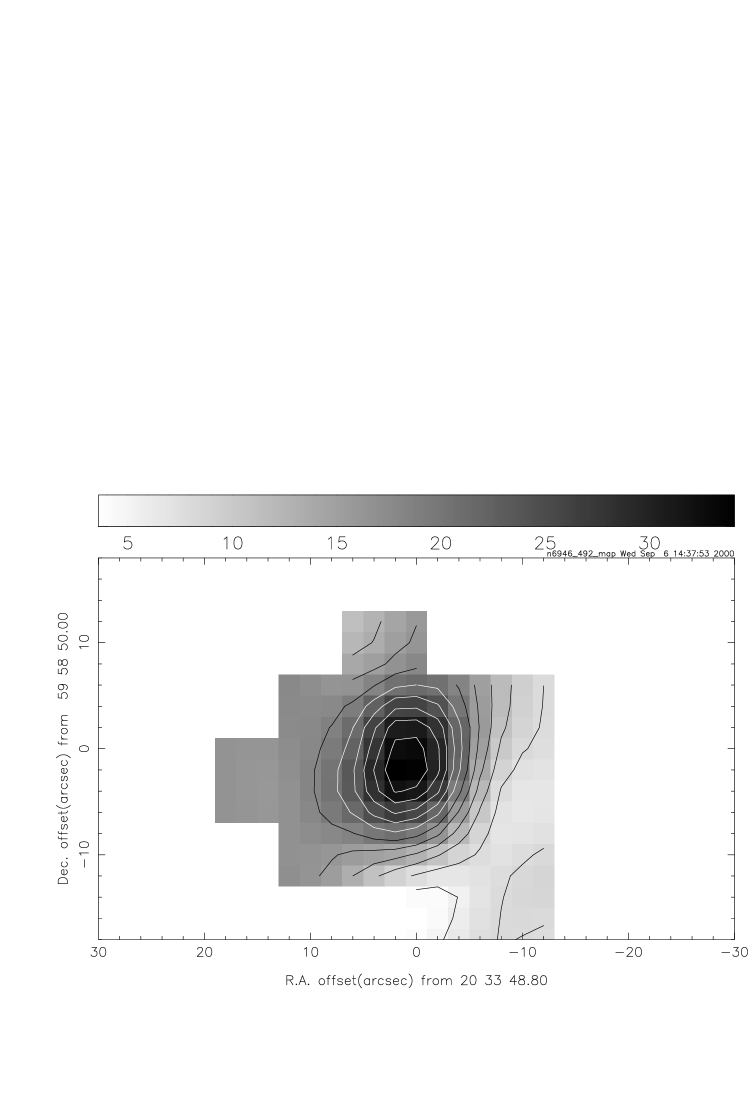
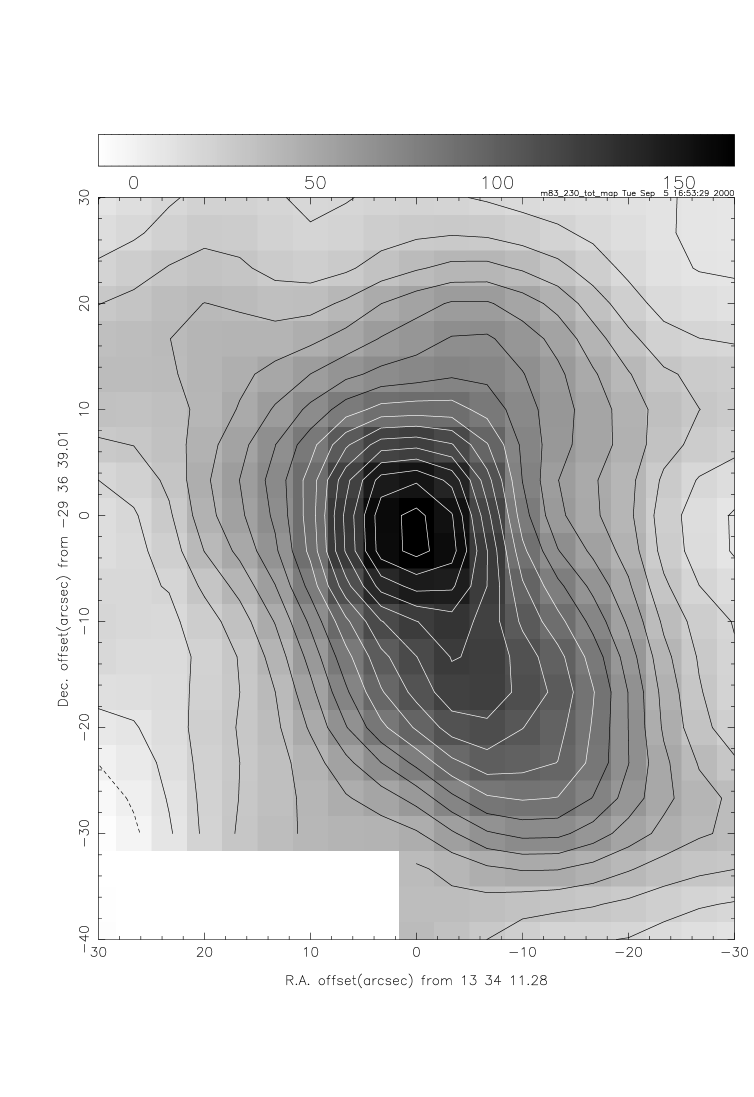
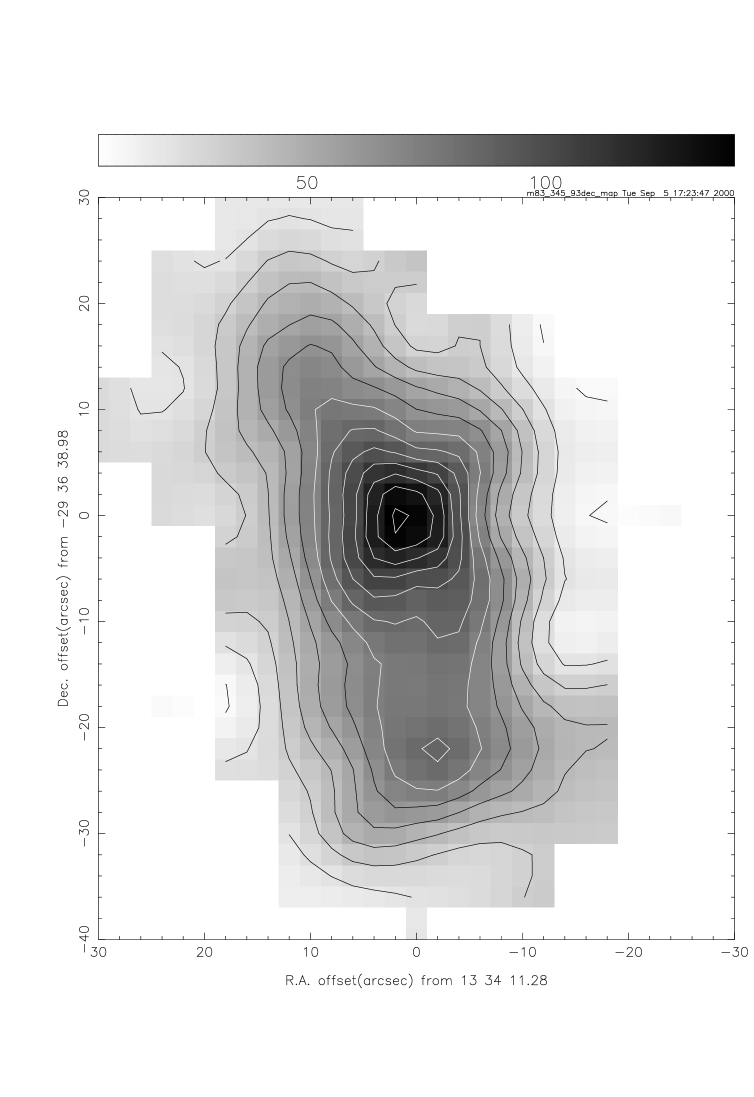
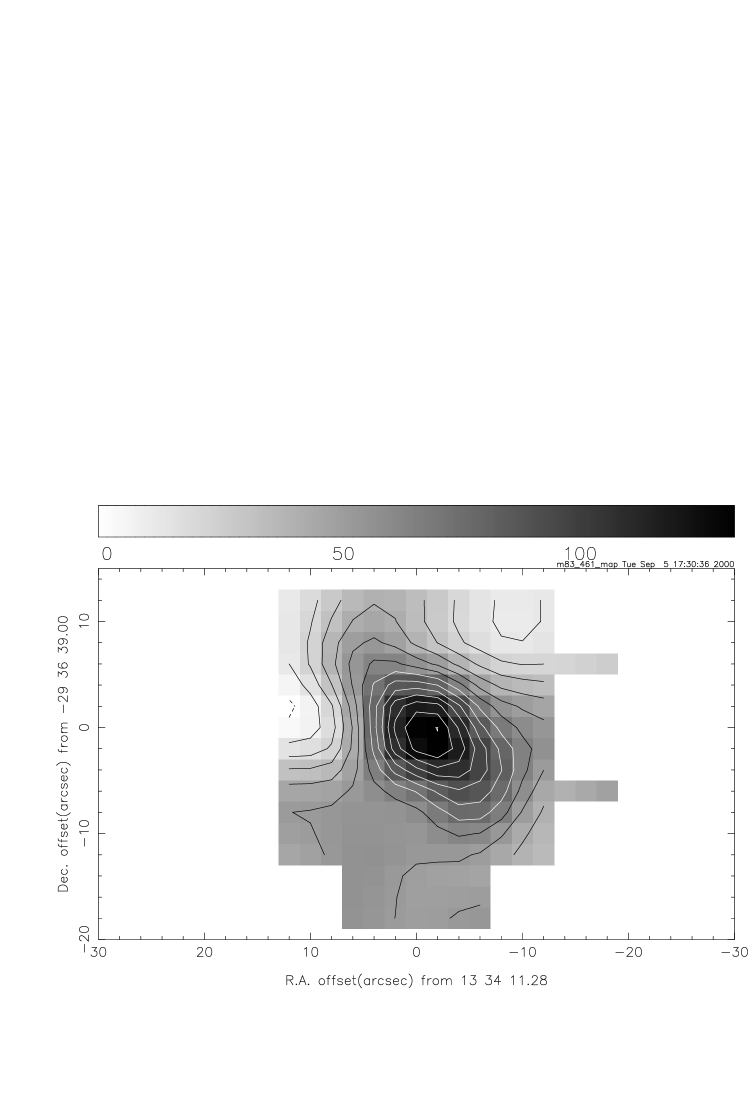
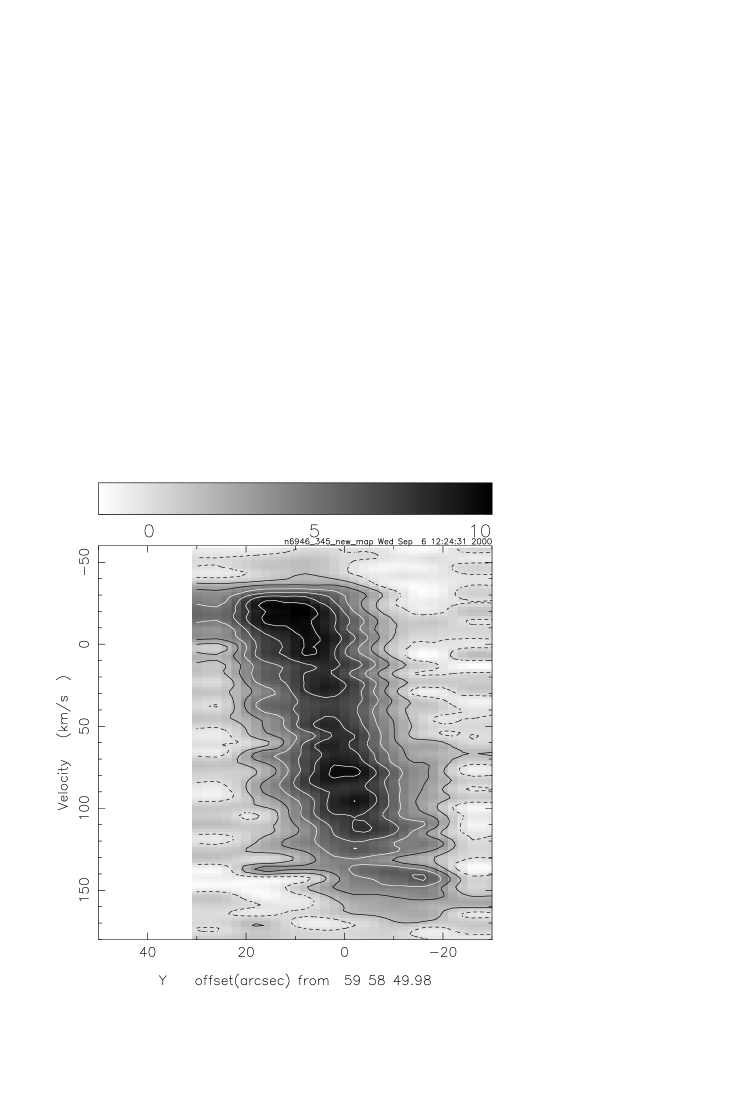
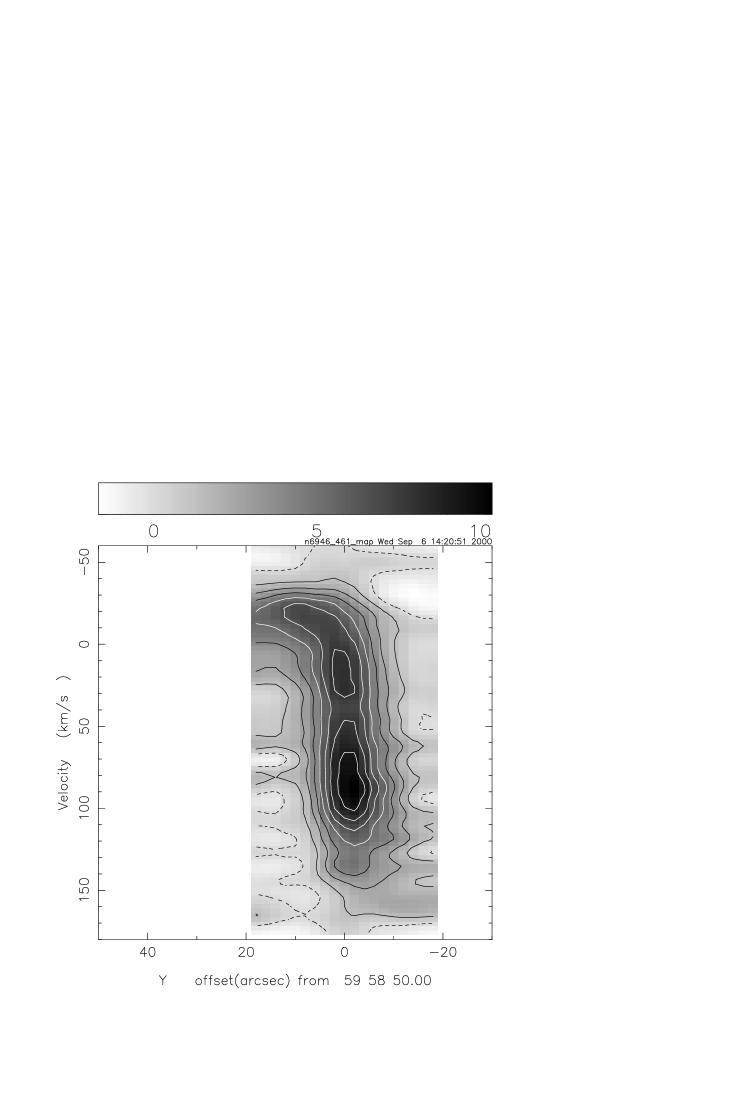
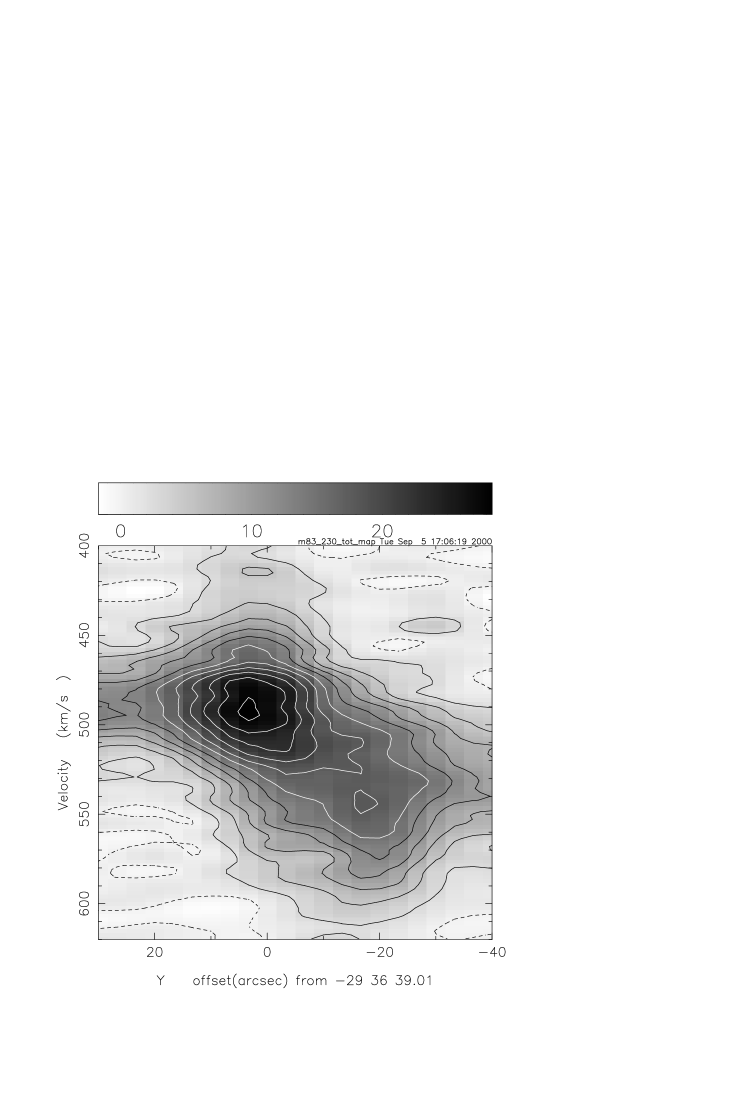
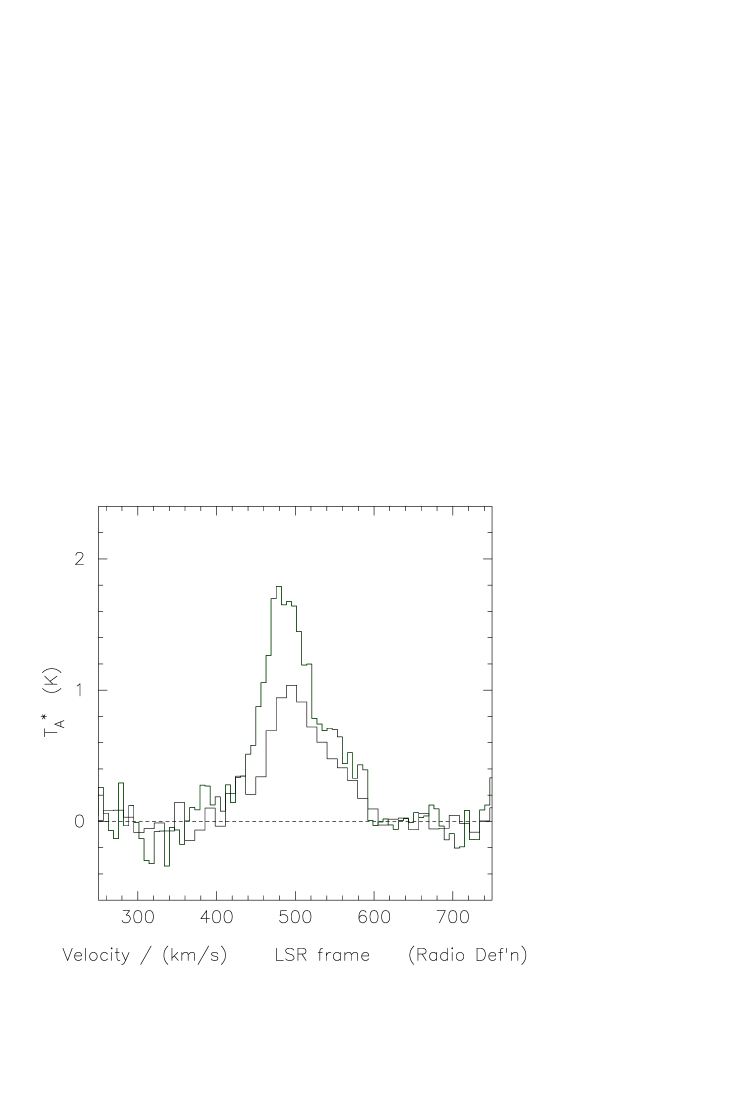
All observations described in this paper were carried out with the 15m James Clerk Maxwell Telescope (JCMT) on Mauna Kea (Hawaii) 111The James Clerk Maxwell Telescope is operated on a joint basis between the United Kingdom Particle Physics and Astrophysics Council (PPARC), the Netherlands Organisation for Scientific Research (NWO) and the National Research Council of Canada (NRC).. Details are given in Table 2. Up to 1993, we used a 2048 channel AOS backend covering a band of 500 MHz ( at 230 GHz). After that year, the DAS digital autocorrelator system was used in bands of 500 and 750 MHz. Integration times given in Table 2 are typical values used in mapping; central positions were usually observed more than once and thus generally have significantly longer integration times. Values listed are on+off. When sufficient free baseline was available, we subtracted second order baselines from the profiles. In all other cases, linear baseline corrections were applied. All spectra were scaled to a main-beam brightness temperature, = /; relevant values for are given in Table 2. Spectra of the central positions in both galaxies are shown in Fig. 1 and summarized in Table 3. In Table 2, we have also listed the parameters describing the various maps obtained. All maps are close to fully sampled with the exception of the =3–2 CO map of NGC 6946 where we sampled the outer parts every other grid point only. In all maps except the =2–1 CO map of NGC 6946, the mapping grid was rotated by the angle given in Table 2 so that the Y axis coincided with the galaxy major axis. The velocity-integrated maps shown in Figs. 2 and 3 have been rotated back, so that north is (again) at top and the coordinates are right ascension and declination. As a consequence of the interpolation involved in the rotation, the maps are shown at a resolution degraded by 5–10. For NGC 6946, the map grid origin is identical to the optical centre listed in Table 1. The radio centre occurs in the maps at offsets , = +2′′, -1′′; this is to all practical purposes within the pointing error. For M 83, the grid origin is at 13h34m11.3s, -29∘36′39′′, roughly halfway between the optical and radio centres, which occur in the maps at , = +4′′, -3′′ and -3′′, +4′′ respectively.
| NGC 6946 | M 83 | |||||||
| Transition | Resolution | a | d | b | a | d | b | |
| () | (mK) | () | kpc2 | (mK) | () | kpc2 | ||
| =2–1 | 12CO | 21 | 1384 | 22220 | 124 | 2540 | 26115 | 55 |
| =3–2 | 12CO | 14 | 1428 | 20925 | 56 | 2176 | 26215 | 38 |
| 21 | 14515 | 16715 | ||||||
| =4–3 | 12CO | 11 | 1798 | 21620 | 33 | 2669 | 27020 | 21 |
| 14 | 17017 | 18920 | ||||||
| 21 | 11211 | 12215 | ||||||
| =2–1 | 13CO | 21 | 141 | 22.23 | 247 | 28.53 | ||
| =3–2 | 13CO | 14 | 105 | 11.42 | 194 | 22.31 | ||
| 3P1–3P0 | CI | 10 | 465 | 859 | 7.2 | 685 | 8314 | 4.4 |
| 14 | 6010 | 7510 | ||||||
| 21 | 448 | 558 | ||||||
Notes to Table 3: a. Beam centered on nucleus; b. Total central concentration
| Transitions | NGC 6946 | M 83 | |||||
|---|---|---|---|---|---|---|---|
| Nucleus | Total Center | +10′′, +10′′ | Nucleus | Total Center | +7′′, -7′′ | -14′′, -14′′ | |
| (1–0)/(2–1)a | 1.10.2 | 0.95 | 1.0 | 0.90.2 | 1.1 | — | — |
| (3–2)/(2–1)b | 0.650.10 | 0.5 | 0.5 | 0.650.13 | 0.7 | 0.8 | 0.5: |
| (4–3)/(2–1)b | 0.450.15 | 0.3 | 0.4: | 0.480.10 | 0.4 | 0.6 | — |
| / (1–0)c | 11.81.3 | — | — | 10.41.6 | — | — | — |
| / (2–1)b | 9.81.5 | — | 15 | 9.21.0 | — | 11 | 9 |
| / (3–2)d | 13.01.4 | — | — | 11.81.1 | — | — | — |
| CI/CO(2–1)b | 0.200.04 | 0.06 | — | 0.180.04 | 0.07 | 0.2: | — |
| CII/CO(2–1)e | 0.08 | 0.55 | |||||
Notes: a. From =1–0 data by Weliachew et al. (1988), Sofue et al. (1988), Wild (1990); Handa et al. (1990) and Israel et al. (unpublished); b. This Paper, JCMT at 21′′ resolution; c. Sage Isbell (1991); NRAO 12m at 57′′ resolution; Young Sanders (1986); FCRAO at 45′′ resolution; Israel et al (unpublished); SEST at 43′′ resolution; Rickard Blitz (1985); NRAO at 65′′ resolution; d. This Paper; JCMT at 14′′ resolution. e. From Crawford et al. (1985) and Stacey et al. (1991), KAO at 55′′ resolution.

3 Results
3.1 CO distribution
In both galaxies, there is a strong concentration of molecular material in the central region. The central source, although not dominating the total CO emission from the galaxy, is nevertheless a major feature compared with the minor peaks occurring in the disk (see the NGC 6946 CO maps by Casoli et al. 1990 and Sauty et al. 1998, as well as the M 83 interferometer map by Rand et al. 1999). A similar impression is provided by the SCUBA 850m continuum map of NGC 6946 (Bianchi et al. 2000), although the continuum image of the central source in particular is seriously contaminated by =3–2 CO line emission.
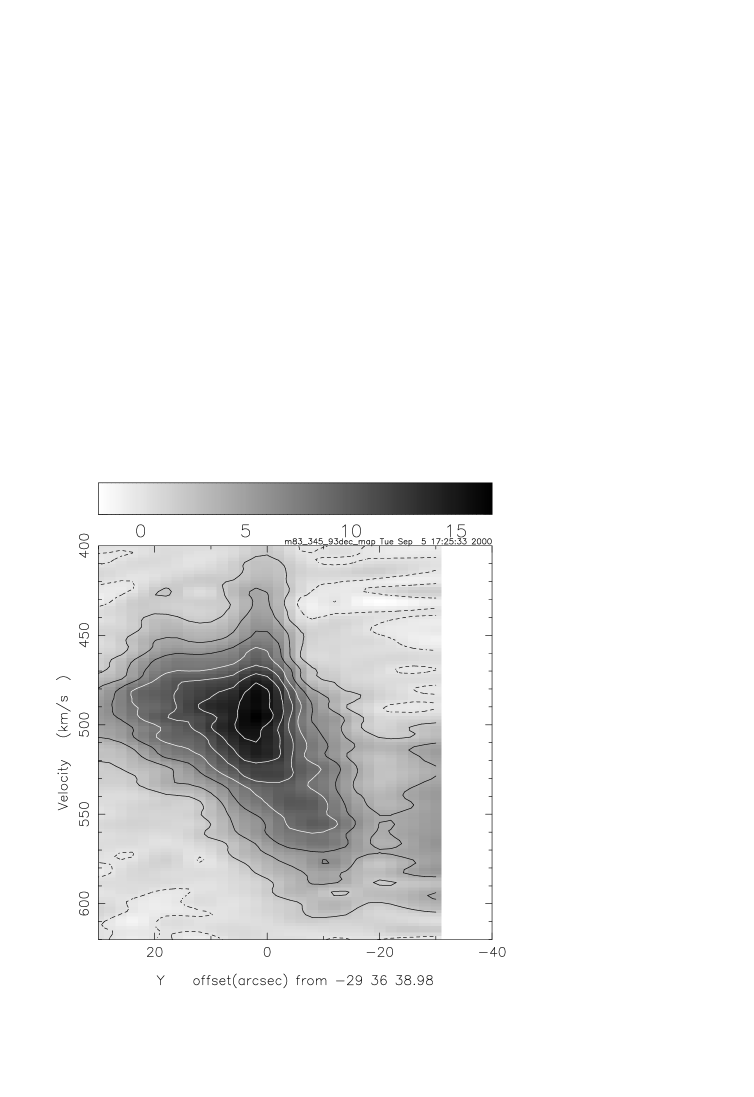
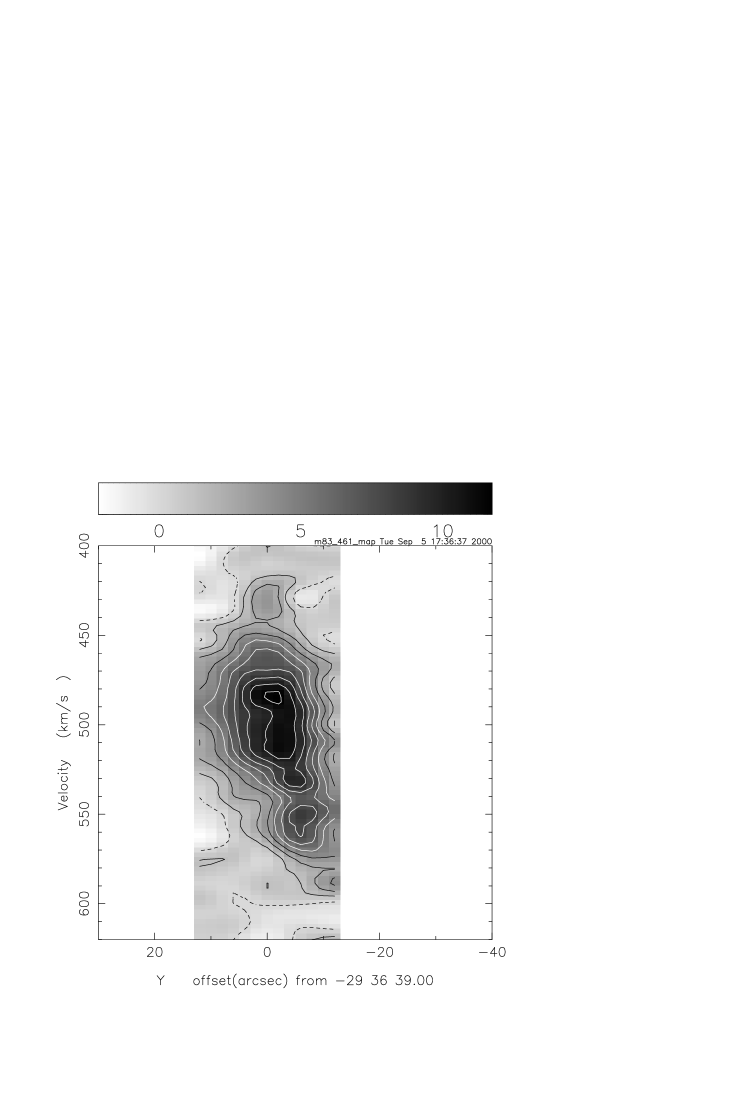
In NGC 6946, the strong central CO emission is highly structured, as revealed in the =1–0 interferometer map by Regan Vogel (1995), and also partly in our lower-resolution maps in Fig. 2, in particular in the =3–2 map, which shows close resemblance to their =1–0 map. The central region of NGC 6946 has very similar CO and optical morphologies (Regan Vogel 1995, see also Ables 1971). The maps show strong centralized emission superposed on more extended emission of lower surface brightness. The overall extent of the central CO source in NGC 6946 is about . Most of the extended emission occurs roughly along the minor axis of the galaxy and appears to be due to enhanced CO emission from spiral arm segments (cf. Regan Vogel 1995) out to about = 1 kpc in the plane of the galaxy. In addition to these minor axis extensions, there are also extensions along the major axis, particularly in the ENE direction. The bright central peak is especially prominent in the =4–3 CO and [CI] maps, its increased contrast in these maps being caused mainly by higher resolution and higher excitation (see below). The source extent of about 10′′ in these maps is consistent with the =1–0 CO scale length = 160 pc derived by Sakamoto et al. (1999). This compact source has also been detected and mapped interferometrically in =1–0 HCN (Helfer Blitz 1997). Evidence for further, unresolved structure is provided by the central emission profiles in Fig. 1 and the major axis position-velocity maps in Fig. 4. They show a clear double-peaked structure in all transitions with a minimum at about = +45 suggesting a deficit of material (a ‘hole’) at the very center of NGC 6946. The position-velocity maps show a steep central velocity gradient, undiscernible from rapid solid-body rotation, with steepness apparently increasing with increasing number. The significantly lesser steepness in e.g. the =2–1 CO map is caused by beamsmearing. This is readily seen from a comparison of the =4–3 CO (Fig. 4) and the high-resolution =1–0 CO (Fig. 4 in Sakamoto et al. 1999) velocity gradients which are practically identical with d/d = 35 /′′ (in the plane of the galaxy corresponding to d/d 2 /pc). From this gradient and the velocity separation of the central profile peaks in Fig. 1, we estimate the size of the ‘hole’ in the disk to be of the order of 2′′ ( = 25 pc). The steep rotation curve turns over to a much flatter one at a radius of about = 200 pc.
The structure of the central CO source in M 83 is, at least with the presently available data, much simpler. A central peak resolved only at resolutions 15′′ is superposed on a more extended ridge along the major axis seen in the =3–2, =2–1 and =1–0 CO maps (Fig. 3; see also Handa et al. 1990) with dimensions . The ridge thus extends outwards to a radius of about = 1 kpc, so that the overall sizes of the central CO source in M 83 and NGC 6946 are very similar. The ridge shows some structure, perhaps including two symmetrical secondary maxima each at about = 325 pc from the nucleus. In the =4–3 CO and [CI] maps (Fig. 3), the central peak is just resolved along the major axis, extending to a radius = 135 pc from the nucleus. Along the minor axis, it is unresolved. As is the case with NGC 6946, the contrast of the peak with its surroundings is higher than that in lower transitions, at least in part because of higher resolution. Compact, barely resolved emission from the peak is also seen in the =1–0 HCN transition interferometrically mapped by Helfer Blitz (1997). The central emission profiles (Fig. 1 bottom) of M 83 do not resemble those of NGC 6946. They are clearly non-gaussian, but instead of a double-peaked shape, they are perhaps best described as a slightly asymmetric blend of a broad and a narrow component.
The position-velocity maps in Fig. 5 are quite interesting. A compact component in very rapid solid-body rotation is shown superposed on more extended emission in much more sedate rotation. The effect of beamsmearing is particularly noticeable in the apparently much greater extent of the rapidly rotating component in the lower maps (for =1–0 CO, see Handa et al. 1990). From the =4–3 CO map in Fig. 5, we find that the rapidly rotating disk is contained with = 95 pc from the nucleus, and that it has a velocity gradient d/d = 18 /′′, corresponding to d/d = 2.7 /pc in the plane of the galaxy. The more extended material has a velocity gradient d/d = 0.6 /′′, corresponding to only d/d = 85 /kpc in the plane of the galaxy. The =4–3 CO and [CI] maps suggest that the rapidly rotating material is a relatively thin disk. Our results do not provide any evidence for the presence of the small central hole that may be surmised from the aperture synthesis observations by Handa et al. (1994). The JCMT =3–2, =4–3 and [CI] maps published by Petitpas Wilson (1997) show a clear double-peaked structure, the peaks being separated by some 16′′. Our =3–2 and =4–3 CO maps do not reproduce the structure seen by Petitpas Wilson (1997). In particular they do not show the secondary peak which should occur at = +4′′, -9′′ in our maps; that position is not fully covered by either [CI] map. Signal-to-noise ratio considerations, the poor baselines encountered by Petitpas Wilson (1997) in the their =3–2 observations and the limited extent (about one beamwidth) of the secondary peak lead us to question its prominence and perhaps even its existence.
3.2 Line ratios
From our observations, we have determined the intensity ratio of the observed transitions at various positions in both galaxies. For convenience, we have normalized all intensities to that of the =2–1 line. All 12CO ratios given for individual positions refer to a beam of 21′′; where necessary we convolved higher-resolution observations to this beamsize to obtain an accurate ratio not susceptible to varying degrees of beam dilution. Isotopic 12CO/13CO ratios are given for the resolutions listed in the Table. The individual positions include, in addition to the nuclear positions of both galaxies, an offset position in NGC 6946 representing the off-nucleus CO cloud complex discussed in sect. 4.3, and two offset positions in M 83 on the major and minor axis respectively. The =1–0/=2–1 ratios have relatively large uncertainties, because we have used =1–0 intensities estimated for a 21′′ beam from the references given in the table. These ratios are, in any case, close to unity.
In contrast, the columns in Table 4 marked Total Center refer to the intensities integrated over total source extent as shown in the maps. At the lower frequencies, source extents are larger than at the higher frequencies. This is mostly caused by limited and frequency-dependent resolution. When corrected for finite beamwidth, source dimensions at e.g. the =2–1 and =4–3 transitions are very similar for NGC 6946 and the bright peak of M 83. Nevertheless, the smaller area coverage at the higher frequencies may lead to an underestimate of the intensities of the emission at these frequencies and consequently the corresponding line ratios especially if extended emission of relatively low surface brightness is present. The entries in Table 4 suggest that this may indeed be the case for =4–3 CO and [CI].
We have converted the [CII] intensities measured by Crawford et al. (1985) and Stacey et al. (1991) to velocity-integrated temperatures. The line ratios given in Table 4 were obtained after convolving our =2–1 CO results to the same beam solid angle of 8.6 10-8 sr (HPBW 55′′) that was used to measure the [CII].
It is quite remarkable that NGC 6946 and M 83 are extremely similar in all ratios (and indeed intensities), except for the [CII] intensity. From the observed CO transitions only it is easily but mistakenly concluded that the two galaxies have identical ISM properties in their center. As it is, the intensity of the [CII] line suggests a much stronger PDR effect in M 83 than in NGC 6946, implying the presence of both high gas temperatures and densities in the medium as the critical values for this transition are 91 K and . At the same time, such values must be reconciled with the much lower temperatures and (column) densities implied by the modest CO isotopic ratios.
4 Analysis
4.1 Modelling
| Model | Component 1 | Component 2 | Ratioa | Line Ratios | |||||
|---|---|---|---|---|---|---|---|---|---|
| ) | /d | ) | /d | Comp. | |||||
| (K) | () | () | (K) | ( | () | 1:2 | |||
| NGC 6946 | |||||||||
| 1 | 30 | 1000 | 10 | 150 | 1000 | 0.3 | 1:9 | 1.22 0.69 0.40 | 11 9.9 13 |
| 2 | 60 | 1000 | 1 | 30 | 10 000 | 0.6 | 6:4 | 1.12 0.73 0.41 | 11 10.0 13 |
| 3 | 150 | 500 | 1 | 30 | 10 000 | 0.6 | 8:2 | 1.18 0.73 0.44 | 11 9.8 13 |
| 4 | 100 | 1000 | 1 | — | — | — | — | 1.33 0.73 0.44 | 12 9.3 13 |
| M 83 | |||||||||
| 5 | 30 | 3000 | 1 | 100 | 3000 | 0.06 | 4:6 | 0.93 0.73 0.40 | 11 8.9 12 |
| 6 | 60 | 1000 | 1 | 60 | 100000 | 1 | 9:1 | 1.14 0.76 0.49 | 10 9.5 12 |
| 7 | 150 | 500 | 3 | 60 | 3000 | 0.6 | 3:7 | 1.13 0.77 0.51 | 10 9.0 12 |
| 8 | 100 | 1000 | 1 | — | — | — | — | 1.33 0.73 0.44 | 12 9.3 13 |
Notes a Ratio denotes the relative contributions of the two
components to the observed emission in the =2–1 line.
b Model-calculated intensities of the
=1–0, =3–2 and =4–3 transitions normalized to
the =2–1 intensity.
c intensity ratios in the =1–0, =2–1 and
=3–2 transitions.
| Model | Beam-Averaged Column Densities | Total Central Mass | Face-on Mass Density | ||||
| () | () | ( M⊙) | (M⊙/pc-2) | ||||
| NGC 6946; = 2500; | |||||||
| 1 | 1.5 | 0.9 | 2.4 | 2.1 | 3.6 | 29 | 51 |
| 2 | 0.7 | 1.3 | 2.1 | 1.8 | 3.3 | 26 | 45 |
| 3 | 0.9 | 1.2 | 2.0 | 1.8 | 3.2 | 25 | 45 |
| 4 | 0.8 | 1.1 | 1.7 | 1.5 | 2.8 | 21 | 39 |
| M 83; = 2500; | |||||||
| 5 | 0.8 | 3.9 | 5.5 | 1.8 | 2.6 | 80 | 114 |
| 6 | 1.0 | 4.3 | 6.3 | 2.4 | 3.4 | 92 | 130 |
| 7 | 1.1 | 3.7 | 5.7 | 2.1 | 3.0 | 83 | 118 |
| 8 | 0.9 | 8.2 | 11.0 | 3.7 | 5.1 | 159 | 221 |
Notes: a. Boulanger Viallefond (1992); b. Rogstad et al. (1974); Tilanus Allen (1993)
The observed and line intensities and ratios can be modelled by radiative transfer models such as described by Jansen (1995) and Jansen et al. (1994). The models provide line intensities as a function of three input parameters: gas kinetic temperature , molecular hydrogen density and CO column density per unit velocity (/d). By comparing model line ratios to the observed ratios we may identify the physical parameters best describing the actual conditions in the observed source. The additional filling factor is found by comparing model intensities to those observed. If and have the same beam filling factor, a single component fit requires determination of five independent observables. As we have measured seven line intensities, such a fit is, in principle, overdetermined. In practice, this is not quite the case because of significant finite errors in observed intensities, and because of various degrees of degeneracy in the model line ratios. We found that a single-component fit could be made to the data of the two galaxies only if we allow CO =1–0 intensities to be rather higher than observed. As we also consider a single temperature, single density gas to be physically implausible for the large volumes sampled, we reject such a fit.
It is much more probable that the large linear beams used sample molecular gas with a range of temperatures and densities. We approximate such a situation by assuming the presence of two independent components. As this already doubles the number of parameters to be determined to ten, a physically realistic more complex analysis is not possible. In our analysis, we assume identical CO isotopical abundances for both components, and by assuming a specific value (i.e. [12CO]/[13CO] = 40, cf. Mauersberger Henkel 1993) reduce the number of parameters to eight. This leaves a single free parameter, for which we take the relative contribution (filling factor) of the two components in the emission from the =2–1 line. Acceptable fits are then identified by searching a grid of model parameter combinations (10 K 250 K, , ; relative emission contributions 0.1 to 0.9) for sets of line ratios matching the observed set.
The CO line ratios observed for NGC 6946 and M 83 can be fit by various combinations of gas parameters or rather various regions in gas parameter space. We have rejected from further consideration all solutions where the denser component is also required to be the hotter, as we consider this to be physically unlikely on the scales observed. Although the various line ratios are very similar, in particular the isotope ratios for M 83 appear to be systematically somewhat lower than for NGC 6946. For this reason, and also in order to demonstrate the possible variation in model parameters, we have listed characteristic solutions for both galaxies separately. The quality of each solution can be judged by comparing the calculated model line ratios in Table 5 with those observed in Table 4. The single-component fit is included for comparison. The densest and coolest component has a fairly well-determined density of 3000 and an even better determined column density /d = 6-10 irrespective of density. The low-density component () must have higher column densities /d = 1–10 but its precise temperature is difficult to determine as long as the relative emission ratios of the components are a free parameter.
The observed C∘ and C+ intensities are modelled with the same radiative transfer model. For both we assume the CO-derived, two-component solutions to be valid as far as kinetic temperatures, densities and filling factors are concerned. We may then solve for C∘ and C+ column densities. The column density of the hotter component is usually well-determined, but that of the cooler component is more or less degenerate. Rather than a single solution, a range of possible column density solutions is found. These are constrained by requiring similar velocity dispersions (of about 3–5 km s-1) for both hot and cold components and by requiring the resulting total carbon column densities to be consistent with the chemical model solutions presented by Van Dishoeck Black (1988). These models show a strong dependence of the column density ratio on total carbon and molecular hydrogen column densities.
The very strong [CII] intensity observed in M 83 exceeds that expected from the CO-derived solutions. It thus implies the presence of ionized carbon in high-density molecular volumes poorly represented by CO emission. Consequently, in Model 6 (Table 5) we ascribed essentially all [CII] emission to a gas with density at temperature = 60 K whereas in Model 7 we assumed at = 150 K.
In order to relate total carbon (i.e. C + CO) column densities to those of molecular hydrogen, we have estimated [C]/[H] gas-phase abundance ratios from [O]/[H] abundances. Both galaxies have virtually identical central abundances [O]/[H] = 1.75 10-3 Zaritsky et al. 1994; Garnett et al. 1997). Using results given by Garnett et al. (1999), notably their Figs. 4 and 6, we then estimate carbon abundances [C]/[H] = 1.450.5 10-3. As a significant fraction of all carbon will be tied up in dust particles, and not be available in the gas-phase, we adopt a fractional correction factor = 0.27 (see for instance van Dishoeck Black 1988), so that = [2 + ] 2500 [ + ] with a factor of two uncertainty in the numerical factor.
The results of our model calculations are given in Table 6, which presents beam-averaged column densities for both CO and C (Co and C+) and the column densities derived from these. Table 6 also lists the total mass estimated to be present in the central molecular concentration ( pc) obtained by scaling the column densities with the =2–1 d ratio from Table 3, and the face-on mass densities implied by hydrogen column density and the galaxy inclination. Beam-averaged neutral carbon to carbon monoxide column density ratios are for both NGC 6946 and M 83, somewhat higher than the values 0.2–0.5 found for M 82, NGC 253 and M 83 (White et al. 1994; Israel et al. 1995; Stutzki et al. 1997; Petitpas Wilson 1998).
4.2 The center of NGC 6946
Notwithstanding the significant differences between the model parameters, the hydrogen column densities, masses and mass-densities derived in Table 6 are very similar. The [CI] and [CII] line and the far-infrared continuum (Smith Harvey 1996) intensities suggest that they predominantly arise in a medium of density close to subject to a radiation field log = 1 – 1.5 (cf. Kaufman et al. 1999). Emission from the molecules CS, H2CO and HCN has been detected from the CO peaks in Fig. 2 (Mauersberger et al. 1989; Hüttemeister et al. 1997; Paglione et al. 1995; 1997); their intensities likewise indicate a density which is only provided by models 2 and 3 which we consider to be preferable. Note that the single-component CO fit (model 4), which we have already rejected, also does not fit the Co and C+ intensities predicted by the PDR models (Kaufman et al. 1999). The high-density component probably corresponds to the molecular cloud complexes that are the location of the present, mild starburst in the center of NGC 6946 (Telesco et al. 1993; Engelbracht et al. 1996). It represents about a third of the total molecular mass, and contributes a similar fraction to the observed =2–1 CO emission. The low-density component has a temperature in the range = 60 – 150 K, and a density of order . This is conformed by a reanalysis of the midinfrared measurements by Valentijn et al. (1996). The =2–0 S(0) line intensity at 28 m is entirely consistent with these values for an ortho/para ratio of two (P.P. van der Werf, private communication). However, in order to also match the observed =3–1 S(1) line strength at 17 m, a small amount of high-temperature molecular gas with need be present as well, but with a mass no more than a few per cent of the mass given in Table 6. Our measurements are insensitive to such a component.
We thus conclude that the total mass of molecular gas within = 0.5 kpc from the nucleus of NGC 6946 is 183 million solar masses; this is about 1.5 per cent of the dynamical mass, so that the total mass of the inner part of the galaxy must be completely dominated by stars. No more than a quarter of all hydrogen is HI; most is in the form of . Between 15 and 25 of all hydrogen is associated with ionized carbon and almost equal amounts with neutral carbon and CO. Madden et al. (1993) reach very similar conclusions from C+ mapping of NGC 6946, but find different masses. Part of this difference arises in our use of two components rather than a single component. Another important difference between this and other studies is our use of the gas-phase carbon abundance rather than an assumed conversion factor to obtain hydrogen column densities and masses. For NGC 6946, this results in effective conversion factors of the order of = 1 1019 mol /, which is more than an order of magnitude lower than traditionally assumed values. The difference greatly exceeds the uncertainty of a factor of two or three associated with the carbon abundance, illustrating the danger of using ‘standard’ conversion factors in centers of galaxies where conditions may be very different (higher metallicities, higher temperatures) from those in galaxy disks.
The observed CO temperatures are typically a factor of 15 lower than the model brightness temperatures, implying that only a small fraction of the observing beam is filled by emitting material. We find small beam-filling factors for the molecular material of order 0.06 – not very dependent on choice of model. However, velocity-integrated intensities are a factor of two or three higher than that of a model cloud, implying that the average line of sight through NGC 6946 contains two or three clouds at various velocities.
4.3 A GMC in the bulge of NGC 6946

The eastern extension seen in our =3–2 and =2–1 maps is caused by a discrete cloud at = +12′′, +6′′. At this position, CO profiles show a strong, relatively narrow spike asymmetrically superposed on the weaker broad profile from the more extended emission (Fig. 6). This spike can also be discerned in =1–0 CO profiles published by Sofue et al. (1988) and in the =3–2 and =4–3 CO profiles by Nieten et al. (1999). By subtracting the broad emission, we have attempted to determine the parameters of this cloud. We find a deconvolved size of about 400 pc along the major axis and 160 pc (i.e. 260 pc deprojected) along the minor axis. Its deprojected distance to the nucleus is about 350 pc. Peak emission occurs at = -20 , and the linewidth is V(FWHM) = 30 km/s. These results suggest that the object is a molecular cloud complex in the bulge of NGC 6946, comparable to the Sgr B2 complex in the Milky Way. Although the subtraction procedure is not accurate enough to obtain good line ratios, these do not appear to be very different from those of the major central concentration. They indicate a total mass M⊙ for the complex. Most of this mass should be at a kinetic temperature of about 10 K, but about 15 of the total mass should experience a temperature of order 100 K.
4.4 The center of M 83
Not surprisingly in view of the very similar CO line ratios, the radiative transfer solutions for M 83 do not differ much from those for NGC 6946 (Table 5). The major difference is found in Table 6, and is caused by the much stronger [CII] emission. With model 5, the [CII] intensity can be reproduced using the CO derived gas parameters, but only if in the hot 100 K component essentially all (94) carbon is in the ionized atomic form C+; very little CO can be left. Use of the CO two-component parameters requires solutions with implausibly high C+ column densities for models 6 and 7. As already mentioned in the previous section, we have instead assumed that the [CII] emission from M 83 mostly samples conditions inbetween those of the two components, i.e. those at the interface of hot, tenuous and colder, denser gas.
Whichever model is preferred, typically 50–65 of all carbon in the center of M 83 must be in ionized form. Because of this, and the rather low HI column density observed towards the center of M 83, molecular hydrogen column densities must be quite high, of order 5–7 . Although only a relatively small fraction of all is related to CO emission, the conversion factor is nevertheless higher for M 83 than for NGC 6946: , but still well below the Galactic standard value.
The models are consistent with densities subject to radiation fields log = 2 implied by comparing the CO, [CI] and [CII] line and far-infrared continuum (Smith Harvey 1996) intensities with the PDR models given by Kaufman et al. (1999). Few density estimates from other molecules exist. Paglione et al. (1997) estimate from HCN =3–2 and =1–0 measurements, whereas the beam-corrected ratio = 9 (=1–0) from Israel (1982) suggests (see Mauersberger Henkel 1993, their Fig. 4).
An important difference between NGC 6946 and M 83 is that the strong [CII] emission characterizing the latter cannot be explained by assuming that only relatively modest amounts of carbon monoxide have been photodissociated into atomic carbon. The considerably stronger starburst in M 83 (Gallais et al. 1991; Telesco et al. 1993; Turner Ho 1994) has apparently created a PDR-zone in which large amounts of high-temperature, high-density ionized carbon gas have largely replaced efficiently eroded CO clouds, so that a significant fraction, of order 80, of the molecular hydrogen in this PDR-zone is effectively not sampled by CO emission. Dense, [CII] emitting gas is thereby a major contributor to the total gas content of the center of M 83. The actual contribution is somewhat uncertain because of the uncertainty in [CII] gas temperature. If we take = 250 K and instead of the actual values adopted, the resulting masses for models 6 and 7 in Table 6 would be about 60 of the listed values.
We conclude that the total amount of molecular gas in the center of M 83 (2010 million solar masses) is very similar to that in NGC 6946 (183 million solar masses). As in the case of NGC 6946, this is of order 1–2 per cent of the dynamical mass, so that the mass of gas is negligible with respect to the stellar mass. About 6 all hydrogen is HI; the remainder must be in the form of . About half of all hydrogen is associated with ionized carbon; the other half is mostly associated with CO. We thus confirm the predominant role for Co that was already found by Crawford et al. (1985) and Stacey et al. (1991). As for NGC 6946, we note that the total molecular mass found in the central region ( kpc) is much less than suggested by others on the basis of assumed conversion factors.
In M 83, observed CO temperatures are typically a factor of 7.5 (Model 5) to 15 (Model 7) lower than the model brightness temperatures, indicating beam-filling factors for the molecular material of order 0.12 – 0.06, i.e. larger than for NGC 6946. At the same time, the velocity-integrated intensity is a factor of two to five larger than that of a model cloud, implying the presence of that number of clouds in an average line of sight through M 83. Although the central gas masses in NGC 6946 and M 83 are very similar, the face-on mass density in the center of M 83 is more than double that of NGC 6946.
5 Conclusions
-
1.
Maps of the central arcmin of the starburst galaxies NGC 6946 and NGC 5236 (M 83) in various transitions of 12CO and 13CO, and in [CI] confirm the compact nature of the central molecular gas emission in both galaxies. Most of this gas is within a few hundred parsec from the nucleus. Major-axis position-velocity diagrams show that in both galaxies the circumnuclear molecular gas is in very rapid solid-body rotation. The steepness of the velocity gradient only becomes apparent at the higher spatial resolutions.
-
2.
Relative 12CO, 13CO and Co line intensities observed in matched beams are virtually identical in NGC 6946 and M 83, although the [CII] line intensity in the literature is much stronger by a factor of 7 in M 83. Spatially integrated line intensity ratios do not differ much from those obtained in the central 21′′ beam, except for [CI] which is either more strongly concentrated towards the nucleus than CO or insufficiently mapped.
-
3.
The velocity-integrated 12CO intensities in both galaxies decrease only slowly with increasing rotational level. The intensities in the =1–0, =2–1, =3–2 and =4–3 transitions are in the ratio of 1 : 1 : 0.65 : 0.45 respectively. Both galaxies have observed 12CO/13CO isotopic ratios of about 11, 9.5 and 12.5 in the first three transitions.
-
4.
The intensity of the neutral carbon line at 492 GHz relative to =2–1 (and =1–0) 12CO is about 0.2 in both galaxy centers. The relative intensity of the ionized carbon line is 0.08 for NGC 6946 and 0.55 for M 83.
-
5.
The resemblance of the relative CO line intensities suggests that the dense interstellar medium in both galaxies is very similar. However, the great difference in [CII] intensities shows that a reliable picture is only obtained by observing and modelling both atomic carbon and carbon monoxide lines.
-
6.
Modelling of the observed line ratios suggest a multi-component molecular medium in both galaxies. In NGC 6946, a dense component with and 30 K is present together with a significantly less dense and hotter 100–150 K component. Atomic carbon column densities appear to be about 1.5 times the CO column density. The gas in M 83 may likewise be approximated by two similar components.The denser is both somewhat less dense () and somewhat hotter ( = 60 K) than its counterpart in NGC 6946. The more tenuous component is practically identical to its counterpart in NGC 6946. M 83 is more affected by CO dissociation, as its atomic carbon to CO ratio is about four. In both starburst centers, most of the molecular mass (about two thirds) is associated with the PDR hot, relatively tenuous phase. In M 83, a significant molecular gas volume must be associated with ionized carbon rather than CO.
-
7.
With an estimated gas-phase [C]/[H] abundance of 4 , the centers of NGC 6946 and M 83 contain almost identical total (atomic and molecular) gas masses of about 3 within = 0.3 kpc. Peak face-on gas mass densities are, however, rather different: typically 45 for NGC 6946 and almost three times higher, 115 for M 83. The central molecular concentration in M 83 is denser and hotter than the one in NGC 6946.
Acknowledgements.
We are indebted to Ewine van Dishoeck and David Jansen for providing us with their detailed radiative transfer models and to Paul van der Werf for his willingness to reanalyse the ISO measurements within the context of our results. Fabienne Casoli kindly supplied us with an IRAM =2–1 12CO map for comparison with our data. We thank the JCMT personnel for their support and help in obtaining the observations discussed in this paper.References
- (1) Ables H.D., Publ. US Naval Obs. Sec. Ser. XX (IV)
- (2) Ball R., Sargent A.I., Scoville N.Z., Lo K.Y., Scott S.L., 1985 ApJL 298, L21
- (3) Banks G.D., Disney M.J., Knezek P.M., et al. 1999 ApJ 524, 612
- (4) Bianchi S., Davies J.I., Alton P.B., Gerin M., Casoli F., 2000, A&A 353, L13
- (5) Boulanger F., Viallefond F., 1992 A&A 266, 37
- (6) Carignan C., Charbonneau P., Boulanger F., Viallefond F., 1990 A&A 234, 43
- (7) Casoli F., Clausset F., Combes F., Viallefond F., Boulanger F., 1990 A&A 233, 357
- (8) Combes F., Encrenaz P.J., Lucas R., Wliachew L., 1978 A&A 67, L13
- (9) Crawford M.K., Genzel R., Townes C.H., Watson D.M., 1985 A&A 291, 755
- (10) Dressel L.L., Condon J.J. 1976, ApJS 31, 187
- (11) Engelbracht C.W., Rieke M.J., Rieke G.H., Latter W.B., 1996 ApJ 467, 227
- (12) Gallais P., Rouan D., Lacombe F., Tiphène D., Vauglin I., 1991 A&A 243, 309
- (13) Garnett D.R., Shields G.A., Skillman E.D., Sagan S.P., Dufour R.J., 1997, ApJ 489, 63
- (14) Garnett D.R., Shields G.A., Peimbert M., et al. 1999 ApJ 513, 168
- (15) Handa T., Nakai N., Sofue Y., Hayashi M., Fujimoto M., 1990 PASJ 42, 1
- (16) Handa T., Ishizuki SD., Kawabe R., 1994 in: Astronomy with Millimeter and Submillimeter wave Interferometry, Eds. M. Ishiguro, W. Welch, A.S.P. Conf. Ser. 59, p. 341
- (17) Helfer T., Blitz L., 1997 ApJ 478, 162
- (18) Hüttemeister S., Mauersberger R., Henkel C., 1997 A&A 326, 59
- (19) Ishizuki S., Kawabe R., Ishiguro M., et al., 1990 ApJ 355, 436
- (20) Israel F.P., 1982 A&A 265, 487
- (21) Israel F.P., 1998 AA Rev. 8, 237
- (22) Israel F.P., Baas F., Maloney P.R., 1990 A&A 237, 17
- (23) Israel F.P., White G.J., Baas F., 1995, A&A 302, 343
- (24) Israel F.P, Baas F., 1999 A&A 351, 10
- (25) Jansen D.J., 1995, Ph.D. thesis, University of Leiden (NL)
- (26) Jansen D.J., van Dishoeck E.F., Black J.H., 1994, A&A , 282, 605
- (27) Kaufman M.J., Wolfire M.G., Hollenbach D.J., Luhman M.L., 1999 ApJ 527, 795
- (28) Kenney J.D.P., Lord S.D., 1991 ApJ 381, 118
- (29) Lord S.D., Strom S.E., Young Y.S., 1987 in: Star Formation in Galaxies, eds. C.J. Lonsdale Persson (NASA CP 2466), p. 303
- (30) Lord S.D., Kenney J.D.P., 1991 ApJ 381, 130
- (31) McCall M.L., 1982 Ph.D. thesis Univ. Texas (USA)
- (32) Madden S.C., Geis N., Genzel R., Herrman F., Jackson J.M., Poglitsch A., Stacey G.J., Townes C.H., 1993 ApJ 407, 579
- (33) Mauersberger R., Henkel C., Wilson T.L., Harju J., 1989 A&A 226, L5
- (34) Mauersberger R., Henkel C., 1993 Rev. in Modern Astron., 6, 69
- (35) Mauersberger R., Henkel C., Walsh W., Schulz A., 1999 A&A 341, 256
- (36) Morris M., Lo K.Y., 1978 ApJ 223, 803
- (37) Nieten Ch., Dumke M., Beck R., Wielebinski R., 199 A&A 347, L5
- (38) Paglione T.A.D., Jackson J.M., Ishizuki S., 1997 ApJ 484, 656
- (39) Paglione T.A.D., Jackson J.M., Ishizuki S., Rieu, N.-Q., 1995 AJ 109, 1716
- (40) Petitpas G.R., Wilson C.D., 1998, ApJ 503, 219
- (41) Rand R.J., Lord S.D., Higdon J.L., 1999 ApJ 513, 720
- (42) Regan M.W., Vogel S.N., 1995 ApJL 452, L21
- (43) Rickard L.J, Palmer P., Morris M., Turner B.E., Zuckerman B., 1977 ApJ 213, 673
- (44) Rickard L.J, Blitz L., 1985 ApJL 292, L57
- (45) Rickard L.J, Palmer P.M., 1981 A&A 102, L13
- (46) Rogstad D.H., Shostak S., 1972, ApJ 176, 315
- (47) Rogstad D.H., Lockhart I.A., Wright M.C.H., 1974 ApJ 193, 309
- (48) Rumstay, K.S., Kaufman, M., 1983 ApJ 274, 611
- (49) Sage L.J., Isbell D.W., 1991 A&A 247, 320
- (50) Sakamoto K., Okumura S.K., Ishizuki S., Scoville N.Z., 1999 ApJS 124, 403
- (51) Sandage A., Tammann G.A., 1974 ApJ 194, 559
- (52) Sandage A., Tammann G.A., 1987, A Revised Sghapley-Ames Catalog of Bright Galaxies, second edition, Cargegie Institution of Washington Publication 635 (Washington, D.C.: Carnegie Institution of Washington).
- (53) Sauty S., Gerin M., Casoli F., 1998 A&A 339, 19
- (54) Smith B.J., Harvey P.M., 1996 ApJ 468, 139
- (55) Sofue Y., Doi M., Ishizuki S., Nakai N., Handa T., 1988 PASJ 40, 511
- (56) Stacey G.J., Geis N., Genzel R., et al. 1985 A&A 373, 423
- (57) Stutzki J., Graf U.U., Honingh C.E., et al. 1997, ApJL 477, 33
- (58) Telesco C.M., Dressel L.L., Wolstencroft R.D., 1993 ApJ 414, 120
- (59) Tilanus R.P.J., Allen R.J., 1993 A&A 274, 707
- (60) Tully R.B., 1988, Nearby Galaxies Catalog, (Cambridge: Cambridge University Press)
- (61) Turner J.L., Ho P.T.P., 1994 ApJ 421, 122
- (62) Valentijn E.A., van der Werf P.P., de Graauw Th., de Jong T., 1996 A&A 315, L145
- (63) van der Kruit P.C., Allen R.J., Rots A.H., 1977 A&A 55, 421
- (64) van Dishoeck E.F., Black J.H., 1988, ApJ 334, 771
- (65) Wall W.F., Jaffe D.T., Israel F.P., Bash F.N., Maloney P.R., Baas F., 1993, ApJ 414, 98
- (66) Weliachew L. Casoli F., Combes F., 1988 A&A 199, 29
- (67) White G.J., Ellison B., Claude S., Dent W.R.F., Matheson D.N., 1994, A&A 284, L23
- (68) Wild W., 1990 Ph.D. Thesis Ludwig-Maximilians-Universität München (Germany)
- (69) Young J.S., Sanders D.B., 1986 ApJ 302, 680
- (70) Zaritsky D., Kennicutt R.C., Huchra J.P., 1994, ApJ 420, 87