Scintillation as a Probe of the Intergalactic Medium
Abstract
Most of the baryons in the low-redshift universe reside in a warm/hot component which is difficult to detect with standard absorption/emission line techniques. We propose to use quasar refractive scintillation as an useful, complementary probe of such ionized, intergalactic gas. In particular, an application to the case of the intracluster medium is presented. We show that clusters located at should produce a source rms intensity fluctuation at 50-100 GHz of several tens of percent and on time scales ranging from days to months, depending on the projected location of the source on the foreground cluster. However, in order to produce such a signal, the source needs to be very compact. This effect, if observed, can be used as an independent test of the baryonic mass fraction in clusters.
keywords:
intergalactic medium - cosmology: theory1 Introduction
Since the discovery of quasars, absorption line studies have been proposed to probe the prevailing conditions in the intergalactic medium (IGM). Initially (Gunn & Peterson 1965, Sargent 1980, Blades, Turnshek & Norman 1988), most interest was focused on the redshifted Ly resonance line of neutral hydrogen arising in the so-called Ly forest. More recently, the technique has been extended to search for absorption lines associated with ionized heavy elements (Cowie et al. 1995; Tytler et al. 1995; Lu et al. 1998; Cowie & Songaila 1998; Ellison et al. 1999, 2000) and it will likely be possible to use it to investigate the existence of an analogous X-ray forest (Hellsten et al. 1998, Perna & Loeb 1998).
These experiments are sensitive to different states and physical processes of the gas: Ly lines can give information on the neutral component of the IGM, whereas the other two applications can be used to probe heavy elements and the processes responsible for their ionization, likely photo- and collisional ionization. However, most of the baryonic mass in the universe is in the form of ionized hydrogen: for example in Ly clouds at the neutral fraction is typically only . At lower redshift, at least 40% of the baryons in the universe reside in a warm/hot component of the IGM (Cen & Ostriker 1999, Davé et al. 2000). Thus, it is certainly useful to think of independent ways to detect it.
As light waves traverse an ionized distribution of gas, they suffer a phase change caused by variations in the average refractive index related to random irregularities in the medium. This process is known as scintillation, as, among other effects, it produces a wave amplitude fluctuation. Scintillation has been widely used at radio frequencies in the study of the interstellar medium of the Milky Way (MW) and a large literature is available (for a general introduction we defer the reader to the excellent reviews by Rickett 1977 and 1990 and Goodman & Narayan 1985). These experiments have brought a tremendous advance towards the understanding of the spatial distribution and small scale structure of the ionized component of the ISM (see for example Armstrong, Rickett & Spangler 1995 and references therein). For example, local observations have established that the power spectrum of density irregularities has a power-law dependence on the wavenumber , with . Intriguingly, this spectrum resembles the one expected in the inertial range for a fully developed Kolmogorov turbulence. However, recent work (Lambert & Rickett 2000) suggests that at large scale it might become steeper (), approaching the spectrum produced by a random distribution of clumps or by a a complex pattern of overlapping shock waves. A point worth stressing is that there is no requirement that density irregularities be produced by turbulence, although this is probably the case in the interstellar medium of the MW. Indeed, any physical effect (e.g. shocks, photoionization, gravity, instabilities) producing a spatially inhomogeneous ionized medium would also be necessarily responsible for scintillation effects.
Hence, it seems that, if the sophisticated experimental and theoretical tools developed for interstellar applications could be successfully imported into IGM studies, scintillation could complement very interestingly the ongoing absorption line observations.
It has to be pointed out that, being scintillation insensitive to the gas temperature as long as it is ionized, in principle it can be used to trace both the cool ( K) gas residing either in the (mildly overdense) Ly clouds or in the halos of low mass () systems, and the warm/hot gas ( K) originating from the virialization of groups/clusters or shocked by cosmic explosions.
In spite of its excellent credit history and of the number of important cosmological problems that it could potentially address, scintillation due to intergalactic gas has received much little attention. Application have been made in the past to flickering of extragalactic sources (Rickett, Coles, Bourgois 1984, Blandford, Narayan & Romani 1986, Shishov 1989, Spangler et al. 1989, Walker 1998), extreme scattering events (Fiedler et al. 1994) or, more recently, to gamma-ray bursts (Goodman 1997; Frail et al. 1997; Waxman, Kulkarni & Frail 1998). However, virtually all such studies have been tried to infer properties of the Galactic interstellar medium or of the source.
Here we take a different perspective and our aim is to show that scintillation can provide fresh insights into the properties of intergalactic medium by long-term radio monitoring of distant quasars; to our knowledge, only a paper (Yoshioka 1970) has suggested such possibility to date, although it has been hinted by a few other papers (Dennison & Condon 1981; Goodman 1997, Cordes & Lazio 2000). We show how the scintillation signal produced by an intergalactic distribution of ionized gas can be comparable to the standard interstellar one and, more importantly, easily disentangled from that. In this application we focus on the intracluster/intragroup gas.
2 Scintillation: Basic Relations
We consider scintillation of quasar light by a foreground cluster. Observations of the -ray surface brightness of galaxy clusters are commonly fitted by the isothermal model, in which the gas temperature is constant and the radial profile of its mass density is given by
| (1) |
where is the core radius. Typical values for the parameters of this fit are clustered around and Mpc (Jones & Forman 1984), and we adopt these values in our calculations. The central density is found by matching at large radii () the density profile to that of an isothermal sphere. This yields
| (2) |
where 111We adopt an , cosmology throughout the discussion. is the mass fraction of the gas and its temperature, is the proton mass, and is the mean atomic weight. We assign a cutoff radius so that the overdensity at the cluster boundary is about 10 times the critical density.
Whereas it seems plausible that gas turbulent motions exist in clusters, the turbulent spectrum has not been determined so far. In the Galaxy, the power spectrum of the density fluctuations is well described by the Kolmogorov spectrum,
| (3) |
where . In our calculations, we assume this spectral form for the gas density fluctuations over a range of scales from cm to cm. This range is the typical one for the scales of ”refractive” inhomogeneities in the interstellar medium (Lambert & Rickett 2000) and, lacking better information, we assume it for the clusters as well. The integral of along the line of sight is called the scattering measure SM, where is the distance to the source. In the problem that we are considering, it can be written as
| (4) |
having chosen a system of coordinates where corresponds to the center of the cluster. Here, is the impact parameter (also measured from the cluster center), , and is the value of at the center of the cluster. It can be written in terms of the nominal Galactic value as , where , and (e.g. Goodman 1997).
The physically important quantity for scintillation is the longitudinal gradient of the phase structure function
| (5) |
where , and is the direction of propagation along the line of sight. Here is the speed of light, the classic electron radius, and the observation wavelength. For a plane wave incident on a scattering medium, the line of sight integral of gives the structure function of the geometric optics phase, or wave-structure function . The field coherence length at the observer, , is defined by . The characteristic scattering angle is then defined by (see e.g. Goodman 1997)
| (6) |
where and SM.
For a pointlike source, can represent either a displacement in the apparent position of the source, or a broadening of its angular size. This depends on the magnitude of relative to the Fresnel angle
| (7) |
where is the distance to the screen in kpc. If , the scatterers can displace the image but not divide it. This is the weak scattering regime. On the other hand, if , then multiple images of the source are formed, and in this case can be interpreted as the effective size of the scatter-broadened source image. This is the strong scattering regime.
Flux scintillation can occur in two forms, diffractive and refractive. Diffractive scintillation is a physical-optics interference effect, and can only occur if the scattering is strong, when multiple subimages of the source are formed. The ray path from source to observer is different for each subimage, and if the receiving telescope is too small to separate these subimages, then the observed flux is given by the coherent sum of the contributions from all paths. Each subimage is analogous to a slit, and on an imaginary plane perpendicular to the line of sight and passing through the observer, the flux forms a speckle pattern. The characteristic size of a speckle is . In order for the speckle pattern not to be smoothed out by source size effects, it is necessary that the intrinsic angular size of the source be . When scintillation is due to an extragalactic screen, this condition requires a size which is much smaller than the emitting region of a quasar. Therefore, diffractive scintillation is quenched, and only refractive scintillation becomes possible in our context (see also discussion below).
Refractive scintillation is a geometric-optics effect consisting in the random magnification of individual subimages. For an extended source it is negligible until the scattering becomes very strong, and . The effective image of the source is given by the convolution of its intrinsic surface brightness distribution with the scatter-broadened image of a point source. This can be written as (Goodman 1997)
| (8) |
The effective image, being an incoherent source, can only be lensed by fluctuations which are at least as large as its projection on the scattering screen; this implies fluctuations of size . Inhomogeneities much larger than this scale are also ineffective because they result in a weak scattering strength, i.e. low values of . Refractive scintillation is therefore dominated by fluctuations on the order of . This sets the typical timescale of the flux modulation to
| (9) |
In the case we are considering, this relative motion is dominated by the velocity of the inhomogeneities themselves. A reasonable lower limit for this value is given by the sound speed in the intracluster medium. Here we assume a cluster temperature keV, as appropriate for the Coma cluster (Mohr, Mathiesen & Evrard 1999); the corresponding sound speed is roughly 1100 km s-1. Therefore we use km s-1, which is also in agreement with the value assumed for the turbulent velocity of the gas in hot clusters by Sarazin (1989). Note that the value of affects the refractive time scale linearly according to the above equation.
The strength of refractive scintillation is expressed in terms of the root-mean-square flux variation relative to the mean, , where (with ) is the intensity covariance; is referred to as the modulation index. In the situation that we are considering, where the scattering occurs in a cluster at cosmological distance (but still much smaller than the distance to the source), we can adopt the thin screen approximation, in which one assumes that the scattering is concentrated in a narrow layer at distance . The modulation index can then be well approximated by (Goodman 1997)
| (10) |
3 Remarks on the Source Size
An important assumption of our study concerns the existence of sources that are compact enough to produce the refractive scintillation pattern that we are predicting. This translates in the condition . A discussion of this assumption seems worthwhile.
The intrinsic size of a source emitting incoherent synchrotron radiation can be obtained from its brightness temperature . Radio observations typically test the Rayleigh part of the black-body curve. Hence we have
| (11) |
which defines . Equating to the measured flux of the source, divided by the solid angle subtended by the source, one obtains222We use the notation for the measure units
| (12) |
The expression for is given by Equation (6). Using the typical values SM=SM-3.5 and , we get
| (13) |
This implies that for the above ratio to be larger than, say, three, one needs to be in excess of few K. Upper limits on are given by the condition on inverse Compton cooling (Kellerman & Pauliny-Toth 1969) which imply that the brightness temperature for incoherent synchrotron emission has to be lower than K. Above that value, sources would undergo catastrophic cooling; this condition therefore represents a (wavelength independent) theoretical limit on .
However, many sources are observed for which a higher than this value has been estimated (Romero 1994, Quirrenbach et al. 1992, Teräsranta & Valtoja 1994). Observationally, it is well established that these sources, known as blazars, commonly show variability on time scales of hours (the so-called IntraDay Variability [IDV], for a review see Wagner & Witzel 1995). If this variability is internal, then the upper limit on the size is cm. At cosmological distances of about 1 Gpc, this corresponds to a.s. Consequently, inferred values of the brightness temperature are in the range K.
One possible explanation (Rees 1966; Woltjer 1966) is that these sources are relativistically beamed by a Doppler factor . As scales as , one requires to account for the highest sources. These Doppler factors are however too high with respect to those inferred from superluminal motions () and for -ray fluxes to be compatible with pair absorption, also implying .
Therefore, as the required values of (even allowing for a very large Doppler factor) implied by this compactness are implausibly large, one has to admit that, at least for this class of sources, the observed radiation is coherent, so that the above discussed Compton limit does not apply. Alternatively, one can note that IDV can have an external origin, for example microlensing or scintillation by the ISM (time scales are too short for the IGM to contribute appreciably). One of the most stringent arguments in support of this interpretation is that low-frequency variable sources are almost always located behind large scale galactic structures (Shapirovskaya 1978). Hence, scintillation implies that at these frequencies the source is compact enough to produce refractive scintillation on such short timescales. The extreme brightness temperatures of K that would be deduced by an intrinsic interpretation of the fastest IDV were rejected in the papers announcing the observations (e.g. Kedziora-Chudczer et al. 1997, and Dennett-Thorpe & de Bruyn 2000). These authors favor an ISS model; a view also supported by Rickett et al. (1995) for a more conventional IDV source. At higher frequencies, if the necessary compactness is maintained is not known. In any case, at present there are no theoretical or observational arguments that can rule out this possibility, and IDV blazars appear to represent the most suitable background candidates for our study.
4 Results
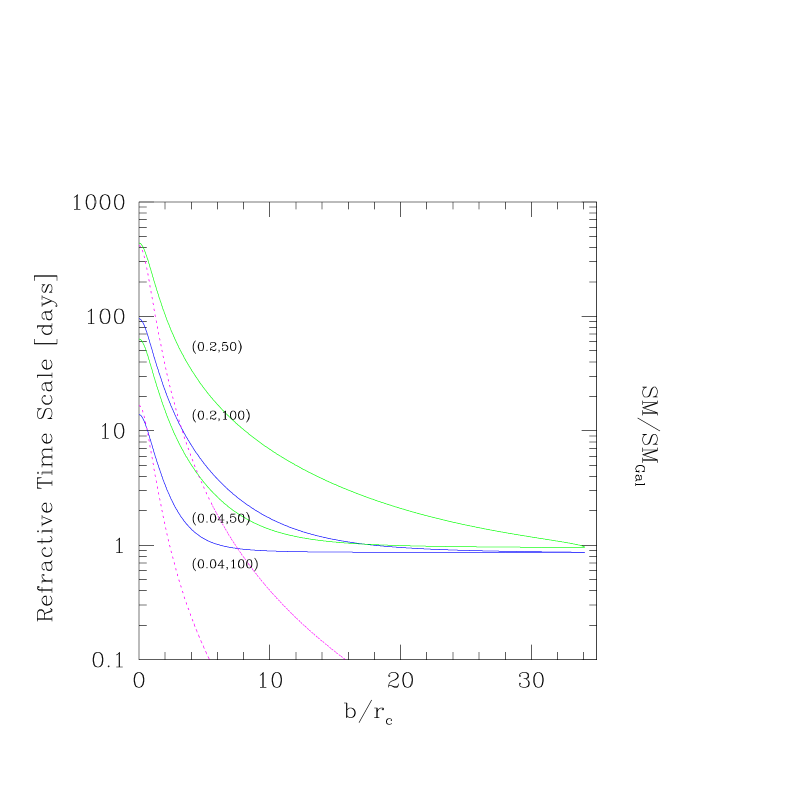
We start by analyzing the behavior of the refractive time scale (Fig. 1), , as a function of the impact parameter (in units of ) at which the line of sight to a quasar intersects the cluster hot gas distribution. In the cases we discuss, the quasar (source) is assumed to be located at whereas the cluster (screen) is taken to be at . We also consider two different values for (0.04, 0.2) that should encompass a reasonable variation range for this parameter; for the observation frequency we consider the cases of 100 GHz and 50 GHz. The time scale of refractive scintillation ranges from about a day to several months, depending on the position within the cluster and the frequency of observation. Here we have considered the case of a point source, for which . The refractive time scale is then determined by the largest between and . In the inner part of the cluster, , and . The time scales in this region are very sensitive to the value of SM, and therefore of . In the outer part, on the other hand, is larger than , and the refractive time scale becomes , which is independent of SM, but is essentially determined by the frequency of observation and the distance to the screen.
Changing in the range does not appreciably change the results. The reason is that the distance to the source only enters the definition of the source intrinsic angular size, which we assumed here to be negligible with respect to in the expression of . The results are more sensitive to variations in , and the time scale roughly increases as . As the observation frequency decreases, the refractive time scales increases. Hence, it appears that frequencies in the range considered here provide the best detection prospectives for extragalactic scintillation.
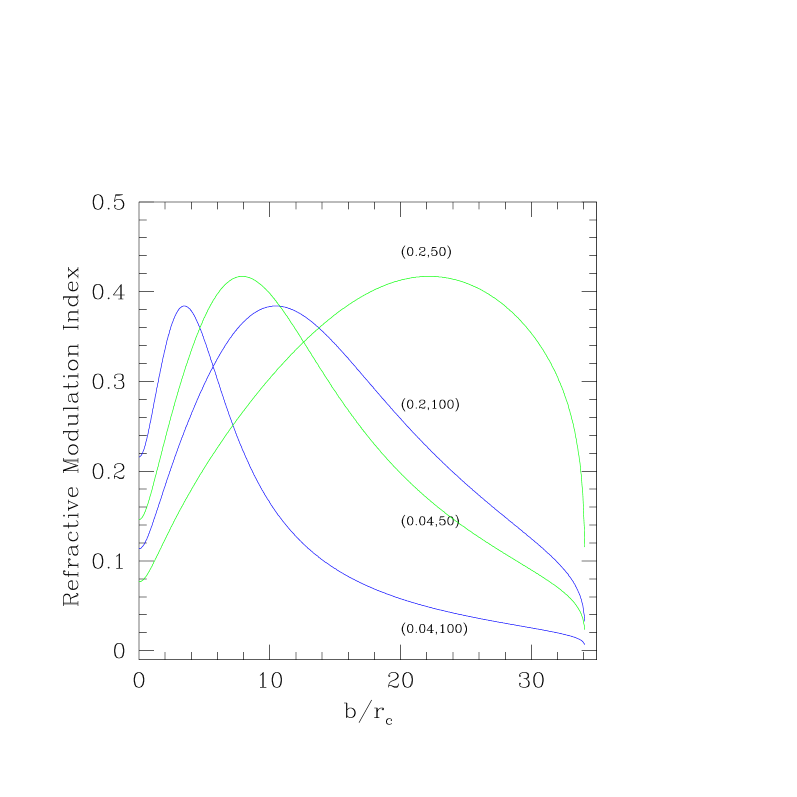
In Fig. 2, we show the refractive modulation index calculated for the same observation frequencies, GHz and GHz. The modulation index is generally on the order of several tens of percent, and it varies significantly with both frequency and baryonic fraction . In the inner region of the cluster, scintillation is in the strong regime; here , and Equation (10) is reduced to . The intensity of the modulation increases with frequency and decreases with SM (and therefore with ). This behaviour is inverted in the outer parts of the cluster, where the regime becomes weak. Here , and Equation (10) is roughly given by . Note that, even though the regime here is weak and the scattering measure is smaller than the galactic value, there can still be a relatively strong signal due to the fact that the screen is at a cosmological distance.
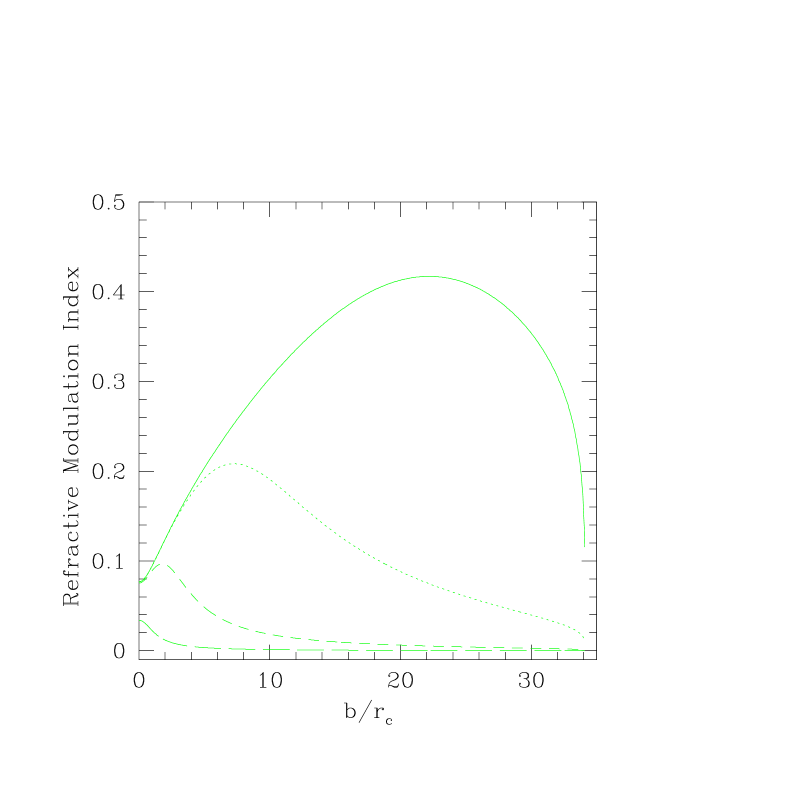
As in Figure 1, the results in Figure 2 have been computed for the case of a very compact source, and this is a crucial assumption in order to have a significant signal. In fact, as the size of the source increases and becomes larger than , , the amplitude of the fluctuations is reduced. In the limit where , one has , and, using Equation (10), one can see that the modulation index is roughly given by in the strong scattering regime, and by in the weak regime. The suppression in the modulation of the signal as the size of the source is increased is explicitly shown in Figure 3. For a given source size , the amount of suppression is different in the various parts of the cluster. In the innermost regions, where is larger, source size effects become noticeable for cm. In the outer parts, where the ratio is smaller, the suppression becomes evident for smaller sizes and, for a source of cm at , the modulation of the signal is reduced to only a few percent. Furthermore, note that, while reducing the modulation, a large source also makes the refractive time scale longer, of a factor on the order of in the strong regime, and of in the weak case.
5 Discussion
We have presented an extension of standard scintillation experiments to probe the intergalactic medium; in particular, we have considered the case of intracluster gas. We have found that clusters located at redshift around a tenth should produce an rms intensity fluctuation at 50-100 GHz of several tens of percent on time scales ranging from about a day to several months, depending on the projected location of the source with respect to the cluster radius. This effect, if observed, can yield valuable information on the baryonic fraction () and the spectrum of inhomogeneities of the intracluster gas.
More generally, this technique could be particularly important to study the warm/hot gas predicted to act as a reservoir of the majority of baryons at low redshift. In fact, we have mentioned that scintillation is not sensitive to temperature, as long as the gas is ionized. However, only the largest objects (clusters and groups of galaxies) can reach a sufficiently high scattering measure to produce a significant fluctuation level. Thus, it appears that scintillation is a perfect tool to investigate hot gas, presumably in large virialized objects. Constraints on the baryonic mass fraction in clusters that can complement those obtained from emission/absorption line measurements and from the Sunyaev-Zeldovich effect should be obtainable if scintillation will be observed. Scintillation is particularly effective to probe gas at very large radii, which is difficult to probe with -ray instruments.
The proposed method can be also very important in assessing the level of turbulence in the intracluster medium, if the data will come out to be consistent with our predictions based on the assumption that a density fluctuation spectrum is close to the one expected for Kolmogorov turbulence. Turbulence has been often invoked in the cluster environment to provide efficient mechanism for heavy element mixing; it can be generated both by stirring of the gas by galaxy motions, shocks (both due to virialization and by galactic outflows), mergings and also by Kelvin-Helmoltz instabilities occurring at the boundaries of galaxies as they move through the intracluster medium (Goldman & Raphaeli 1991, de Young 1992, Westbury & Henriksen 1992, Goldshmidt & Raphaeli 1993, Sanchez-Salcedo, Brandenburg & Shukurov 1998, Mori & Burkert 2000). However, this phenomenon is still awaiting firm, direct detections. We have shown that intergalactic scintillation might well provide one.
Observations on long time scales obviously require some care as they can be affected by several spurious effects. Flux modulations due to scintillation should however be easily isolated from flux variations due to other causes. Amplifications due to microlensing are achromatic, and therefore distinguishable from the frequency dependent scintillation, whereas intrinsic variations are not expected to be of periodic nature and to have the same frequency dependence as scintillation. Multiwavelength observations, as already available for several objects (e.g. Bloom et al. 1999), would therefore be most useful to such purpose. If more than one source were found behind a cluster, then the dependence of the signal on the impact parameter would also be very distinctive of scintillation.
A contribution to refractive scintillation by the galactic ISM is also possible. However, for most of the cluster (where the regime is weak and ), the contribution to the modulation index by the IGM should largely dominate over that from the ISM. For a cluster at , we have , and therefore the contribution to from the IGM will dominate over that from the ISM for . At the same time, the refractive time scale at 100 GHz, obtained assuming a screen with SM=SMGal located at 1 kpc from the observer, is on the order of an hour, thus much shorter than the one due to the hot cluster gas.
In principle, one can also think of applications to the “true” IGM, i.e. the diffuse intergalactic gas observed via Ly absoption lines. For an Einstein-de Sitter universe with , the IGM scattering measure due to a uniformly distributed IGM up to a redshift is , implying that a contribution can occur only for sources located at very high . In addition, the typical Doppler parameters observed in the Ly forest are at most a few tens of km s-1, thus making much longer. We conclude that a scintillation component arising from the true IGM would be hardly detectable.
An important assumption in our discussion regards the compactness of the source. We have discussed the decrease of when the source size is increased and we have shown (Fig. 3) that compact sources are needed in order to have a significant modulation of the signal.
Using eq. (12), it is easy to show that the relation linking the source size with its brightness temperature is
| (14) |
which gives K for , , and cm. For these values, the modulation index is at the cluster center, and when SM=SMgal. What we now need to estimate is the surface density in the sky of the IDV sources which have the required brightness temperature. IDV in radio-loud sources has only been seen in objects with flat spectra (Flat Spectrum Radio Quasars, FSRQ), i.e. ; among these sources about 25% show IDV (Ghisellini, private communication). For the differential number counts of FSRQ we use the results of Padovani & Urry (1992) (see their Fig. 5); at they find 108 such sources (or 27 IDV sources) per steradian. Thus, the probability of finding one such object behind the central Mpc region of our reference cluster at is about 3%, i.e. a small but nonnegligible occurrence chance.
Acknowledgments
This work was completed as one of us (AF) was a Visiting Professor at the Center for Computational Physics, Tsukuba University, whose support is gratefully acknowledged. We thank A. Celotti, G. Ghisellini, H. Susa and M. Umemura for useful discussions. Most of all, we are indebted to the referee, B. J. Rickett, whose careful reading and insightful comments greatly improved our manuscript.
References
- [1] Armstrong, J. W., Rickett, B. J. & Spangler, S. R. 1995, ApJ, 443, 209
- [2] Blades, J. C., Turnsheck, D. A. & Norman, C. A. 1988, QSO Absorption Lines: Probing the Universe (Cambridge: UniPress)
- [3] Blandford, R., Narayan, R. & Romani, R. W. 1986, ApJL , 301, 53
- [4] Bloom, S. D. et al. 1999, ApJS, 122, 1
- [5] Cen, R. & Ostriker, J. P. 1999, ApJ, 514, 1
- [6] Coles, W. A., Frehlich, R. G., Rickett, B. J. & Codona, J. L. 1987, ApJ, 315, 666
- [7] Cordes, J. M. & Lazio, T. J. W. 2000, preprint (astroph/0005493)
- [8] Cowie, L. L., Songaila, A., Kim, T. S. & Hu, E. M. 1995, AJ, 109, 1 522
- [9] Cowie, L. L., & Songaila, A. 1998, Nature, 344, 44
- [10] Davé, R. et al. 2000, preprint (astro-ph/0007217)
- [11] Dennett-Thorpe, J.& de Bruyn, A. G. 2000, ApJ, 529, 65
- [12] De Young, D. S. 1992, ApJ, 386, 464
- [13] Dennison, B., & Condon, J. J. 1981, ApJ, 246, 91
- [14] Fiedler, R., Dennison, B., Johnston, K. J., Waltman, E. B. & Simon, R. S. 1994, 430, 581
- [15] Frail, D. A., Kulkarni, S. R., Nicastro, L. Feroci, M. & Taylor, G. B. 1997, Nature, 389, 261
- [16] Goldman, I. & Rephaeli, Y. 1991, ApJ, 380, 344
- [17] Goldshmidt, O. & Rephaeli, Y. 1998, ApJ, 411, 518
- [18] Goodman, J. & Narayan, R. 1985, MNRAS, 214, 519
- [19] Goodman, J. 1997, NewA, 2, 449
- [20] Gunn, J. E. & Peterson, B. A. 1965, ApJ, 142, 1633
- [21] Hellsten, U., Dave, R., Hernquist, L., Weinberg, D. & Katz, N. 1997, ApJ, 487, 482
- [22] Jones, C. & Forman, W. 1984, ApJ, 276, 38
- [23] Kedziora-Chudczer, L. et al. 1997, ApJL, 490, L9
- [24] Kellerman, K. I. & Pauliny-Toth, I. I. K. 1969, ApJL, 155, 71
- [25] Lambert, H. C. & Rickett, B. J. 2000, ApJ, 531, 883
- [26] Lu, L., Sargent, W. L. W., Barlow, T. A. & Rauch, M. 1998, preprint, astro-ph/9802189
- [27] Mohr, J. J., Mathiesen, B. & Evrard, G. A. 1999, ApJ, 517, 627
- [28] Mori, M. & Burkert, A. 2000, ApJ, 538, 559
- [29] Perna, R. & Loeb, A. 1998, ApJ, 503, L135
- [30] Quirrenbach, A. et al. 1992, A&A, 258, 279
- [31] Romero, G. E., Combi, J. A. & Colomb, F. R. 1994, A&A, 288, 731
- [32] Rees, M. J. 1966, MNRAS, 135, 345
- [33] Rickett, B. J. 1977, ARA&A, 15, 479
- [34] Rickett, B. J. 1990, ARA&A, 28, 561
- [35] Rickett, B. J., Coles, W. A. & Bourgois, G. 1984, A&A 134, 390
- [36] Rickett, B. J., Quirrenbach, A., Wegner, R., Krichbaum, T. P. & Witzel, A. 1995, A&A, 293, 479
- [37] Sanchez-Salcedo, F. J., Brandenburg, A. & Shukurov, A. 1998, ApSS, 263, 87
- [38] Sarazin, C. L. 1989, ApJ, 345, 12
- [39] Sargent, W. L. W., Young, P. J., Boksenberg, A. & Tytler D. 1980, ApJS, 42, 42
- [40] Shapirovskaya, N. Y. 1978, Sov. Astron, 22, 544
- [41] Shishov, V. I. 1989, PAZh, 15, 975
- [42] Spangler, S., Fanti, R., Gregorini, L. & Padielli, L. 1989, A&A, 209, 315 Tytler, D. et al. 1995, in QSOs Absorption Lines, Proc. ESO Workshop, ed. G. Meylan (Heidelberg: Springer), p. 289
- [43] Teräsranta, H. & Valtoja, E. 1994, A&A, 283, 51
- [44] Yoshioka,, S. 1970, PASJ, 22, 423
- [45] Wagner, S. J. & Witzel, A. 1995, ARA&A, 33, 163
- [46] Walker, M. A. 1998, MNRAS, 294, 307
- [47] Waxman, E., Kulkarni, S. R. & Frail, D. A. 1998, ApJ, 497, 288
- [48] Westbury, C. F. & Henriksen, R. N. 1992, ApJ, 388, 64
- [49] Woltjer, L. 1966, ApJ, 146, 597