Late Light Curves of Type Ia Supernovae
Abstract
We extend earlier efforts to determine whether the late (t60d) light-curves of type Ia SNe are better explained by the escape of positrons from the ejecta or by the complete deposition of positron kinetic energy in a trapping magnetic field. We refine our selection of Ia SNe, using those that have extensive BVRI photometry 35 days or more after maximum light. Assuming all SNe within a given m15(B) range form a distinct sub-class, we fit a combined light-curve for all class members with a variety of models. We improve our previous calculations of energy deposition rates by including the transport of the comptonized electrons. Their non-local and time-dependent energy deposition produces a correction of as much as 0.10m for Chandrasekhar models and 0.18m for sub-Chandrasekhar models.
We find that applying a filter efficiency correction, derived from measured spectra, to B, V, R, and I light-curves after day 50 can produce a consistent bolometric light-curve. The V band is an accurate indicator of total emission in the 3500 - 9700 range, with a constant fraction (25%) appearing in the V band after day 50. This suggests that the V band scales with the bolometric luminosity, and that the deposited energy is instantaneously recycled into optical emission during this epoch. Varying bolometric corrections for the other bands are derived. We see significant evolution of the colors of SNe Ia between day 50 and day 170. We suggest that this may be due to the transition from spectra dominated by emission lines from the radioactive nucleus, 56Co, to those from the stable daughter nucleus, 56Fe. We show that the B, V, R, and I band light-curves of SNe Ia after t60d can be completely explained with energy deposition from 56Co decay photons and positrons if substantial positron escape occurs.
1 Introduction
Type Ia supernovae (SNe) are an integral part of many current astrophysical investigations. Their luminosities briefly rival entire galaxies, making them useful as distance indicators to large (Riess et al. 1998; Perlmutter et al. 1999). Understanding of their contributions to galactic chemical evolution is necessary to sort out the star formation history of various other stellar populations in the Galaxy (Timmes et al. 1996). The escape of gamma rays from their ejecta may produce a significant portion of the diffuse gamma ray background in the 400 - 2000 keV energy range (Watanabe et al. 1999). The escape of positrons from their ejecta may be large enough to explain a majority of the 511 keV annihilation radiation measured by the CGRO/OSSE instrument (Chan & Lingenfelter 1993; Milne, The & Leising 1999, hereafter MTL). All of these investigations rely upon a basic understanding of the SN Ia event.
Type Ia SNe are widely-believed to be the thermonuclear explosion of a mass-accreting carbon-oxygen white dwarf (WD). The conversion of carbon and oxygen to iron-peak and intermediate-mass elements releases a large amount of energy initially, and subsequently the decay 56Ni 56Co 56Fe powers the supernova through gamma- and X-ray photons and positrons.222Although neutrinos are also created in these decays, the lower neutrino opacity makes neutrinos an insignificant contributor to the energy deposition rate during the epoch of interest in this work. See Nadyozhin (1994) for major features of this decay chain. The deposition and diffusion of this energy produces the optical emission that defines the Type Ia SN. The observational support for this paradigm is typified by the ability of a standard carbon-oxygen WD model, W7, to reproduce the light curves and spectra of the SN Ia 1981B (Branch et al. 1985).
During the earliest epoch after the SN explosion, the energy released in the 56Ni 56Co 56Fe decay is efficiently trapped by the SN ejecta. The deposition of this energy creates energetic electrons, which thermalize (primarily via ionization and excitation of atoms) and recombine. The optical photons created in the recombinations diffuse to the surface, and escape the SN ejecta. The emerging optical spectrum is dictated by the nature of the diffusion of the optical photons. The expansion of the SN ejecta lowers the column density to the surface, decreasing both the time for optical photons to diffuse outward and the efficiency of trapping of gamma-rays and energetic positrons and electrons. The SN thus transitions from an epoch during which the energy deposition is essentially complete and instantaneous and the emission depends upon the diffusion of optical photons (a “diffusion-dominated” epoch) to an epoch during which the diffusion time-scale is negligibly short and the emerging emission depends upon the transport of the decay products (a “deposition-dominated” epoch).
Observations of SNe during these two epochs probe different characteristics of the SN explosion. As will be described in the next section, observations of SNe Ia during both epochs have led to considerable advances in the understanding of the SN event. This work concentrates upon late emission. It follows a previous work (Milne, The & Leising 1999) which also investigated late emission, fitting model-generated energy deposition rates to photometry of 10 SNe Ia. That work treated the 50d -200d time period in an approximate fashion, concentrating upon the 200d - 1000d emission and will be referenced for discussions relating to gamma-ray, X-ray and positron transport and the yield of escaping positrons. This work performs similar comparisons, but concentrates more on the 50d -200d period, which spans the transition from diffusion-dominated emission to deposition-dominated emission.333In this work, all SNe Ia will be assumed to rise to peak luminosity in 18 days. In addition, this paper treats the information that is available from the R and I band observations of SNe Ia, as well as from late spectra. We compare model-generated energy deposition rates with B,V,R, and I band photometry for a large collection of well-observed SNe Ia, before and after creating bolometric corrections from a collection of late SN Ia spectra. Through these comparisons, we address four specific questions: 1) Is there any order to the late light curves of SNe Ia? 2) Is there observational support of the suggestion that positrons escape the SN ejecta? 3) Do the late light curves afford any insight into the correct explosion scenario(s)? 4) Are the late light curves of SNe Ia suitably explained by the decay products of the 56Ni 56Co 56Fe without the inclusion of additional sources of energy deposition.
2 Physics of SN Ia Emission
2.1 Emission during the first 50 days
SN light curves peak in brightness and fade on time-scales related to the lifetimes of 56Ni (=8.8d) and 56Co (=111d). By 100 days after the explosion, SN Ia emission has faded to less than 4% of its maximum luminosity. Largely because of the dimming of the emission, SNe Ia are better studied during the first 50 days than during later epochs. As a result, most investigations address issues relating to the diffusion-dominated epoch. Once thought to be a homogeneous class, more and better observations have revealed that intrinsic differences exist among SNe Ia (Phillips et al. 1987, Filippenko et al. 1992, 1992b, Suntzeff 1996). These differences are evident in the time evolution of the spectra, the shape of the light curves, and in the absolute magnitude of the emission at peak luminosity. Inhomogeneity at the level observed has necessitated the enlargement of the paradigm from a single, standard model to families of models.
The level of understanding of this inhomogeneity has progressed on many fronts over the last decade. Observationally, “twins” have been found for both anomalously bright, and anomalously faint SNe Ia, solidifying the existence of a large range (and perhaps a continuum) of phenomena.444Li et al. 2000 concluded that only 64% of all SNe Ia are normally-luminous, with 16% sub-luminous and 20% super-luminous. The very existence of inhomogeneity has altered the investigations of explosion scenarios. Four explosion scenarios dominate the present paradigm. The first consists of a carbon-oxygen white dwarf near the Chandrasekhar mass accreting hydrogen or helium from a binary companion until it reaches a mass at which the core carbon ignites. If the resulting burning front accelerates to become a detonation in the outer layers of the WD, a “delayed detonation” results. If the burning front remains sub-sonic, the result is a “deflagration”. These Chandrasekhar mass (CM) scenarios account for inhomogeneity by variations in the propagation of the burning front due to density and/or compositional differences in the progenitor carbon-oxygen WD. The second scenario consists of a lower mass carbon-oxygen WD accreting a helium shell, which becomes thick enough to produce a helium shell detonation. This, in turn, triggers central carbon ignition. In this sub-Chandrasekhar (SC) mass scenario, inhomogeneity is due to the different nucleosynthesis that results when the progenitor mass varies from 0.65 - 1.1 M⊙. The third scenario merges two carbon-oxygen white dwarfs, with the more massive white dwarf accreting the companion. As with the Chandrasekhar mass scenario, central carbon ignition results. In this case, the accreted envelope is carbon. The range of masses of these explosions have been suggested to vary from 1.2 - 1.8 M⊙, with a roughly constant nickel yield. This scenario is also referred to as a “double degenerate” explosion. The fourth scenario is not a thermonuclear explosion at all, but an accretion-induced collapse (AIC) of a white dwarf (either CO or ONeMg). It has been argued that in some cases, electron capture within an accreting white dwarf may lead to a collapse rather than central carbon ignition (as with Types II/Ib/Ic SNe). These events eject less total mass and less nickel than the other scenarios, and have been suggested to explain sub-luminous SNe Ia. Families of SN models have been developed within these scenarios (including variations of these scenarios such as pulsed delayed detonations). Using these models, many authors have demonstrated that compositional and kinematic differences within families of these SN models can roughly simulate spectral variations in observed SNe. These differences are seen and simulated near peak luminosity (Mazzali et al. 1992, 1995, 1997, Hőflich et al. 1996, Jeffery et al. 1992, Baron et al. 1996), and during the later, nebular epoch (Ruiz- Lapuente et al. 1992, 1996, Liu et al. 1997a, 1997b, 1998, Bowers et al. 1997).
The existence of inhomogeneity affects the use of SNe Ia as distance indicators at the level currently employed. There is an apparent absolute luminosity/peak-width relationship inferred from distance estimates to the host galaxies of nearby SNe Ia, quantified variously as m15(B) (Phillips 1993), MLCS (Riess et al. 1996), and stretch (s) (Perlmutter et al. 1997). The ability to theoretically explain the luminosity/peak-width relationship is critical for relating well-observed, nearby SNe to SNe at the cosmological distances at which SNe Ia are used as distance indicators. This task is difficult because calculating the transport of optical photons through SN ejecta is a very complicated procedure. The ejecta is constantly evolving in both density and temperature. A photon crossing this non-equilibrated ejecta is red- (or blue-) shifted relative to local matter, wreaking havoc with the line-dominated opacity. Further complicating matters are the uncertainties of the cross sections of many relevant interactions. Despite these difficulties, detailed studies have been performed. Hőflich (1995) fit the B,V,R,I band observations of the well-observed SN 1994D with a variety of Chandrasekhar mass models, demonstrating a high level of discrimination between models. Hőflich & Khokhlov (1996) then generated B-M band light curves for Chandrasekhar mass and sub-Chandrasekhar models, and fit B,V,R,I band observations of 26 SNe Ia. One conclusion from that study is that sub-Chandrasekhar models appear too blue at peak to explain observations of sub-luminous SNe Ia. The same conclusion was reached by Nugent et al. (1997). Pinto & Eastman (1996, 2000a,b,c) investigated the influence of progenitor mass, nickel mass, nickel distribution, explosion energy and opacity upon the bolometric light curves. They then concentrated upon the ability of Chandrasekhar mass models to reproduce the B,V,R luminosity/peak-width relation in the range 0.85 m15(B) 1.75. A significant achievement of those efforts is the agreement between their calculated 18d -20d rise-times of the B and V peak luminosity, with the observed rise-times of SNe Ia (Riess et al. 1999a,b; Aldering, Knop & Nugent 2000).555The models shown in Hőflich (1995) and Hőflich & Khokhlov (1996) rise to V peak in 13d -15d. Recent simulations by Hőflich et al. (1998) show that the V peak can be delayed by 3 days depending upon the C/O ratio, but fits of these models to observed SNe (equivalent to the previous works) have not been published.
Collectively, these investigations have reached the loose consensus that the Chandrasekhar mass explosion scenario is the favored scenario to account for the range of optical observations. Whether any subset of SN Ia events occur as sub-Chandrasekhar, merger or AIC explosions remains unclear. In this work, we simulate light curves for models representative of all four scenarios, and demonstrate general results of late light curve studies.
2.2 Emission after 50 days
Neither Hőflich & Khokhlov (1996) nor Pinto & Eastman carried their photometric simulations beyond 120d, both groups suggesting that their simulations become inadequate at late epochs. As described in MTL, during the time interval of interest in this work, the energy deposition is dominated by interactions involving the decay products of the 56Co 56Fe decay; gamma-ray photons and positrons. The photons possess 30 times more energy per decay than the positrons, but are more penetrating. This leads to the photons initially dominating the energy deposition but transitioning at later times to positron dominance. The photon transport was performed with a Monte Carlo algorithm adopting the prescription of Podznyakov, Sobol, & Sunyaev (1983). A detailed description of the Monte Carlo algorithm is given in The et al. (1990), with its application to SNe Ia light curves in Burrows & The (1990).666The resulting gamma-ray light curves agree with Hőflich (1995) and Hőflich et al. (1996) to within 5%. The dominant interaction is Compton scattering, which produces energetic electrons. These secondary electrons have a mean energy typically 300 keV at 100d. MTL assigned these electrons zero lifetimes, depositing the energy in-situ. This work improves on that by including the transport of the secondary electrons with the same algorithm employed for the positron transport, but using Mőller scattering rather than Bhabha scattering. The effect of the secondary-electron transport is small but non-negligible; in the Chandrasekhar mass models with radial positron escape and low ionization, the light curves are fainter by 0.10m; for low-mass sub-Chandrasekhar models, the effect reaches 0.18m.
Positron transport depends upon the nature of the magnetic field. Three scenarios have been suggested to model the magnetic field (Ruiz-Lapuente & Spruit 1998, hereafter RLS). The first suggests that the field is too weak to confine positrons, and positrons follow straight line trajectories, with a fraction escaping the ejecta (Colgate, Petschek & Kriese 1980). The second suggests a stronger field that confines positrons, but with the field lines radially-combed by the homologous expansion. The positrons spiral along these radial field lines with their pitch-angles decreasing due to the field gradient (beaming), with a fraction escaping the ejecta (Chan & Lingenfelter 1993). The third scenario suggests a strong field that is turbulently disordered such that positrons mirror frequently with no net transport (Axelrod 1980). Positrons may survive non-thermally at late times, but none escape. Colgate, et al. (1980) argued that the first two situations are equivalent. Simulations by MTL found this to be approximately true for most SN models. The first two scenarios will herein be referred to as the “radial” scenario, the third will be referred to as the “trapping” scenario. The differing positron escape leads to differences in model energy deposition rates, which makes late observations of SNe Ia a probe of the photon and positron transport.
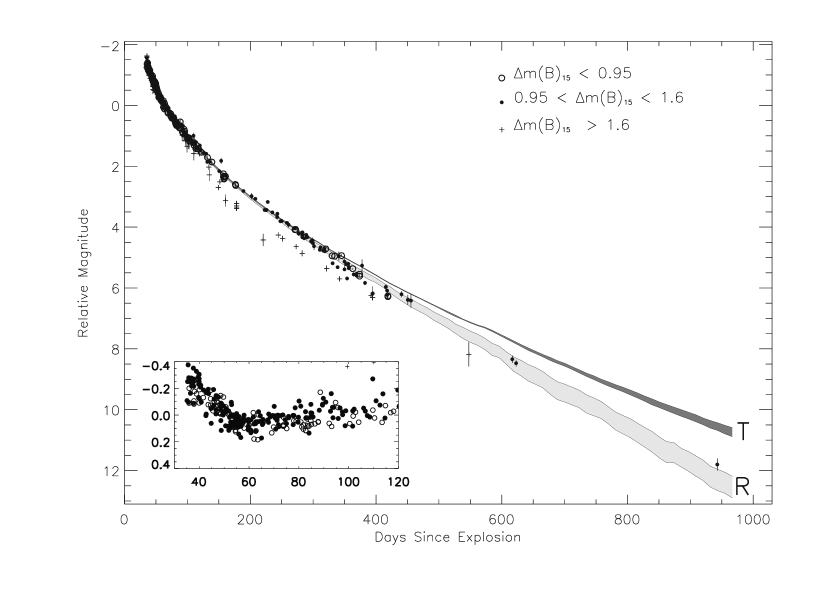
The positron and secondary electron transport was performed with a Monte Carlo algorithm, as explained in MTL. The dominant energy loss mechanisms are ionization and excitation of bound electrons for low levels of ionization, and plasma excitation for higher ionization. The model-generated energy deposition rate for the sub-Chandrasekhar model, HED8, is shown in Figure 1. The dashed line (D) assumes instantaneous deposition of all decay energy, an assumption that is invalid due to gamma-ray photon escape by 30d. The dotted line (G) uses the results of the gamma-ray/secondary electron deposition only and assumes no deposition of positron kinetic energy. By 100d, the deposition of positron kinetic energy is an important contributor to the total energy deposition rate, but the positron lifetimes are short enough that all positron curves approximate instantaneous, in-situ deposition of positron energy (In). At later times, densities in the ejecta are low enough to allow escape in the radial scenario (dark shading, R) and non-thermal survival in the trapping scenario (light shading, T). Both scenarios were calculated for a range of ionizations, from 1% of all nuclei being singly ionized, to all nuclei being triply ionized. Positron escape removes energy from the ejecta, leading to fainter light curves than in-situ deposition. Lower ionization permits more positron escape and thus is the fainter edge of the radial curve. A trapping field permits large non-thermal lifetimes, but no escape. This leads to storage of energy and a late light curve that is brighter than in-situ deposition. For this scenario, low ionization leads to a larger energy storage and the brighter edge of the trapping curve.777The normally-luminous sub-Chandrasekhar model shown allows a relatively large escape fraction for the radial scenario compared to normally-luminous Chandrasekhar mass models. Nonetheless, the basic features shown in Figure 1 are characteristic of all the SN Ia models simulated.
2.3 Model/Observation Comparisons
The ideal model/observation comparison would entail an explicit NLTE determination of photon and positron energy deposition rates and from these rates the generation of optical/IR spectra. These spectra would then be compared with a sequence of observed SN Ia spectra, comparing the evolution of the total flux from early to very late epochs. This ideal situation is far from being realized, both computationally and observationally. Falling short of that solution, an alternative approach has been employed in numerous works; fitting energy deposition rates to multi-band photometry or estimates of the uvoir bolometric luminosity. Two issues must be addressed for these comparisons to be meaningful, photon diffusion delay and color evolution. Photon diffusion delay refers to the portion of the time delay between the energy deposition (from the scattering of gamma- and X-ray photons and slowing of positrons) and the production of the optical light that can be seen by an external observer that is due to the diffusion of optical photons out of the ejecta. This diffusion delay determines the shape of the SN light curve peak at early times, but decreases to negligible values at late times. Thus, at late epochs, energy deposition is instantaneously recycled into optical emission. In previous studies of late light curves of SNe Ia, two approaches have been used to account for photon diffusion delay. Studies that attempt to fit observations continuously from early to late epochs derive this time delay as a function of explosion epoch. The alternative approach is to study only the late epochs and assume instantaneous recycling. Observationally, the late epoch begins when the emitted spectrum transitions from continuum emission to (forbidden) nebular lines. Color evolution refers to the changing fraction of the total optical flux that a given photometric band samples due to the evolution of the spectrum. Again, two different approaches have been employed. The first approach creates bolometric light curves from the photometry (applying weighting factors derived from spectra) and compares these light curves to model-generated energy deposition rates.888Contardo et al. (2000) discuss the issues related to generating bolometric light curves from band photometry. The second approach determines the epoch after which a given photometric band scales with the total optical flux (the epoch is determined from spectra), and compares this band photometry to model-generated energy deposition rates.
Two groups that carried their investigations to late epochs have treated photon diffusion in their comparisons. Colgate, Petschek and Kriese (1980) fit Monte Carlo model simulations of the energy deposition rate to B band data from SNe 1937C and 1972E. That work assumed a grey opacity for both photon and positron transport and a single-zone model. They concluded that positron escape was required to explain the late light curves. Cappellaro et al. (1998) (hereafter CAPP) and Salvo et al. (2001) transported gamma-ray photons, positrons and optical photons through W7-like models (scaled to various masses) with a Monte Carlo code and fit the energy deposition rates to V band data from SNe 1991T, 1994D, 1992A, 1993L, 1996X and 1991bg.999Both Colgate et al. (1980) and CAPP transported the positrons with routines that were produced for photon transport. The positrons were given a speed . That work assumed a grey opacity for photons and varied the positron opacity to fit the late light curves. They concluded that positron escape was suggested for some, but not all SNe.
RLS transported gamma-ray photons and positrons through Chandrasekhar mass and sub-Chandrasekhar models without treating photon diffusion delays, and fit the energy deposition rates to bolometric light curves for the SNe 1972E, 1992A and 1991bg.101010The bolometric light curves were generated from photometry for SNe 1992A and 1991bg. For SN 1972E, the bolometric light curve was generated from a series of optical spectra. That work concentrated upon very late times ( 100d) at which time the photon diffusion delay time-scale is assumed to be short. They concluded that normally-luminous SNe Ia transition from a positron-trapping phase to a positron-escape phase after 450d, and can be fit with Chandrasekhar mass models. They further concluded that sub-Chandrasekhar models best describe the sub-luminous SNe Ia and feature positron escape as early as 150d. MTL transported gamma-ray photons and positrons through Chandrasekhar mass and sub-Chandrasekhar models, and fit the energy deposition rates to bolometric, V band and B band light curves for 10 SNe, including the SNe studied by the previously mentioned groups. That work also concentrated on very late times and did not treat photon diffusion delays. They concluded that both Chandrasekhar mass and sub-Chandrasekhar models can explain normally- and super- luminous SNe Ia, with positron escape suggested to be consistent with seven of the eight SNe. They further concluded that none of the models tested could explain the sub-luminous SN 1991bg, a result in agreement with CAPP, but in disagreement with RLS.
This work does not simulate photon diffusion delays, comparing model-generated energy deposition rates to multi-band photometry as though the delays were negligible. This approach uses the comparisons to determine the onset of instantaneous recycling. Similarly, the initial comparisons of the model-generated energy deposition rates to each of the B,V,R and I band data-sets assume no color evolution. The differences between these comparisons and the later comparisons that incorporate spectrally-derived bolometric corrections afford a measure of the importance of color evolution at late epochs.
3 SN Ia Observations
To perform model-generated energy deposition rate/SN light curve comparisons, a large collection of SNe Ia observations have been compiled. The principle sources of B,V,R,I band photometry are the 29 SNe Ia observed by Hamuy et al. (1996), and the 22 SNe Ia observed by Riess et al. (1999). MTL fit the 10 SNe Ia best observed to very late times. Of those ten SNe, only six are included in this study (as explained below). These SNe have been supplemented with observations of SN 1995D by Sadakane et al. (1996), SN 1996X by Salvo et al. (2001), SN 1997cn by Turatto et al. (1998), SN 1998bu by Jha et al. (1999), Suntzeff et al. (1999), Garnavich et al. (2000), Cappellaro et al. (2001), and SN 1998de by Modjaz et al. (2000). The SNe Ia have been divided into luminosity sub-classes (normally-, sub- and super-luminous). Hereafter these categories will be denoted in figures by N, sb & SP. The categorization is based upon the m15(B) (Phillips 1993) values of the SNe. Numerous empirical relations have been derived for SNe Ia, plotting a given variable versus the m15(B) parameter. Shown in Figure 2 are the maximum B,V and I band absolute magnitudes for 21 of the 22 SNe Ia analyzed in this study combined with 18 others from Hamuy et al. 1996.111111This figure only included the SNe with well-defined peak shapes. Early studies assumed a linear relationship between these variables for all SNe Ia. A larger sampling has suggested that all these relations deviate from linearity at m15(B) 1.6. It is unclear whether this deviation is best explained by a continuous quadratic function applicable to all SNe Ia (Phillips 1999), or by two different linear relations, one for each sub-class of SNe Ia. Regardless of the interpretation of this break, the normally-/sub-luminous cut has been set at 1.60. By that definition, SN 1993H is considered sub-luminous and SN 1992A is considered normally-luminous. The normally-/super-luminous cut (m15(B)=0.95) was chosen such that the well-observed SN 1991T (which showed spectral deviations from normal SNe Ia) was considered super-luminous. It is important to note that the absence of a template SN with a wider peak than SN 1991T hinders the accurate estimation of m15(B) for super-luminous SNe. As will be shown, the exact location of the normally-/super-luminous cut is unimportant for this work, but the normally-/sub-luminous cut does differentiate two distinct late light curve sub-classes.
From 64 observed SNe Ia, 22 were included in this study. To be included, a SN had to be observed at least once after 85d with at least one observation within 20 of the normalization epoch (explained below), chosen to be 65d post-explosion. Additionally, the SN had to be first observed no later than one week post-B maximum (a requirement relaxed for the SN 1992K due to the undersampling of the sb sub-class). The SNe Ia which meet this criteria are; N:90N,90O,92A,92al,93ag,94D,95D,95E,95al,96X,98bu, SP:91T,91ag,92bc,94ae,95bd, sb:86G,91bg,92K,93H,97cn,98de. Four SNe Ia from MTL were not included in this study. SNe 1937C and 1972E were not well-observed with multi-band photometry and were excluded. SN 1993L was discovered more than a week post-peak and was excluded. The late photometry of SN 1989B is being re-analyzed and thus that SN was excluded.121212The SN has been identified as a light echo candidate (Boffi et al. 1999). As published, the late light curve of SN 1989B is more than 1m brighter than the suggested models and is the singular exception to the trends seen in the other SNe. All three sub-classes are better sampled from 50d -150d than after 150d.
The phenomenon studied in this work is the evolution of the light curves at late epochs. For this reason, a relative magnitude scale has been employed rather than an absolute or apparent magnitude scale. All SNe have been normalized to have zero magnitude at 65d post-explosion (assuming an 18d rise-time for all sub-classes). The initial motivation for the 65d normalization date was based upon the suggestion in Pinto & Eastman (2000) that the photon diffusion time-scale becomes negligibly short at roughly that time. As the next section shows, a high level of homogeneity exists within the multi-band photometry of each sub-class after 65d. Additionally, the greater number of 45d -85d observations relative to later epochs makes the normalization algorithm perform better at early times. These two factors led us to retain the 65d normalization date for all data-sets, although the model-generated energy deposition rates do not fit the band photometry at 65d for any band/sub-class combination. The normalization has been performed by linear interpolation of all data between 45d and 85d. For two SNe, only a single observation existed in that interval. For those SNe, the latest pre-45d observation was used to perform the interpolation.
By treating all SNe within a given m15(B) range as a single object, we are assuming homogeneity within each luminosity sub-class. The amount of scatter about a template gives some measure of the quality of that assumption, but numerous sources of systematic errors exist to cloud that interpretation. Each SN light curve is measured relative to the host galaxy’s background light, which is unique to that SN. If the SN is near the detectability limit for that observation, the influence of the background subtraction increases in importance. The irregularity of the sampling means that highly uncertain observations are mixed throughout every epoch of the late light curves. Similarly, different telescopes, filters and detectors were used to produce this data-set, introducing additional systematic differences between individual data-points. As was shown by Suntzeff (1999), observations of the same SN by the same observer at the same site with the same class telescope can yield different photometry. The differences were found to be in excess of the quoted uncertainties. Suntzeff showed that in this optimal case, the “instrumental uncertainty” was on the order of 0.06m for the V band during the 60d -75d epoch. For the case of this mixed data-set, the uncertainties are likely to be larger. Errors in this work were also introduced by the fitting algorithm, which fit the individual light curves to the estimated 65d magnitude.
All errors discussed above have been related to estimates of the relative magnitude. As SNe are always detected at some time after the explosion, the explosion date is also somewhat uncertain. Two factors may influence uncertainties in the explosion date; 1) uncertainty of a sub-class rise-time to peak, and 2) uncertainty of the peak date. For this work, all SNe were assumed to rise to peak B magnitude in 18d regardless of the luminosity sub-class. To minimize the effect of peak date uncertainty, only SNe first observed no later than a week after maximum light were used (with the exception of SN 1992K). The determination of the peak date depends upon template fitting, so peak date uncertainties are only relative to the template used. SNe discovered before tB(max) have peak date uncertainties typically of 1d. SNe discovered post-peak have larger uncertainties. Nonetheless, as the time-scales involved in this work are on the order of tens of days, uncertainties on the order of a few days will not significantly alter these results.
4 Results
4.1 V Band
The 22 SNe included in this study are shown fit (by eye) with the delayed-detonation, Chandrasekhar mass model DD23C in Figure 3. All 22 SNe have been normalized at 65d. Three tendencies are apparent in the data. First, within each sub-class the data show remarkable homogeneity. The sub-classes are DEFINED by differences in the early light curve shape, but after 65d, there is no evidence of variations. Second, the normally-luminous and super-luminous data appear to evolve similarly, while the sub-luminous sub-class continues to fall more steeply (recall that a steep decline from peak DEFINES this sub-class). Third, the separation between the normally-/super-luminous and the sub-luminous sub-classes far exceeds the scatter within the sub-classes. This argues against a continuous transition between the sub-luminous and normally-luminous sub-classes. Unfortunately, the sub-luminous sub-class is under-sampled, so many more sub-luminous SNe need to be observed before addressing whether there exists an absolute separation of sub-classes.
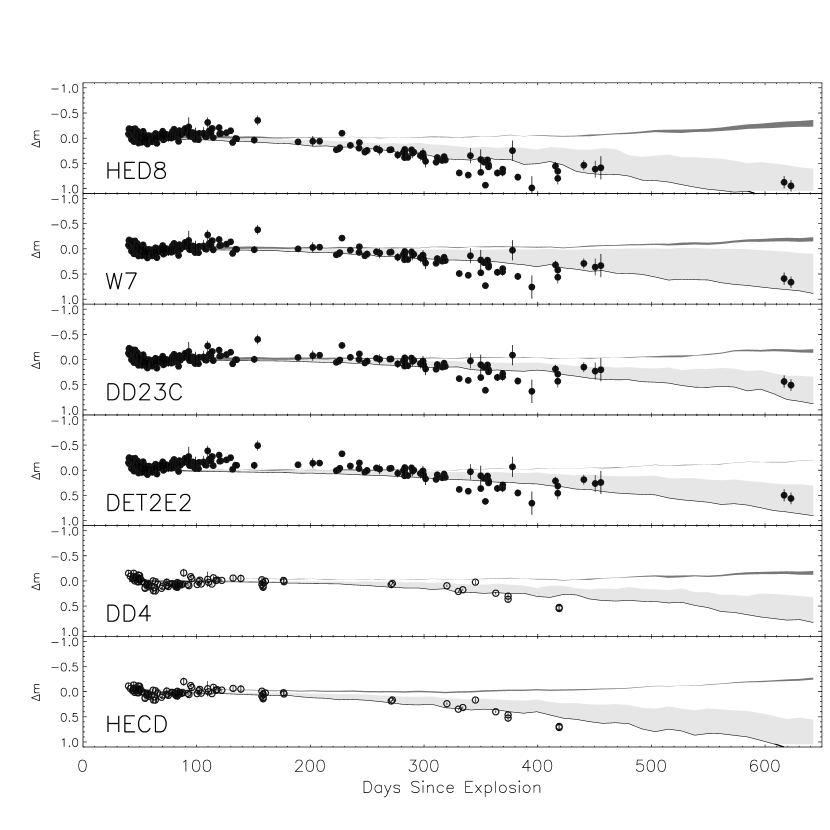
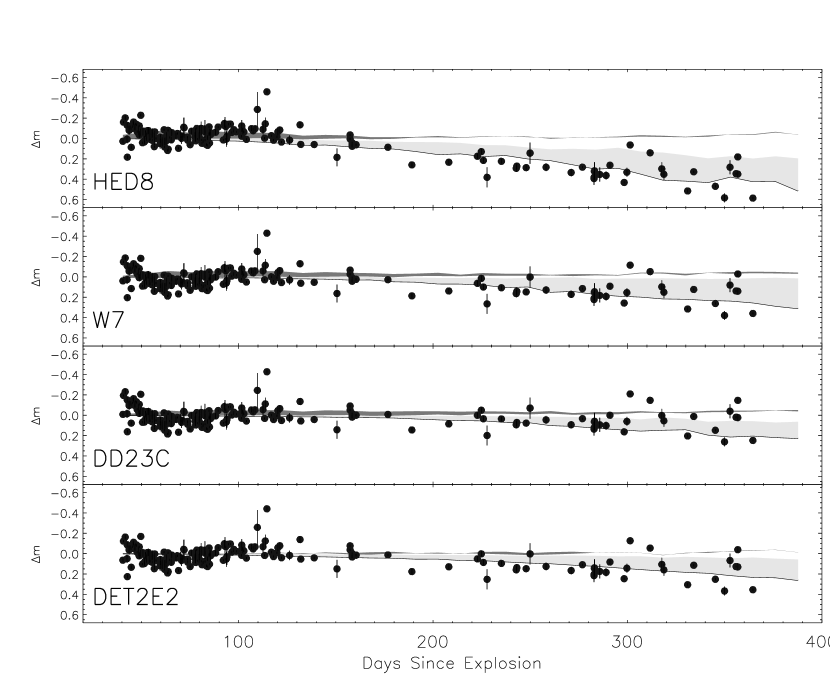
After 80d the normally-luminous and super-luminous sub-classes appear to be explainable by this model, assuming radial escape. By contrast, the sub-luminous sub-class cannot be explained by either magnetic field scenario. To improve the visualization of the 40d -120d normally-luminous and super-luminous data, in the inset of Figure 3 we show the data as residuals relative to the model curve. The similarities between the normally-luminous and super-luminous data-sets is apparent. Also apparent in the inset are the failure of the model light curves to fit the V band data in detail until after 120d. These results are not specific to the delayed-detonation, Chandrasekhar mass model, DD23C. Shown in Figure 4 are six models suggested to explain normally-luminous and super-luminous SNe, shown in the “delta magnitude” format.131313The delta magnitude format shows the residuals of the data and model-generated light curves to the instantaneous deposition approximation, in units of magnitude. The models are defined in Table 1. All model light curves show the same fundamental structure, with the models fitting the data after 170d and suggesting positron escape. The Chandrasekhar mass models fit the normally-luminous data better than does the sub-Chandrasekhar mass model, but the improvement is modest. As was discussed in MTL, the super-luminous model light curves are similar, both to other super-luminous SN models and to normally-luminous Chandrasekhar mass model light curves. We assert that the 16 normally- and super-luminous SNe do not need to be differentiated into distinct sub-classes after 60d. We further assert that if the V band emission scales with the bolometric emission to the level of a few tenths of a magnitude, then the late emission from all 16 SNe can be suitably explained with a single light curve featuring positron escape, and that Chandrasekhar mass, sub-Chandrasekhar mass, and merger explosions can all explain these data.
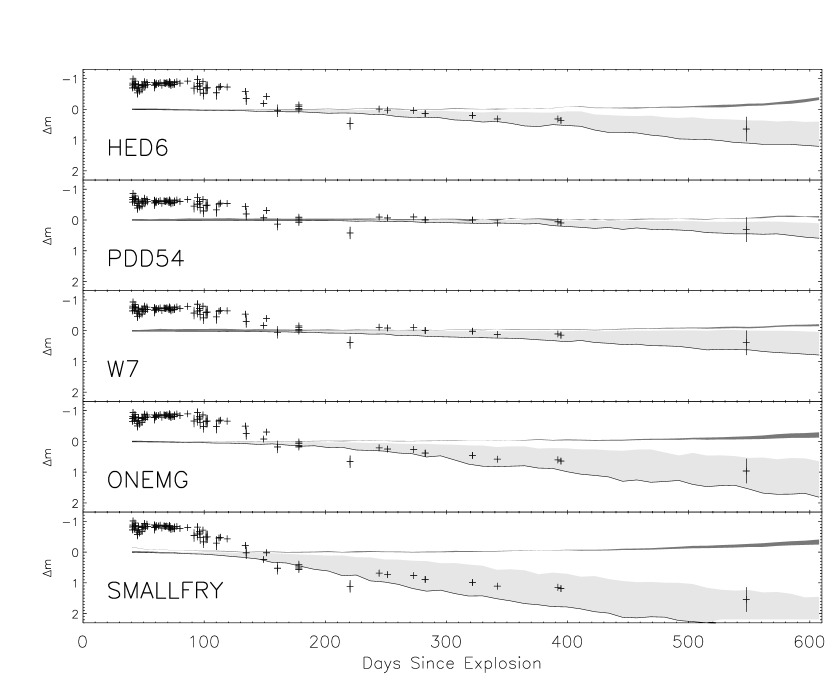
It is apparent from Figure 3 that the sub-luminous sub-class differs considerably from the normally-/super-luminous sub-classes. MTL concluded that none of the models they tested could explain the 60d -560d evolution of the light curves. One interpretation of that result is a rejection of both the Chandrasekhar mass and the sub-Chandrasekhar mass models tested. A different interpretation would be the failure of the assumption that the energy deposition rate scales with the V band during that epoch. Figure 5 shows five sub-luminous models fit to the sub-luminous sub-class data. The models are normalized to fit the data at a later epoch (170d). It is clear from the figure that none of the models can explain the V band data before 150d.141414The fifth panel (lowest) is an accretion-induced collapse model, which ejects 0.2 M⊙ of material. The model was created by scaling ONeMg to 0.2 M⊙. This model is included upon the suggestion of Fryer et al. (1996,1999) that AIC’s may explain sub-luminous SNe Ia. Even at this extremely low mass, the early escape of positrons is not enough to reproduce the steepness of the 65d -170d light curve. After 150d, the V band data can be suitably explained by all models if positron escape is assumed.151515 It is important to note that the range of ionizations allowed lead to fairly thick curves for low-mass models, which exaggerates the visual impression of their ability to explain the data. A treatment of the level of ionization would reduce the range to a single curve. This latter interpretation implies that the energy deposition rate scaling with the V band occurs later for the sub-luminous sub-class than for the other sub-classes. For this interpretation to be correct, there must be an explanation which is consistent with the spectral observations, which suggest that sub-luminous SNe Ia enter the nebular phase earlier than normally-luminous or super-luminous SNe Ia (Mazzali et al. 1997).
4.2 BVRI Bands
In the previous section, we fit model-generated energy deposition rates to V band data. That procedure relies upon the assertion that the V band traces the bolometric luminosity. For the normally-/super-luminous data-set, the data are approximately fit with the models, suggesting a validation of that assertion. By contrast, for the sub-luminous data-set the models could not fit the data until a later epoch. All SNe Ia used in this study were also observed in the B, R and I bands. By independently fitting these data-sets to the model-generated energy deposition rates, we further explore the nature of the late-time emission from SNe Ia.
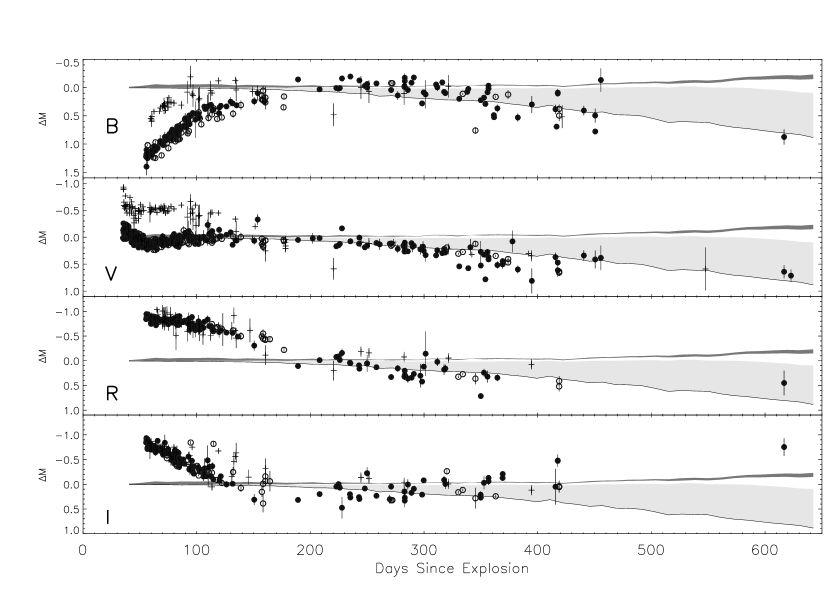
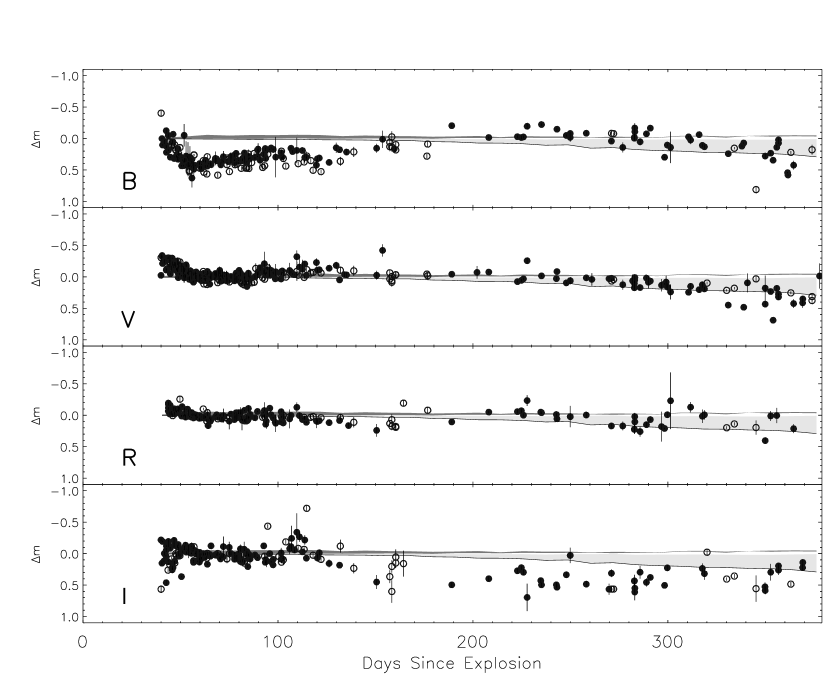
Shown in Figure 6 are the BVRI data-sets for SNe Ia fit to the model, W7. Within each sub-class the data has been normalized to 65d. Each sub-class has then been independently fit to the model light curves. For all four photometric bands, the normally-luminous and super-luminous light curves are similar. The B band data for the normally-luminous and super-luminous SNe Ia deviate considerably from the model before 100d, but by 170d they roughly scale with the energy deposition rate. The B band data for the sub-luminous sub-class differ from the normally-luminous and super-luminous sub-classes early, but appear similar at late times. Perhaps the most striking results are in the R and I bands, where the three sub-classes are quite similar. We argue that the differences between the late evolution of the B and V band data do not carry over to the longer wavelengths. The model fits initially deviate from the R and I band data for all three sub-classes, but then converge upon the model curve by 170d. The convergence in the I band is less certain due to scatter.
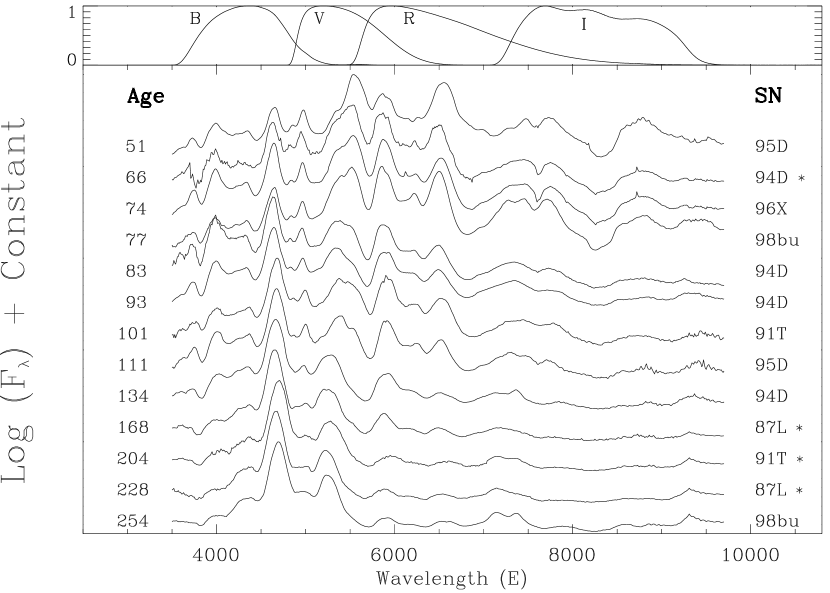
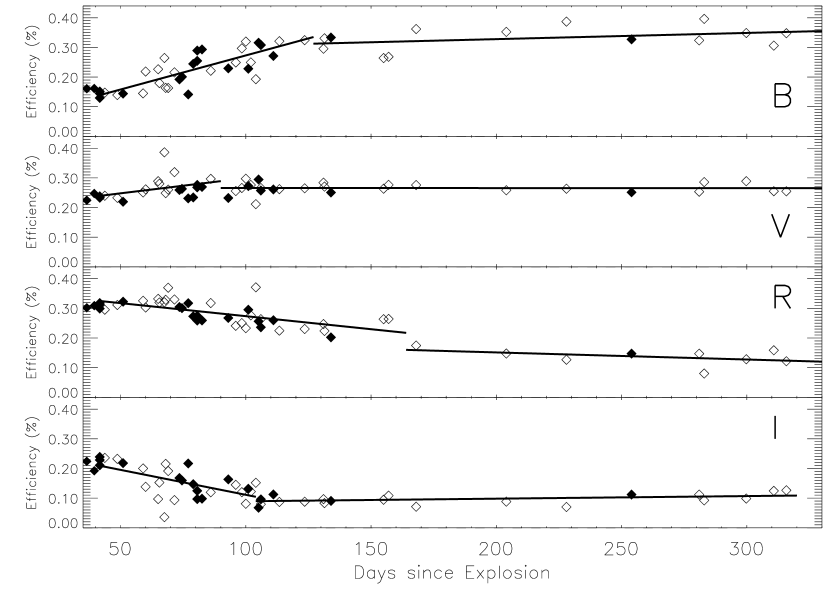
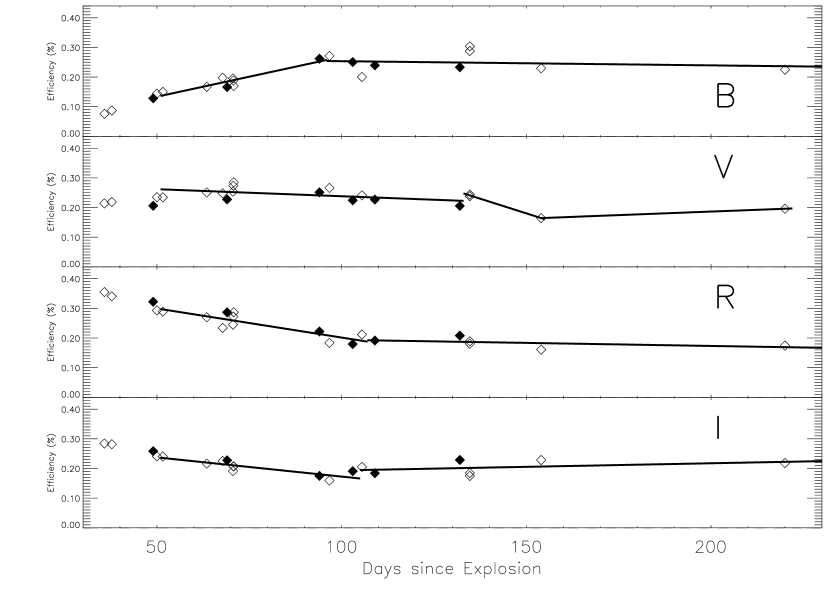
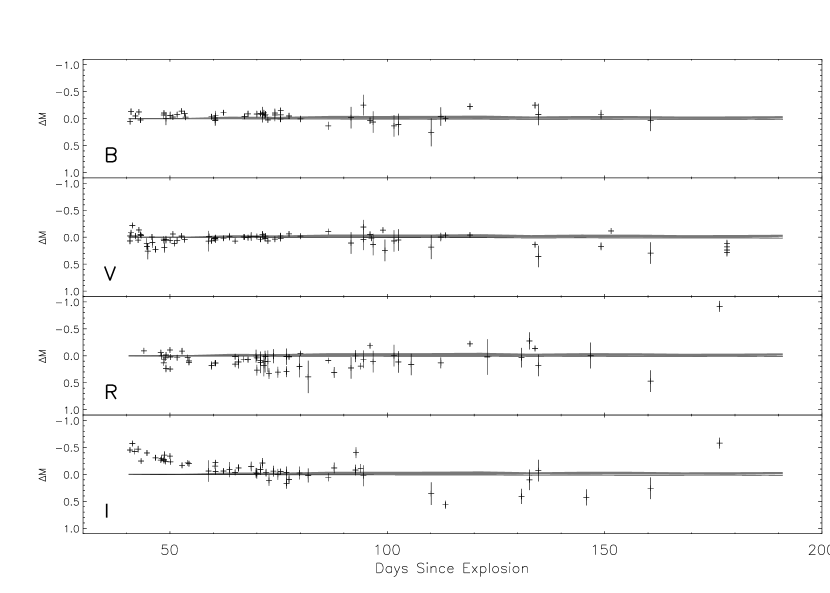
It is interesting to note that the onset of the energy deposition scaling with the photometry (170d) occurs later than the transition from photospheric continuum emission to nebular emission (60d) for all three SN Ia sub-classes and all four photometric bands. To determine whether this delay is explainable as a consequence of color evolution, we produce spectral templates for normally-/super-luminous and sub-luminous SNe Ia. The templates have been created from a collection of SN Ia spectra; 1994D (Patat et al. 1996; Turatto 2000; Filippenko 1997), 1991T (Filippenko et al. 1992), 1996X (Salvo et al. 2001), 1991bg (Turatto et al. 1996; Ruiz -Lapuente et al. 1993), 1987L (Ruiz -Lapuente et al. 1993), 1994ae (Bowers et al. 1997), 1998de (Modjaz et al. 2000), 1998bu (Jha et al. 1999; Matheson 2000), 1995D (Matheson 2000), 1981B (Branch et al. 1983), 1984A (Branch 1987), 1991F (Gomez & Lopez 1995), 1992A (Kirshner et al. 1992). We include all emission within the 3500Å-9700Å wavelength range, and ignore all emission outside of this range. Spectra that do not span that range have been linearly interpolated from earlier and later spectra.161616The interpolation was performed in two steps. The shape of the interpolated portion was determined from the two complete spectra adjacent in time. That shape was then spliced to the existing portion. The spectral sequences for a sampling of each sub-class are shown in Figures 7 and 8. From these templates, we have determined the evolution of the “filter efficiency”, or the fraction of the energy emission in the 3500Å-9700Å wavelength range that is detected by each band. The filter efficiencies for normally-luminous and super-luminous SNe Ia, shown in Figure 9, match the shape of the residuals of the data-model fits shown in Figure 6 for the normally-/super-luminous data-set. The V band filter efficiency remains nearly constant, in agreement with previous assertions that the V band scales with the bolometric luminosity.171717Contardo et al. (2000) arrived at a similar result. Shown in Figure 10 are the B,V,R and I band data fit to the model W7, after deriving bolometric corrections from these filter efficiencies. The data for all four bands are suitably explained by the energy deposition rates of the model if positron escape is assumed. Before 60d, the B,V and I data vary dramatically from the energy deposition rates. This would be consistent with the decrease to negligible values of the photon diffusion time-scale, as suggested by Pinto & Eastman (2000a). The correction lessened, but did not completely remove the residuals from the B and V band data during the 60d -170d epoch. It is unclear whether the residuals remain due to a modest failure of this relatively crude bolometric correction calculation, or rather they remain because this treatment has ignored some physical phenomenon.
The application of these corrections essentially creates bolometric light curves from each photometric band. A single bolometric light curve for normally- and super-luminous SNe Ia was generated by combining the four curves shown in Figure 10 after weighting each curve according to the photometry errors. The resulting bolometric light curve can be compared with model-generated light curves. These comparisons, shown in Figure 11, exhibit the same tendencies that are seen in the V band; the energy deposition rates for all four models are consistent with the data, and positron escape is suggested. These curves differ slightly from the bolometric light curve derived by Contardo et al. (2000) from much of the same data. That study was primarily concerned with emission near the luminosity peak and assumed constant bolometric corrections at late times ( 130d). As we have shown that some evolution occurs during the 60d - 200d time period, we assert that this bolometric light curve is more accurate at late times than the light curve from Contardo et al. (2000). Although bolometric light curves include information from four photometric bands rather than simply from the V band, the V band is the best observed. Thus, we present the bolometric light curve primarily to demonstrate that conclusions derived from studies of the V band shape are valid.
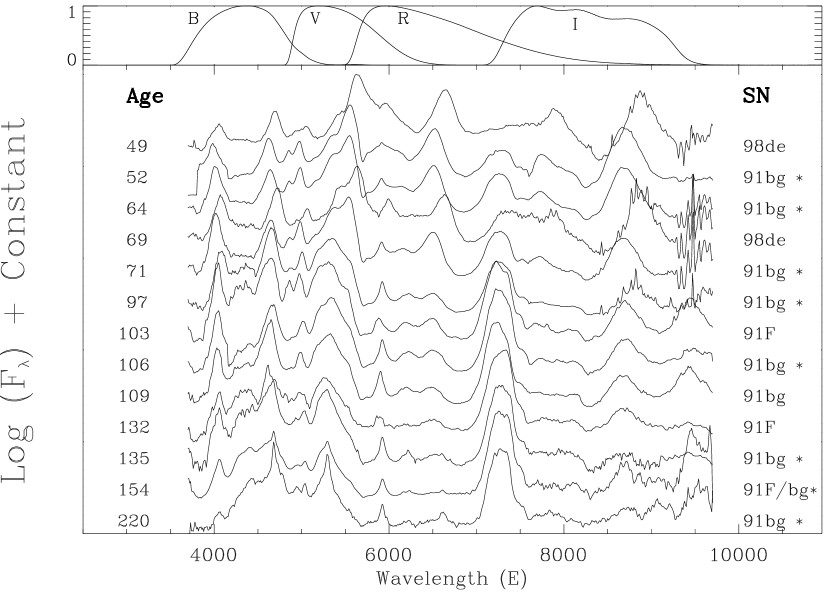
There are few nebular spectra for sub-luminous SNe Ia, so for this sub-class, the filter efficiencies are very crude and are undersampled after 150d (Figure 12). This is problematic, because as shown in Figure 6, the 100d -200d time-span is a critical transitional epoch. Nonetheless, as shown in Figure 13, the B,V,R and I band data are also fairly sparse and can be roughly explained with the model PDD54, after correcting for filter efficiency. All four bands fit the energy deposition rates better with the correction, as seen through comparison with Figure 6. There are large residuals in the V and I bands before 50d. This is likely due to photon diffusion delays. It is evident in Figure 13 that the light curves of sub-luminous SNe Ia are consistent with model-generated energy deposition rates which allow positron escape. More spectral and photometric data of sub-luminous SNe Ia need to be collected to further the understanding of this epoch. Due to the crudeness of the bolometric corrections, a bolometric light curve was not generated for the sub-luminous sub-class.
The success of the bolometric corrections in reducing the residuals during the 60d -170d time-span suggests the existence of an epoch during which optical emission is instantaneously recycled, but the SN color continues to evolve. A possible explanation for this color evolution is the decay of 56Co to 56Fe. It is during the 65d -170d epoch that the daughter becomes the dominant species in that decay. As shown by both Liu et al. (1997a,c) and Bowers et al. (1998), cobalt emission dominates the wavelength ranges observed with the R and I bands. As 56Co decays to 56Fe, these bands would fade faster than the energy deposition rate due to color evolution until late-times at which time most cobalt has decayed and iron and stable nickel dominate the spectrum in that wavelength range. In the V band wavelength range, both Co and Fe lines are present and the bolometric correction would change only slightly during the transition. The B band may brighten due to the increased emission from the many [FeII] lines from 446nm -456nm. This explanation can be tested through comparisons of model-generated spectra with observations made during this epoch.
5 Discussion
Two tasks comprised this work. The first task was the compilation of a data-set of B,V,R,I photometry of type Ia SNe divided into sub-classes, and development of bolometric correction factors for each band. The second task was the generation of late-time light curves from SN Ia models and the fitting of these models to the compiled data-set. Certain findings can be derived from this study independent of the model-fitting, and are worthy of mention. We have demonstrated that there is order to the late light curves. The late B and V band light curves of sixteen normally- and super-luminous SNe follow a similar evolution, while those of six sub-luminous SNe follow a different evolution. By contrast, the late R and I band light curves of all 22 SNe Ia follow a similar evolution. The normally-/super-luminous sub-classes appear virtually identical although they span more than half of the m15(B) range of SNe in this study. The B and V band light curves of the sub-luminous SNe appear to require a distinct sub-class. Whether there are in fact SNe Ia that connect them to normally-luminous objects is an important question. This question can only be answered by observational campaigns that focus upon monitoring SNe that span the range of m15(B) values.
Comparisons of model-generated energy deposition rates with photometry in the B,V,R, and I bands reveal three epochs. There is an early epoch ( 60d), where energy deposition/photometry comparisons are invalid presumably due to the time delay between the deposition of energy and the emergence of the resultant optical emission. That epoch is followed by an intermediate epoch (60d -170d) where the bolometric light curve is fit by the energy deposition rate, but color evolution must be addressed for individual photometric bands to be fit by the energy deposition rate. This epoch is followed by a late epoch ( 170d) where the bolometric corrections are roughly constant and each individual photometric band can be fit by the energy deposition rate if positron escape is allowed for. These epochs exist for both the normally-/super-luminous sub-class, and the sub-luminous sub-class. The bolometric corrections during the intermediate epoch are better defined for the normally-/super-luminous SNe Ia than for the sub-luminous SNe Ia, the latter corrections are preliminary.
Collectively, the light curves of SNe Ia after 60d suggest that the interactions of the products of the 56Co 56Fe decay with the ejecta can explain the energy deposition without any additional energy deposition source. Positrons are seen to escape the ejecta in quantity for all SNe Ia during the late epoch. These findings hold for Chandrasekhar mass, sub-Chandrasekhar mass, merger and AIC models equally. The model independence of these results does not imply that the late emission from SNe Ia cannot probe the progenitor. The challenge for NLTE radiation transport calculations is to reproduce the spectra during this epoch.
There are two ramifications of positron escape from SN Ia ejecta that warrant further discussion. First, nebular spectra have been used to estimate the 56Ni production in SNe Ia (Ruiz-Lapuente & Filippenko 1996, Bowers et al. 1997) and to differentiate between Chandrasekhar mass and sub-Chandrasekhar mass models (Liu et al. 1997a,1997b,1998). In all of these studies, instantaneous positron energy loss was assumed. By 300d, the energy deposition is dominated by positron slowing, and a substantial fraction of those positrons are expected to escape the ejecta in the radial scenario. Even positrons that do not escape the ejecta diffuse from the location of their creation. In light of this and other recent studies, nebular spectrum studies should be calculated with realistic positron transport. Second, positrons that escape the SN Ia ejecta are thought to survive non-thermally on time-scales of 105 years, or more (Chan & Lingenfelter 1993, Guessom, Ramaty & Lingenfelter 1991). The collective positron contributions from SNe Ia, as inferred from extra-galactic SN rates, are sufficient to generate a large fraction of the 511 keV positron annihilation radiation observed by the CGRO/OSSE, SMM and TGRS gamma-ray telescopes (Milne et al. 1999,2000). The degree of dominance is enough that accurate characterization of positron annihilation radiation will trace recent SN Ia activity in the Galaxy.
Light echoes have been detected from two SNe Ia, 1991T and 1998bu. In addition, Boffi et al. (1998) have identified SN 1989B as a light echo candidate. Of all SNe Ia observed after 300d, these three are the only SNe to remain significantly brighter than those in this work. As light echoes are currently being used as geometric distance indicators, this work suggests that the templates shown in this work may be used to locate light echoes (Sparks et al. 1999).
There remain incomplete aspects to this study. More SNe Ia need to be monitored to reduce gaps in observations and determine the late behavior of more SNe Ia along the m15(B) sequence. The exact nature of the transition from the onset of instantaneous recycling to the cessation of color evolution must be better observed spectrally and in each photometric band, particularly with sub-luminous SNe Ia. These unexplained aspects underscore the fact that much is to be learned about the physics of Type Ia SNe from late observations.
We thank P. Hőflich for ongoing access to SN models and for discussion relating to radiation transport through SN ejecta. We thank M. Turratto and S. Jha for access to SN photometry and spectra. We also thank T. Matheson, R. Lopez, and P. Meikle for SN spectra.
| Model | Mode of | M⋆ | MNi | Ekin | Ref. |
|---|---|---|---|---|---|
| Name | Explosion | [M⊙] | [M⊙] | ||
| W7 | deflagration | 1.37 | 0.58 | 1.24 | 1 |
| DD23C | delayed det. | 1.34 | 0.60 | 1.17 | 2 |
| W7DT | late det. | 1.37 | 0.76 | 1.61 | 3 |
| PDD54 | pul.del.det. | 1.40 | 0.17 | 1.02 | 4 |
| HED6 | He-det. | 0.77 | 0.26 | 0.74 | 5 |
| HED8 | He-det. | 0.96 | 0.51 | 1.00 | 5 |
| HECD | He-det. | 1.07 | 0.72 | 1.35 | 6 |
| ONeMg | AIC | 0.59 | 0.16 | 0.96 | 7 |
| SmallFry | AIC | 0.20 | 0.05 | 0.32 | 8 |
| DET2E2 | merger det. | 1.40 | 0.62 | 1.33 | 5 |
| DET2E6 | merger det. | 1.80 | 0.62 | 1.33 | 5 |
References
- (1) Aldering, G., Knop, R. & Nugent, P. 2000, AJ, 119, 2110
- (2) Axelrod, T.S. 1980, Ph.D. thesis, University of California at Santa Cruz
- (3) Bowers, E.J.C., Meikle, W.P.S., Geballe, T.R., Walton, N.A., Pinto, P.A., Dhillon, V.S., Howell, S.B., & Harrop-Allin, M.K. 1997, MNRAS, 290, 663
- (4) Burrows, A., & The, L.-S. 1990, ApJ, 360, 626
- (5) Cappellaro, E., Mazzali, P., Benetti, S., Danziger I.J., Turatto, M., Della Valle, M., & Patat, F. 1997, A&A,328, 203
- (6) Cappellaro, E., et al. 1998, unpublished
- (7) Cappellaro, E., et al. 2001, in preparation
- (8) Chan, K.-W., & Lingenfelter, R.E. 1993, ApJ, 405, 614
- (9) Colgate, S., Petschek, A.G., & Kreise, J.T. 1980, ApJ, 237, L81
- (10) Colgate, S., Fryer, C.L., & Hand, K.P. 1996, in Thermonuclear Supernovae, ed. P. Ruiz Lapuente, R. Canal, & J. Isern (Dordrecht: Academic Publishers), 273
- (11) Contardo, G., Leibudgut, B., Vacca, W.D. 2000, A&A, 359, 876
- (12) Cristiani, S. et al. 1992, A&A, 259, 63
- (13) Filippenko, A.V., et al. 1992, AJ, 104, 1543
- (14) Filippenko, A.V., et al. 1992, ApJ, 384,L15
- (15) Fryer, C., Benz, W., Herant, M., Colgate, S.A. 1999, ApJ, 516, 892
- (16) Garnavich, P.M. et al. 2000, unpublished
- (17) Gomez, G., Lopez, R. 1995, AJ, 109, 737
- (18) Hamuy, M., Phillips, M.M., Maza., J., Suntzeff, N.B., Schommer, R.A., & Avilés, R. 1995, AJ, 109,1
- (19) Hamuy, M., et al. 1996, AJ, 112, 2391
- (20) Hőflich, P., & Khokhlov, A. 1996, ApJ, 457, 500
- (21) Hőflich, P. 1995, ApJ, 443, 89
- (22) Hőflich, P., Wheeler, J. C., & Thielemann, F.-K. 1998, ApJ, 495, 617
- (23) Jeffery, D.J., Leibundgut, B., Kirshner, R.P., Benetti, S., Branch, D., & Sonneborn, G. 1992, ApJ, 397, 304
- (24) Kumagai, S., & Nomoto, K. 1997, in Thermonuclear Supernovae, ed. P. Ruiz Lapuente, R. Canal, & J. Isern (Dordrecht: Academic Publishers), 515
- (25) Jha, S. et al. 1999, ApJS, 125, 73
- (26) Leibundgut, B., Kirshner, R.P., Filippenko, A.V., Shields, J.C., Foltz, C.B., Phillips, M.M., & Sonneborn, G. 1991, ApJ, 371, L23
- (27) Leibundgut, B. & Pinto, P.A. 1992, ApJ, 401, 49
- (28) Leibundgut, B., et al. 1993, AJ, 105,301
- (29) Li, W.D., Filippenko, A.V., Riess, A.G., Treffers, R.R., Hu, J.Y., & Qui, Y.L. 2000, in Cosmic Explosions, AIP Proceedings 522, eds. S.S. Holt & W.W. Zhang, p. 91
- (30) Lira, P., et al. 1998,AJ,115,234
- (31) Liu, W., Jeffery, D.J., & Schultz, D.R. 1997, ApJ,483,L107
- (32) Liu, W., Jeffery, D.J., & Schultz, D.R. 1997, ApJ,486,L35
- (33) Liu, W., Jeffery, D.J., & Schultz, D.R. 1998, ApJ,494,812
- (34) Mazzali, P.A., et al. 1997, MNRAS, 284, 151
- (35) Milne, P.A. 1998, PhD thesis, Clemson University
- (36) Milne, P.A., Kurfess, J.D., Kinzer, R.L., Leising, M.D., & Dixon, D.D. 1999, in Proceedings of the Fifth Compton Symposium, eds. M.L. McConnell & J.M. Ryan, p. 21
- (37) Modjaz, M., Li, W., Filippenko, A.V., King, J.Y., Leonard, D.C., Matheson, T., Treffers, R.R. 2000, PASP, in press
- (38) Nadyozhin, D.K. 1994, ApJS, 92, 527
- (39) Nomoto, K., Thielemann, F.-K., & Yokoi, K. 1984, ApJ, 286, 644
- (40) Nomoto K. et al. 1996, in Supernovae and Supernova Remnants, IAU Colloquium 145, eds. R. McCray & Z. Wang, p. 49
- (41) Nugent, P., Baron, E., Branch, D., Fisher, A., Hauschildt, P.H. 1997, ApJ, 485, 812
- (42) Patat, F., Benetti, S., Cappellaro, E., Danziger, I.J., Della Valle, M., Mazzali, P.A., & Turatto, M. 1996, MNRAS,278,111
- (43) Perlmutter, S., et al. 1997, ApJ, 483, 565
- (44) Perlmutter, S., et al. 1999, ApJ, 517, 565
- (45) Phillips, M.M., et al. 1987,PASP, 99, 592
- (46) Phillips, M.M., Jacoby, G.H., Walker, A.R., Tonry, J.L. & Ciardullo, R. 1992, BAAS, 24,749
- (47) Phillips, M.M. 1997, unpublished
- (48) Phillips, M.M., Wells, L.A., Suntzeff, N.B., Hamuy, M., Leibundgut, B., Kirshner, R.P., & Foltz, C.B. 1992,AJ,103,1632
- (49) Phillips, M.M. 1993, ApJ, 413, L105
- (50) Pinto, P.A., & Eastman, R. 2000, ApJ, 530, 744
- (51) Pinto, P.A., & Eastman, R. 2000, ApJ, 530, 757
- (52) Pinto, P.A., & Eastman, R. 2000, LANL preprints, 0006171
- (53) Riess, A.G., Press, W.H., & Kirshner, R.P. 1996, ApJ, 473, 88
- (54) Riess, A.G., et al. 1998, AJ, 116, 1009
- (55) Riess, A.G., et al. 1999, AJ, 117, 707
- (56) Riess, A.G., et al. 1999, AJ, 118, 2668
- (57) Riess, A.G., et al. 1999, AJ, 118, 2675
- (58) Ruiz-Lapuente, & P., Lucy, L.B. 1992,ApJ,400,127
- (59) Ruiz-Lapuente, P., & Filippenko, A.V. 1996 in Supernovae and Supernova Remnants, IAU Colloquium 145, eds. R. McCray & Z. Wang, p. 33
- (60) Ruiz-Lapuente, P., & Spruit, H. 1997,ApJ,500,360
- (61) Salvo, M.E., Cappellaro, E., Mazzali, P.A., Benetti, S., Danziger, I.J., Patat, F., & Turatto, M. 2001, MNRAS, 321, 254
- (62) Sparks, W.B., Macchetto, F., Panagia, N., Boffi, F.R., Branch, D., Hazen, M.L., Della Valle, M. 1999, AJ, 523, 592
- (63) Suntzeff, N.B., 1996, in Supernovae and Supernova Remnants, ed. R. McCray, Z. Wang (Cambridge:Cambridge Press), p. 41
- (64) Suntzeff, N.B., Phillips, M.M., et al. 1999, AJ, 117, 1175
- (65) Tanvir, N., Shanks, T., Dhillon, V., Lucy, J., Morris, P., Knapen, J., Balcells, M., Irwin, M., Casteneda, H., & Walton, N. 1997, unpublished
- (66) Timmes, F.X., et al. 1996, ApJ, 464, 322
- (67) The, L.-S., Burrows, A., & Bussard, R. 1990, ApJ, 352, 731
- (68) Turatto, M.,Benetti, I.J., Cappellaro, E., Danziger, I.J., Della Valle, M., Gouiffes, C., Mazzali, P., & Patat, F. 1996, MNRAS, 283, 1
- (69) Watanabe, K., Hartmann, D.H., Leising, M.D., The, L.-S. 1999, ApJ, 516, 285
- (70) Yamaoka, H., Nomoto, K., Shigeyama, T., & Thielemann, F.-K. 1992, ApJ, 393, L55