On The Parent Population of Radio Galaxies and the FR I – FR II Dichotomy
Abstract
We test the hypothesis that radio galaxies are a random subset of otherwise normal elliptical galaxies. Starting with the observed optical luminosity functions for elliptical galaxies, we show that the probability of an elliptical forming a radio source is a continuous, increasing function of optical luminosity, proportional to . With this probability function and the luminosity function of normal elliptical galaxies as input to Monte Carlo simulations, we reproduce the observed distribution of radio galaxies in the radio-optical luminosity plane. Our results show that radio galaxies are a luminosity-biased but otherwise random sample of elliptical galaxies. This unified view of radio-loud and radio-quiet ellipticals also explains the well known difference of mag in average optical luminosity between FR I and FR II radio galaxies as a simple selection effect. Specifically, FR II appear preferentially in smaller galaxies because both radio and optical luminosity functions are steep, so there is a negligible probability of observing a powerful radio source associated with a bright galaxy; no intrinsic physical differences between FR I and FR II host galaxies are required.
1 Introduction
Some elliptical galaxies are radio loud — i.e., they have bright nuclear radio sources emitting W/Hz at 1.5 GHz — but most are not. Understanding the reason for this dichotomy is extremely important for fully understanding elliptical galaxies. Currently the most promising explanation for the nuclear activity is the presence of gas accretion around a massive black hole. Then either a small fraction of ellipticals have such massive objects in their center, or all have black holes but the phase of activity is short compared with galaxies lifetime.
There is growing evidence that massive black holes are present in the center of most (perhaps all) elliptical galaxies (Ho 1998; Richstone et al. 1998; van der Marel 1999; Macchetto 1999). In particular a tight correlation between bulge and black hole mass has been reported (Ferrarese & Merritt 2000; Gebhardt et al. 2000; Magorrian et al. 1998). This suggests all elliptical galaxies have the potential to become active and only those currently accreting are identified as active galactic nuclei (AGN).
It is in fact difficult to distinguish radio-loud and radio-quiet ellipticals solely from their optical properties. Regardless of the level of nuclear activity, elliptical galaxies occupy the same fundamental plane, have similar ellipticity, isophotal twists, and colors distributions (Homabe & Kormendy 1987; Ledlow & Owen 1995; Govoni et al. 2000). These results can be extended to the most active radio-loud AGN (meaning blazars, BL Lac objects, and intermediate quasars; Falomo et al. 2000; Scarpa et al. 2000; Urry et al. 2000).
There is also no clear connection between nuclear activity and the Megaparsec-scale cluster environment (Fanti 1984; Ledlow & Owen 1995), and the importance of galaxy interactions remains unclear. In particular some interacting galaxies are not associated with powerful radio sources and, conversely, some radio sources are associated with isolated galaxies. Thus, galaxy interaction may not be necessary or sufficient for transforming an elliptical galaxy into a radio galaxy, although in the former case the radio activity may not have started yet, and in the latter case, if a small galaxy were accreted the global structure of the galaxy might not have been altered significantly. Whatever the case, a necessary condition for making a radio galaxy seems to be the presence of a massive black hole, which seems to be a common feature of all galaxies.
There has been speculation that the central black holes of radio-loud and radio-quiet AGN differ in some quantized way. For example, perhaps black hole spin determines whether an AGN forms a radio source (with spin) or does not (Rees 1997; Wilson & Colbert 1995). Yet recent work argues against this standard view of radio sources as “on” (radio-loud) or “off” (radio-quiet). Indeed radio-selected quasars occur at all levels of radio-loudness, with no apparent bimodality (White et al. 2000).
In this paper we test the possibility that all elliptical galaxies can host radio sources of any power or radio class. We use Monte Carlo simulations to see whether observed samples of radio galaxies can be random selections of elliptical galaxies; that is, whether it is possible to find a direct link between the optical luminosity functions of radio-quiet and radio-loud galaxies. A somewhat similar approach to unifying AGN was first discussed by Rowan-Robinson (1977), although at that time there was less information about the optical luminosity function of ellipticals than we have now.
We start by noting that ellipticals of different size might well have different probabilities of forming strong radio sources, as was first deduced by Rowan-Robinson. The bright end of the optical luminosity function (LF) is so steep that for every galaxy with mag, there are galaxies with mag, yet in complete samples of radio sources (Ledlow & Owen 1996; Govoni et al. 2000) a roughly constant number of radio galaxies is observed between mag. This indicates that the probability of observing radio emission from a galaxy increases strongly with its optical luminosity, . The LFs of radio-quiet and radio-loud galaxies then have to be linked by a probability function, , whose functional form can be derived from observations.
The goal of this work is to reproduce the optical LF of radio galaxies only, not to describe their radio properties. Nevertheless, making additional assumptions about the radio LF and the division between FR I and FR II galaxies, the simulated distribution of radio galaxies in the radio-optical luminosity plane compares well with actual radio galaxy samples. A result that will be used to propose an explanation for the well known difference in optical luminosity between FR I and FR II radio galaxies (Fanaroff & Riley 1974); FR I being systematically brighter than FR II by magnitudes (Owen & Laing 1989; Ledlow & Owen 1996; Smith & Heckman 1989; Govoni et al. 2000).
We outline the basic assumptions and calculations in the next section and derive the probability function in § 3. Then we compare the predictions of this scenario with the observed data in § 4, and summarize our conclusions in § 5.
2 Basic Assumptions
Using a statistical (Monte Carlo) approach, we investigate the possibility that all elliptical galaxies may host a radio source of arbitrary power. We start with the following general assumptions based on the available empirical results for radio galaxies.
-
1.
The distribution of elliptical galaxies in optical luminosity, , is given by a Schechter luminosity function:
(1) where sets the slope of the LF at the faint end, gives the characteristic luminosity above which the number of galaxies falls sharply, and (in units of galaxies Mpc) sets the overall normalization of the galaxy density.
-
2.
All elliptical galaxies of all optical luminosities have the potential to be radio sources, with a probability proportional to some power of their optical luminosity: . sets the overall normalization of the function, and is dimensionless.
-
3.
Regardless of their optical luminosity, once activated, all ellipticals produce radio sources with the same power-law distribution (in units of ). Note that only the shape of the radio LF is used, the normalization being set automatically by the optical LF.
-
4.
In the radio-optical luminosity plane, FR I and FR II are separated by a transition line roughly proportional to , with normalization depending on the frequency under consideration. Here we use (following Ledlow & Owen 1996; normalized for R-band luminosity).
An implicit assumption is that the active phase lasts on average the same time in all ellipticals; otherwise, we would have to include an explicit dependence of duration or duty-cycle on some property of the elliptical galaxies. Since the activity phase is driven by the availability of gas close to the nucleus rather than the global size of the galaxy, we believe this implicit assumption is reasonable.
From points (1) and (2), the number of radio galaxies with optical luminosity is the product of the optical LF times the probability :
| (2) |
which is a Schechter function with exponent . From the bivariate LF we know that approximately , that is (Ledlow & Owen 1996). Because of this strong dependence on , is sharply peaked around mag (Fig. 1), so the number of radio sources in dim galaxies is very small despite the huge number of such galaxies. This is the effect of ; without such a steep dependence on optical luminosity, the vast majority of radio sources would be associated with small/faint optical galaxies.
Assumptions (1) and (2) alone are already sufficient to determine the value of necessary to link the luminosity functions of radio-quiet and radio-loud galaxies (see next section). We can go further, however, and test the model against known properties of radio galaxies (hence assumptions 3 and 4). The final distribution of radio sources in the radio-optical luminosity plane is given by the product of times the function , which is assumed to be the same for all optical luminosities (point 3).
Once a random set of values has been extracted from equation (2), these “radio galaxies” are divided into FR I and FR II according to point (4). No specific physical meaning is assigned to the two types of radio sources. In particular, the slope of the dividing line is not related to the slope of the probability function ; we simply use it to divide the two classes so that the average optical luminosities of each can be derived.
To actually compare predicted and observed counts of radio sources, it is necessary to fold in the different volumes over which a source of a given radio flux can be observed. Most surveys are flux limited, so that bright sources are preferentially discovered. For radio sources, the limiting volume comes usually from the radio flux. If is the radio flux limit of the survey at a give frequency, and the power of a radio source at the same frequency, then this radio source could be observed out to a luminosity distance of:
| (3) |
from which we obtain the volume over which the sources of power can be discovered. The K correction, , appropriate to a power-law spectrum , has been also included111Due to the stochastic nature of the Monte Carlo simulation, the modest flux correction due to the K correction has only a minor effect, if any, on our result.. At low redshift the volume increases as , strongly favoring powerful sources. At higher redshift increases less rapidly than in the Euclidean case, depending on the adopted cosmology.
Combining all previous equations, the total number of FR I galaxies expected in a flux limited survey is:
| (4) |
where is the transition power from FR I to FR II (itself a function of ). A similar expression with integration limits from to gives the number of FR II galaxies.
In the previous equations there is only one free parameter, the exponent describing the probability of observing radio emission from an elliptical galaxy, , all other quantities being taken from the literature. The slope of the radio luminosity function (Auriemma et al. 1977; Toffolatti et al. 1987; Urry & Padovani 1995; Ledlow & Owen 1996) is well defined, (for in units of Mpc; it would be in units of Mpc). For the optical LF we use mag (in the Cousins R band; H km/s/Mpc; q) and , as found for elliptical galaxies in the Stromlo-APM experiment (Loveday et al. 1992). Other authors have found slightly different values for and (Muriel et al. 1995; Lin et al. 1996; Zucca et al. 1997), and there is also some freedom in the location of the FR I–II transition line. We will later investigate the effect of changing these values.
3 Constraining the Probability Function
The normalized cumulative distribution of radio galaxies in optical luminosity is obtained by integrating equation (2) (which is based only on assumptions 1 and 2): it is an incomplete gamma function, . Both constants and cancel out, leaving as the only free parameter, which can be derived from fitting observed optical magnitudes for radio galaxies.
We collect three well-studied samples of radio galaxies to which we can fit this distribution (see Fig. 2). However, the three observed distributions are not internally consistent: according to a K-S test, the probability that they are drawn from the same parent population is only %. Therefore, no one model (or one value of ) can explain all three simultaneously. There are many reasons why these samples may differ, including the different photometric systems used; magnitudes integrated over different apertures, with different assumptions about the light distributions; different extinction and K corrections applied; and different telescopes/instruments used. Therefore, to obtain a robust estimate of the true optical luminosity distribution of radio galaxies, we combined the data from all three works. This combined distribution is plotted in Figure 3, together with the incomplete gamma function for , determined using a maximum likelihood approach. Fitting the three samples of radio galaxies individually yields values for within this interval.
Changing or in the optical LF for elliptical galaxies will force a change in . The sum enters in the gamma function, so any variation of can be compensated by an equal and opposite variation of , without affecting any other results presented here. Changing , or equivalently , has the effect of changing the slope of the theoretical cumulative distribution. A brighter gives a steeper distribution (compared to the one in Fig. 3) which would actually agree better with observations. For mag, the best fit is obtained for . For fainter the distribution becames flatter and the statistical agreement with the data becomes worse. For mag we get . To the extent that the luminosity function of elliptical galaxies is uncertain, we can not know precisely.
4 Comparison with Observed Radio Samples
Having fixed , we now make use of assumptions (3) and (4) and Equation 4 to populate the radio-optical luminosity plane, and to compare our result with data from flux-limited radio surveys.
4.1 An Illustrative Comparison with a Large Radio Galaxy Sample
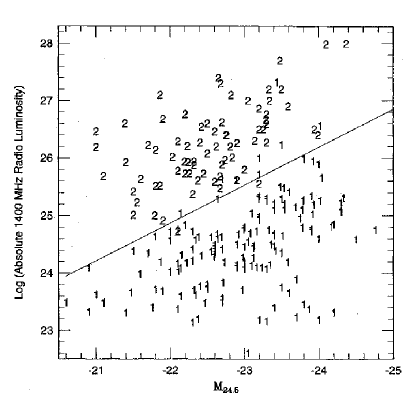
Figure 4 shows the observed distribution for a heterogeneous collection of radio galaxies from Ledlow & Owen (1996), compared to a representative Monte Carlo simulation for a sample of 200 radio galaxies from a complete survey to a flux limit of 0.1 Jy at 1.4 GHz, with no redshift limit and . Our simulation nicely reproduces the almost uniform coverage of the plane in the region mag and W/Hz, with maximum concentration around the center of this region.
This sample is not statistically complete, so there is no point in doing a formal statistical comparison with our simulated data. We present it as an illustrative case, to show that radio sources cluster in this area of the plane. There are four reasons for this:
-
•
Brighter galaxies do not exist in the volume sampled because of the steepness of the optical luminosity function at the bright end.
-
•
No radio galaxies are observed fainter than mag because the function decreases rapidly at low optical luminosities.
-
•
The minimum observed radio power is set by the radio flux limit of the survey and by the limited volume over which these faint objects can be discovered. Decreasing the flux limit results in extending toward lower radio power the region populated by observed radio galaxies.
-
•
The maximum observed radio power is set by the rapidly decreasing probability of having luminous radio sources, i.e., by the steepness of the bright end of the radio luminosity function.
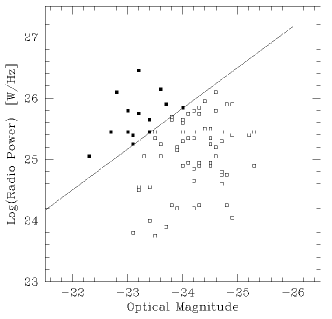
4.2 Comparison with a Volume-Limited Radio Galaxy Sample
A well-defined sample of radio galaxies has been studied by Fasano Falomo & Scarpa (1996), with final results presented by Govoni et al. (2000). The original sample includes all radio galaxies with a certain area of the sky, in the redshift range down to a flux limit, at 2.7 GHz, of 2 Jy for part of the sample and 0.25 Jy for the rest. The average Cousin R magnitudes are mag for the whole sample, and mag and mag, for the FR I and FR II sub-classes, respectively.
In Figure 5 we show the results from a Monte Carlo simulation for the appropriate flux limits and redshift range. The agreement is quite good: in more than 80% of a set of 100 simulations, a two-dimensional K-S test indicates the two samples are statistically indistinguishable (i.e., probability they are from different populations %).
The Govoni et al. sample includes both FR I and FR II, so we can study the cumulative distributions separately. The simulated data follows exactly the observed distribution for each type, with the same offset in optical luminosity of mag (Fig. 6). Similar results were found in all 100 Monte Carlo simulations we ran.
The apparent difference in host galaxy magnitude is essentially a selection effect, due to the steepness of the radio and optical luminosity functions combined with the diagonal separation between FR I and II in the radio-optical luminosity plane. As described in § 4.1, the radio galaxy density in the plane is modulated by the radio luminosity function (more sources at low power); in the optical plane, it is centrally peaked because the optical luminosity function (more sources at faint magnitudes) is multiplied by the probability of having a radio source (which increases as ). Given the diagonal division, then, FR II can have relatively modest radio powers (so there are relatively more of them) when found in fainter galaxies, shifting their mean optical magnitude toward the left. In contrast, FR I are more common in brighter galaxies, where they can span a larger range of radio power; thus their mean optical magnitude shifts to the right.
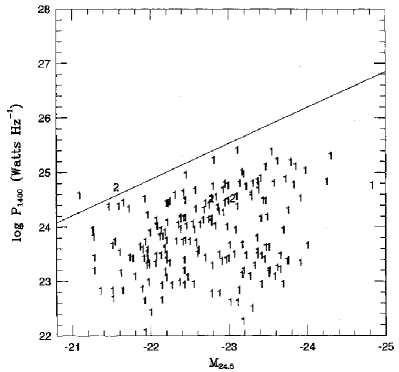
4.3 Comparison to a Cluster-Based Radio Galaxy Sample
Ledlow & Owen (1996) presented radio and optical luminosities for a sample of 188 radio sources found in Abell clusters; the sample is complete to for radio flux greater than 0.01 Jy at 1.4 GHz. In Figure 7 we compare the observed data to a representative simulation for a survey reaching the same radio flux and including the whole volume out to the same redshift limit. The exponent of the probability function was fixed at .
In both real and simulated data there are no very bright radio sources because of the limited volume surveyed. In particular, essentially all simulated radio galaxies lie below the transition line and should be FR I, as observed by Ledlow & Owen (1996).
However, a formal two-dimension K-S test gives a probability of only % that the two sample are from the same population, and the probability remains below few percent in all the simulations we did. Basically, our simulations produce brighter galaxies than observed in the real data. Better agreement between observed and simulated data can be obtained setting , which is well within the uncertainty. In this case, the two samples are statistically indistinguishable 20% of the times.
It is not clear if this result reflects the failure of one or more of our basic assumptions or if some systematic effects are playing a role. For instance, the selection function for Abell clusters may weight the volume sampled by Owen & Ledlow in a way we do not take into account. In addition, radio sources in clusters may not be a representative subset of galaxies everywhere, just as galaxies themselves can be different in clusters and in the field. For example, galaxies in clusters may have undergone more mergers, on average, so that their luminosity distribution deviates from the optical LF we are using. It is not clear whether these effects could make the observed properties of this radio galaxy sample different from our simulation and from the other radio galaxy samples.
5 Discussion and Conclusions
We have shown that the optical luminosity function of radio galaxies is consistent with their having been drawn from a parent population of normal elliptical galaxies, weighted by the function .
This conclusion depends only on the optical luminosity function of ellipticals and the slope of the weighting function. This implies that any elliptical galaxy has a finite probability of forming a radio source, with more luminous galaxies being more likely to be radio-loud than faint galaxies.
Comparing the derived optical luminosity distribution for radio galaxies with a combined sample from the literature we constrain the slope to be . This result depends somewhat on the adopted luminosity function for elliptical galaxies (see § 3).
We then used Monte Carlo simulations to show that under quite general assumptions — that radio and optical powers are independent and that the separation of FR I and FR II galaxies is a diagonal line in the radio-optical plane — simulated samples of radio galaxies match well the properties of observed samples. The agreement with data Govoni et al. (2000) is excellent, while the match with the cluster-based sample of Ledlow & Owen (1996) is qualitatively similar but quantitatively less good, perhaps because of the cluster selection.
This implies a continuity of radio and optical properties from normal elliptical to radio galaxies. That is, there is no clear separation between radio-loud and radio-quiet ellipticals, at any fiducial optical luminosity or radio power. Moreover, our result is consistent with a picture in which FR I and FR II radio sources are hosted by galaxies extracted from the same parent population. No intrinsic differences are necessary to explain the well known difference of mag in optical magnitude between the two classes of radio galaxies. This is due to the transition region being an increasing function of the optical luminosity, which is probably due to the way the plasma propagates through the interstellar medium (Bicknell 1995) and does not imply any peculiarity in the host galaxy. So we conclude that the apparent difference in observed optical magnitude is just a consequence of the probability density contours in the plane.
The main conclusion from this work is that available data are consistent with the hypothesis that normal elliptical galaxies are the parent population of elliptical radio galaxies. The physical interpretation for this continuity of elliptical galaxy properties across all radio powers is that all ellipticals have a central black hole and therefore have the potential to generate radio sources. This hypothesis is supported by increasing empirical evidence for the existence of massive black holes in the cores of nearby elliptical galaxies (Kormendy & Richstone 1995; Richstone et al. 1998; van der Marel 1999; Macchetto et al. 1999). Once the radio source is created, its power should depend on the accretion rate and the black-hole mass. Though the latter is found to be proportional to the galaxy total mass (Ferrarese & Merritt 2000, Gebhardt et al. 2000), the former should depend on the availability of gas and stage of development of the accretion activity. It is not too surprising, therefore, that the radio power is largely independent of the magnitude of the host galaxy.
The fact that very often radio galaxies exhibit a disturbed optical morphological or are found in interacting systems is not an exclusive properties of radio galaxies, but rather a common behavior of giant ellipticals, and indeed many interacting galaxies or galaxies with peculiar morphology are known not to be radio sources. Thus we conclude that the present results explain nicely an important characteristic of radio-loud and radio-quiet ellipticals, namely that they can not be distinguished solely based on optical observations (e.g., Ledlow & Owen 1995; Govoni et al. 2000).
References
- (1)
- (2) Auriemma C., Perola G.C., Ekers R., Fanti R., Lari C., Jaffe W.J. & Ulrich M.-H. 1977, A&A 57, 41
- (3) Bicknell G.V. 1995, ApJS 101, 29
- (4) Falomo R., Scarpa R., Urry C.M. & Treves A. 2000, ApJ 542, 731
- (5) Fanaroff B.L. & Riley J.M. 1974, MNRAS 167, 31P
- (6) Fanti R. 1984, in Cluster and Groups of Galaxies, ed. F. Mordirossian, G. Giuricin, M. Mezzetti (Reidel, Dordrecht), p. 185
- (7) Fasano G., Falomo R. & Scarpa R. 1996, MNRAS 282, 40
- (8) Ferrarese L. & Merritt D. 2000, ApJ 539, L9
- (9) Gebhardt, K., Bender R., Bower G., et al. 2000, ApJ 539, L13
- (10) Govoni F., Falomo R., Fasano G. & Scarpa R. 2000, A&A 353, 507
- (11) Ho L.C. 1998, in “Observational Evidence for Black HOles in the Universe”, S.K. Chakraberti, ed. Kluwer, p.157
- (12) Homabe M. & Kormendy J. 1987, in “Structure and Dynamics of Galaxies”, IAU symp. N. 127, p. 379, ed. de Zeeuw, Reidel, Dordrecht.
- (13) Kormendy J. & Richstone D.O. 1995, ARA&A 33, 581
- (14) Ledlow M.J. & Owen F.N. 1995, AJ 109, 853
- (15) Ledlow M.J. & Owen F.N. 1996, AJ 112, 9
- (16) Lin H., Kirshner R.P., Shectman S.A., Landy S.D., Oemler A., Tucker D.L. & Schechter P.L. 1996, ApJ 464, 60
- (17) Loveday J., Peterson B.A., Efstathious G. & Maddox S.J. 1992, ApJ 390, 338
- (18) Macchetto F.D. 1999, Ap&SS 269, 269
- (19) Magorrian J., Tremaine S., Richstone D. et al. 1998, AJ 115, 2285
- (20) Muriel H., Nicotra M.A. & Lambas D.G. 1995, AJ 110, 1032
- (21) Owen F.N. & Laing R.A. 1989 MNRAS 238, 357
- (22) Rees M.J. 1997, RvMA 10, 179
- (23) Richstone D., Ajhar E.A., Bender R. et al. 1998, Nature 395, 14
- (24) Rowan-Robinson, M. 1977, ApJ, 213, 635
- (25) Scarpa R., Urry C.M., Falomo R., Pesce J.E. & Treves A. 2000, ApJ 532, 740
- (26) Smith E.P. & Heckman T.M. 1989, ApJ 341, 658
- (27) Toffolatti L., Franceschini A., Danese L & de Zotti G. 1987, A&A 184, 7
- (28) Urry C.M. & Padovani P. 1995, PASP 107, 803
- (29) Urry C.M., Scarpa R., O’Dowd M., Falomo R., Pesce J.E. & Treves A. 2000, ApJ 532, 816
- (30) van der Marel R. 1999, AJ 117, 744
- (31) White, R. L., et al. 2000, ApJS, 126, 133
- (32) Wilson A.S. & Colbert E.J.M. 1995, ApJ 438, 62
- (33) Zucca E., Zamorani G., Vettolani G., et al. 1997, A&A 326. 477
- (34)