A model for the optical high state light curve of AM Herculis ††thanks: Based on observations obtained at the 1.5m Loiano telescope, operated by the Bologna Astronomical Observatory.
We present a simple quantitative model that can describe the photometric and band light curves of AM Herculis obtained during a high state. The double-humped shape of the band light curve is dominated by cyclotron emission from a region at the main accreting pole with an area of and sustaining an inflow of . The almost unmodulated band is dominated by emission from the accretion stream. The contribution of the heated white dwarf to the optical emission is small in the band, but comparable to that of the accretion stream in the band. The emission of the secondary star is negligible both in and in .
Key Words.:
Accretion – cataclysmic variables – Stars: binaries close – Stars: individual: AM Her – Stars: white dwarfs –1 Introduction
In AM Herculis stars, or polars, a strongly magnetic white dwarf ( MG) accretes from a Roche-lobe filling late type secondary star. The flow of matter leaving the secondary star is threaded by the magnetic field once the magnetic pressure exceeds the ram pressure in the accretion stream. The kinetic energy is converted into heat in a shock near the footpoints of the flux tubes on the white dwarf surface. For low and intermediate local mass flow densities (), this shock stands above the white dwarf surface, and the cooling thermal bremsstrahlung and cyclotron radiation can escape unobstacled into space. For high mass flow densities (), the shock is submerged into the white dwarf atmosphere, and the primary accretion luminosity is reprocessed into the soft X-ray regime.
The strong magnetic field of the white dwarf synchronises its rotation with the binary orbital period (). As an observational consequence, the emission of polars is strongly modulated at the orbital period in almost all wavelength bands. While the shape of the hard X-ray light curve of AM Herculis (and most other polars) can be easily interpreted in terms of the changing geometric aspect of the hot plasma below the shock, the optical through infrared emission may show a more complicated phase dependence, as different components within the binary contribute to the observed emission at a given wavelength, and as the cyclotron emission from the accretion column is subject to wavelength-dependent beaming.
In this paper we develop a simple quantitative model which takes into account the various emission sites in AM Herculis, and which can quantitatively describe the observed and band high state light curves with a minimum of free parameters.
2 Observations
We obtained and high state photometry of AM Her in August 1998 at the Loiano 1.5 m telescope using a 2-channel photoelectric photometer and a time resolution of 1 s (Table 1). The observations were interrupted every min for sky measurements in both channels. Data reduction included sky subtraction, differential extinction, absolute calibration using Landolt standards, and binning into 5 s bins. The timings have been converted to orbital phases using the ephemeris of Heise & Verbunt (1988), but defining as the inferior conjunction of the secondary star (Southwell et al. 1995)111In the magnetic phase convention which is used frequently in the literature, is defined by the linear polarization pulse observed when the angle between the line of sight and the magnetic field line in the accretion column is closest to , or, alternatively, when the sign of the circular polarization is crossing zero.. In AM Her, the conversion between the phase conventions is given by . The high precision of the ephemeris of Heise & Verbunt (1988) ensures that the error in the computed phases is , which is of no concern for the purpose of the present paper. A phenomenological description of the photometric data used here has been included in the analysis of quasi-simultaneous BeppoSAX observations by Matt et al. (2000).
3 Modelling the light curve
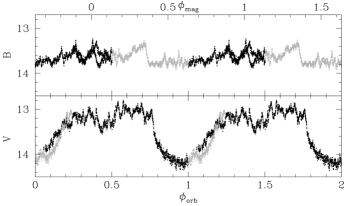
The observed light curves (Fig. 1) are typical of AM Her in the high state (e.g. Olson 1977; Szkody & Brownlee 1977). The band shows a broad and round minimum near and a secondary minimum near . The band is almost unmodulated. Both light curves exhibit a significant amount of flickering on timescales of several minutes, which is probably due to inhomogeneities in the accretion flow (Matt et al. 2000).
We identify four possible emission sites that will contribute to the observed light curves: the (heated) white dwarf, the secondary star, the accretion stream feeding material from the secondary star towards the white dwarf, and the accretion column just above the white dwarf surface near the magnetic pole. In the following, we will discuss the system geometry of AM Her and the four individual emission components.
| Date | Time (UT) | Exp. time [s] | Filter | Mean magnitude |
|---|---|---|---|---|
| Aug. 20 | 20:45:21 | 13320 | 13.50 | |
| Aug. 22 | 19:45:20 | 14040 | 13.64 |
3.1 The system geometry
The orientation of the accretion column with respect to the observer can be described by a set of three angles: the inclination of the system, , the co-latitude of the accretion column/spot, , measured as the angle between the rotation axis and the field line threading the accretion column and the azimuth of the magnetic axis from the line connecting the centres of the two stars, . For our present purpose, the exact knowledge of is not crucial, as it defines only a phase offset between our model light curve and the observed light curve, and we will adjust accordingly below.
The inclination and the co-latitude of AM Her have been subject of dispute. Brainerd & Lamb (1985) derived from the observed polarization properties and . Another polarimetric study indicates and (Wickramasinghe et al. 1991). The higher value of the inclination is favoured by spectroscopy of the secondary and of the accretion stream (Davey & Smith 1996; Southwell et al. 1995; Gänsicke et al. 1998). An additional constraint comes from the observed self-eclipse of the X-ray/EUV/ultraviolet emission from the accretion region and from the heated surrounding white dwarf photosphere. Gänsicke et al. (1998) and Sirk & Howell (1998) derive independently .
We will use the combinations () and () in our models of the and light curves of AM Her in order to reflect the uncertainties in the exact geometry, while satisfying .
3.2 The heated white dwarf
IUE and HST observations show that the ultraviolet flux of AM Her is dominated by the emission from the accretion-heated white dwarf during both low states and high states (Gänsicke et al. 1995). Gänsicke et al. (1998) could quantitatively model the quasi-sinusoidal flux modulation observed with HST during a high state with a large, moderately hot spot covering a white dwarf of K. They chose a temperature distribution decreasing linearly in angle from the spot centre merging into at the spot radius. The best-fit spot parameters implied a central temperature of 47 000 K and a spot size of of the total white dwarf surface. With a distance of 90 pc, the inferred radius of the white dwarf was cm. We use here synthetic phase-resolved spectra computed with the 3D white dwarf model described by Gänsicke et al. (1998), using their best-fit parameters.
We note for completeness that during a low state the and light curves of AM Her can very well be dominated by emission from the heated white dwarf (see e.g. Fig. 1 of Bonnet-Bidaud et al. 2000).
3.3 The accretion stream
The near-ultraviolet emission ( Å) of AM Her during the high state is dominated by continuum emission from the accretion stream. Based on phase-resolved IUE spectroscopy, Gänsicke et al. (1995) showed that this near-ultraviolet emission of the accretion stream does not vary noticeably with the orbital phase. In the following, we assume therefore that the accretion stream emission does not vary over the binary orbit, and treat the (constant) stream contributions in and as a free parameters. The limitations implied by this assumption will be discussed in Sect.4.
3.4 The secondary star
The secondary star in AM Her can be detected during low states, and both its spectral type and magnitude are easily measured (Schmidt et al. 1981; Gänsicke et al. 1995). For completeness, we use here and , as derived from the low state data, to describe the contribution of the secondary. It is, however, clear that the secondary star contribution to the observed and high state light curves is negligible.
3.5 The cyclotron emission
The accreted material releases its kinetic energy in a hydrodynamical shock close to the white dwarf surface. The ions are heated to the shock temperature — a few K — while the electrons keep at first their pre-shock temperature because of their low mass. Coulomb interactions between the particles transfer energy from the ions to the electrons, such that their temperature increases below the shock. The electrons then cool radiatively through emission of cyclotron radiation and thermal bremsstrahlung. This interplay between heating and cooling results in a temperature distribution along the post-shock flow which is characterized by its maximum temperature (Woelk & Beuermann 1996).


In order to compute the emisson from the accretion column we approximated the volume between the shock and the stellar surface with a given cross section and height. The total emission of this column is computed with a ray-tracing algorithm, where we solve the radiative transfer equation for each ray passing through the structured column using an updated version of the code described by van Teeseling et al. (1999). For the computation of the angle-dependent cyclotron emission we assumed that the magnetic field within the accretion column is perpendicular to the stellar surface and does not vary over the considered height of the column. A full description of the code used to solve the radiative and hydrodynamical problem is given elsewhere (Fischer & Beuermann 2001).
High state X-ray observations of AM Her give bolometric hard X-ray fluxes of (Gänsicke et al. 1995; Ishida et al. 1997; Matt et al. 2000). Assuming that the cyclotron emission can contribute roughly the same amount of flux (Gänsicke et al. 1995), we estimate an accretion rate for the stand-off shock region222This is not to be confused with the total accretion rate, which includes the regions of high local mass flow densities resulting in submerged shocks with consecutive soft X-ray emission. Matt et al. (2000) found an excess of the soft-to-hard X-ray luminosity .. The magnetic field strength of AM Her is (Bailey et al. 1991). For the accretion rate estimated above and a dipolar field geometry, a cross section of the accretion column of is estimated near the magnetic pole (Lubow & Shu 1975, 1976; Heerlein et al. 1999). From these numbers, a mean local mass flow density is derived. We have computed a grid of spectra for several mass flow densities in the given range and for a number of angles between the line of sight and the magnetic field. A representative sample of spectra for different is shown in Fig. 2.
From the computed set of model spectra, we synthesized and light curves of the cyclotron emission from the accretion column, where the mass flow density was taken as a free parameter. The fundamental parameter in the computation of the observed cyclotron flux for a given orbital phase is the angle between the line of sight and the magnetic field axis, . For a given set of inclination , co-latitutde and orbital phase
| (1) |
Figure 3 shows the variation of with for () and for (), the viewing geometry is illustrated in Fig. 4. We chose so that the minimum in aligns with the minimum of the observed light curve, i.e. the magnetic pole leads the secondary by . This value is in good agreement with the azimuth of the hot accretion region derived from X-ray and ultraviolet light curves, (Paerels et al. 1996; Gänsicke et al. 1998). reaches a minimum near , when the observer looks down along the accretion funnel, passes through at and reaches the maximum of at . As the cyclotron beaming is sensitive only to we plot when . From Fig. 3 it is clear that a reduction of the cyclotron flux is expected in the range from cyclotron beaming alone, without taking into account a possible occultation of the accretion column by the body of the white dwarf (see also Sect. 4).
A very similar qualitative description of the phase-dependent cyclotron emission has been given by Bailey et al. (1984) in order to explain the polarimetric properties of AM Her: linear polarization pulses and a change of sign of the circular polarization are observed at and , which corresponds to the phases when .
3.6 Composite model light curves
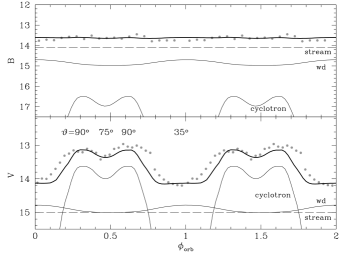
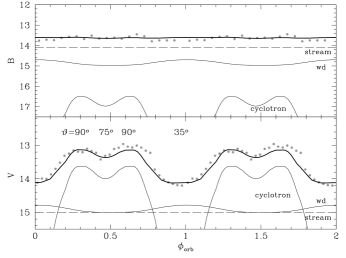
We obtain the model light curves by summing up the four individual emission components, white dwarf, accretion stream, secondary star, and accretion column. To fit the flux and the shape of the observed and light curves, we use two free parameters: the mean local mass flow density which determines the (phase-dependent) contribution of the cyclotron emission and the (phase-independent) contribution of the accretion stream, and . As mentioned above, the contributions of the heated white dwarf and of the secondary star are fixed. The observed light curves are reasonably well reproduced for , , and (Fig. 5,6). Figures 5 and 6 show the model light curves for the two different choices of (). The contribution of the heated white dwarf to the observed and high state light curves is small (Fig. 5,6), the contribution of the secondary is negligible.
Both fits grossly reproduce the shape of the observed light curves, i.e. a broad and deep minimum at and a shallow secondary minimum at in and practically no orbital modulation in . However, for () the angle drops below during , with the result that cyclotron radiation contributes very little to the total band emission. Consequently, this model light curve has a flat bottom, which contrasts the observed round shape.
4 Discussion
We have made a number of simplifications and assumptions in our light curve model that need some further attention.
(1) We have assumed that the accretion stream emission does not vary over the orbit, and have treated its contribution as a free parameter to fit the observed flux level. The computation of realistic accretion stream spectra is a problem of great complexity (e.g. Ferrario & Wehrse 1999), and certainly beyond the scope of our paper. However, a short inspection of the general spectral features of accretion stream emission lends support to our assumption.
The optical high state spectrum of AM Her is characterized by strong Balmer and Helium emission lines and by a strong Balmer jump in emission (e.g. Schachter et al. 1991). The origin of such a spectrum is clearly a plasma in which the optical depth in the continuum is below unity (optically thin in the continuum), and the optical depth in the lines is much larger than in the continuum, i.e. (optically thick in the lines). The details of the spectrum depend on the temperature, the density, and the extension of the plasma region, but the general characteristics are (a) significant continuum emission in the near-ultraviolet part of the Balmer continuum, (b) a strong contribution in the band, which covers the higher lines of the Balmer series, Ca K+H in emission, as well as the Balmer jump, and (c) a weak contribution in the band, which covers practically only the weak continuum between and . As already stated in Sect. 3.3, Gänsicke et al. (1995) detected strong near-ultraviolet continuum emission with a weak phase-dependence, and identified the accretion stream as the source of this emission. In AM Her, with MG, cyclotron emission can not contribute significantly at such short wavelengths, the secondary star can be excluded, and the white dwarf contribution was already modelled in the analysis of Gänsicke et al. (1995). We feel, therefore, safe to identify the observed near-ultraviolet continuum flux with the accretion stream feature (a) defined above.
We find in our present analysis that the accretion stream contributes more in than in . In fact, the stream emission dominates the practically flat band light curve. This result appears entirely plausible, as our above considerations show that the stream is indeed expected to be brigher in than in . We note that weak photometric modulation at blue wavelengths is a hallmark of AM Her during the high state (e.g. Olson 1977).
A more sophisticated approach would need simultaneous phase-resolved spectroscopy, so that the stream contribution in the and bands could be quantitatively estimated e.g. from the orbital variation of the emission line fluxes. Hence, in summary, the observed weak phase dependence of the near-ultraviolet stream emission and the fact that stream is expected to be brighter in than in strongly supports our assumption of a phase-independent stream contribution. This in turn implies, as shown in Sect. 3.6, that cyclotron emission is the dominant phase-dependent contribution to the observed band high state light curve.
(2) We ignore the geometric occultation of the accretion column by the body of the white dwarf. For structures extending less than than above the white dwarf surface will be totally eclipsed at . However, for the low magnetic field and the rather low mass flow density, the shock is expected to stand above the white dwarf surface (Fischer & Beuermann 2001). The X-ray data of AM Her clearly show that at least part of the accretion region is eclipsed at (i.e. when reaches its maximum) by the white dwarf (e.g. Hearn & Richardson 1977). In contrast to this, significant polarized emission is still detected during this phase, indicating either that the cyclotron emission arises at a greater height above the white dwarf surface than the X-rays (Bailey et al. 1984), or that additional cyclotron emission comes from the opposite magnetic pole (Wickramasinghe et al. 1991). An indication that an eclipse of the accretion column by the white dwarf might be relevant comes from the polarimetry of Piirola et al. (1985): the secondary minimum at has practically the same shape in , , and . This is unexpected, as the cyclotron beaming decreases towards the lower cyclotron harmonics (i.e. longer wavelengths). In fact, and band light curves calculated with our model give reasonable magnitudes, but do not show a strong secondary minimum.
(3) We have neglected that the accretion column has a finite lateral extent, which will cause a variation of the magnetic field strength and, more importantly, of its orientation within the cyclotron emitting region. The expected result of such variation is a smoothing of , and, consequently, of the cyclotron light curve. In addition, a significant lateral extent of the cyclotron emitting region would counteract to some extent the self-eclipse just described above.
(4) We deliberately restrict our model to a single cyclotron region near the main (upper) pole. The X-ray emission of AM Her is known to switch between (at least, see below) two different patterns. In the normal mode hard and soft X-rays are emitted in phase from the upper pole. During the reversed mode, the soft X-ray emission originates predominantly at the lower pole, while the hard X-rays are still emitted from the upper pole (Heise et al. 1985). Despite this apparently drastic change in the accretion pattern, the optical light curve of AM Her does not change between normal and reversed mode (Mazeh et al. 1986). These observations strongly suggest that only the high mass flow densities may switch back and forth between the poles, while the upper pole is fed during both states by low mass flow densities – associated with the emission of hard X-ray and cyclotron emission. This interpretation supports our one-pole cyclotron emission model.
An ultimate puzzle, though, remains: while our optical data from 1998, August 20/22 presented here are completely typical of AM Her in either the normal mode or the reversed mode, they were obtained only about a week after our BeppoSAX observations (1998, August 12) which showed the system in an hitherto unknown state with significant hard X-ray emission during (Matt et al. 2000). RXTE and EUVE observations obtained on 1998, August 4 confirmed the atypical X-ray light curve (Christian 2000). We are left with the possibility that AM Her returned into one of the previously known – normal or reversed – modes by the time of our optical campaign. Considering that also the optical high state light curve of AM Her noticeably changed on a (to our knowledge) single occasion (Szkody 1978), it appears that AM Her occasionally drops into short-lived “atypical” behaviour. A multiwavelength campaing covering one of these “atypical” states could reveal whether they are related to the switching between the normal and the reversed accretion mode.
Acknowledgements.
We thank Klaus Beuermann for many discussions on this topic and the referee Steve Howell for a number of helpful comments. This research was supported by the DLR under grant 50 OR 99 03 6.References
- Bailey et al. (1991) Bailey, J., Ferrario, L., & Wickramasinghe, D. T. 1991, MNRAS, 251, 37P
- Bailey et al. (1984) Bailey, J., Hough, J. H., Gilmozzi, R., & Axon, D. J. 1984, MNRAS, 207, 777
- Bonnet-Bidaud et al. (2000) Bonnet-Bidaud, J. M., Mouchet, M., Shakhovskoy, N. M., Somova, T. A., Somov, N. N., Andronov, I. L., de Martino, D., Kolesnikov, S. V., & Kraicheva, Z. 2000, A&A, 354, 1003
- Brainerd & Lamb (1985) Brainerd, J. J. & Lamb, D. Q. 1985, in Cataclysmic Variables and Low-Mass X-ray Binaries, ed. D. Q. Lamb & J. Patterson (Dordrecht: D. Reidel), 247–256
- Christian (2000) Christian, D. J. 2000, AJ, 119, 1930
- Davey & Smith (1996) Davey, S. C. & Smith, R. C. 1996, MNRAS, 280, 481
- Ferrario & Wehrse (1999) Ferrario, L. & Wehrse, R. 1999, MNRAS, 310, 189
- Fischer & Beuermann (2001) Fischer, A. & Beuermann, K. 2001, A&A, submitted
- Gänsicke et al. (1995) Gänsicke, B. T., Beuermann, K., & de Martino, D. 1995, A&A, 303, 127
- Gänsicke et al. (1998) Gänsicke, B. T., Hoard, D. W., Beuermann, K., Sion, E. M., & Szkody, P. 1998, A&A, 338, 933
- Hearn & Richardson (1977) Hearn, D. R. & Richardson, J. A. 1977, ApJ Lett., 213, L115
- Heerlein et al. (1999) Heerlein, C., Horne, K., & Schwope, A. D. 1999, MNRAS, 304, 145
- Heise et al. (1985) Heise, J., Brinkman, A. C., Gronenschild, E., Watson, M., King, A. R., Stella, L., & Kieboom, K. 1985, A&A, 148, L14
- Heise & Verbunt (1988) Heise, J. & Verbunt, F. 1988, A&A, 189, 112
- Ishida et al. (1997) Ishida, M., Matsuzaki, K., Fujimoto, R., Mukai, K., & Osborne, J. P. 1997, MNRAS, 287, 651
- Lubow & Shu (1975) Lubow, S. H. & Shu, F. H. 1975, ApJ, 198, 383
- Lubow & Shu (1976) —. 1976, ApJ Lett., 207, L53
- Matt et al. (2000) Matt, G., de Martino, D., Gänsicke, B. T., Negueruela, I., Silvotti, R., Bonnet-Bidaud, J. M., Mouchet, M., & Mukai, K. 2000, A&A, 358, 177
- Mazeh et al. (1986) Mazeh, T., Kieboom, K., & Heise, J. 1986, MNRAS, 221, 513
- Olson (1977) Olson, E. C. 1977, ApJ, 215, 166
- Paerels et al. (1996) Paerels, F., Hur, M. Y., Mauche, C. W., & Heise, J. 1996, ApJ, 464, 884
- Piirola et al. (1985) Piirola, V., Vilhu, O., Kyrolainen, J., Shakhovskoi, N., & Efimov, Y. 1985, in Recent Results on Cataclysmic Variables, ESA–SP No. 236 (Noordwijk: ESA Publications Division), 245–249
- Schachter et al. (1991) Schachter, J., Filippenko, A. V., Kahn, S. M., & Paerels, F. B. S. 1991, ApJ, 373, 633
- Schmidt et al. (1981) Schmidt, G. D., Stockman, H. S., & Margon, B. 1981, ApJ Lett., 243, L157
- Sirk & Howell (1998) Sirk, M. M. & Howell, S. B. 1998, ApJ, 506, 824
- Southwell et al. (1995) Southwell, K. A., Still, M. D., Connon Smith, R., & Martin, J. S. 1995, A&A, 302, 90
- Szkody (1978) Szkody, P. 1978, PASP, 90, 61
- Szkody & Brownlee (1977) Szkody, P. & Brownlee, D. E. 1977, ApJ Lett., 212, L113
- van Teeseling et al. (1999) van Teeseling, A., Fischer, A., & Beuermann, K. 1999, in Annapolis Workshop on Magnetic Cataclysmic Variables, ed. C. Hellier & K. Mukai (ASP Conf. Ser. 157), 309–316
- Wickramasinghe et al. (1991) Wickramasinghe, D. T., Bailey, J., Meggitt, S. M. A., Ferrario, L., Hough, J., & Tuohy, I. R. 1991, MNRAS, 251, 28
- Woelk & Beuermann (1996) Woelk, U. & Beuermann, K. 1996, A&A, 306, 232