Chandra Detection of the Forward and Reverse Shocks in Cassiopeia A
Abstract
We report the localization of the forward and reversed shock fronts in the young supernova remnant Cas A using X-ray data obtained with the Chandra Observatory. High resolution X-ray maps resolve a previously unseen X-ray feature encompassing the extremity of the remnant. This feature consists of thin, tangential wisps of emission bordering the outer edge of the thermal X-ray and radio remnant, forming a circular rim, in radius. Radio images show a sharp rise in brightness at this X-ray rim, along with a large jump in the synchrotron polarization angle. These characteristics suggest that these wisps are the previously unresolved signature of the forward, or outer, shock. Similarly, we identify the sharp rise in emissivity of the bright shell for both the radio and X-ray line emission associated with the reverse shock. The derived ratio of the averaged forward and reverse shock radii of 3:2 constrains the remnant to have swept up roughly the same amount of mass as was ejected; this suggests that Cas A is just entering the Sedov phase. Comparison of the X-ray spectra from the two shock regions shows that the equivalent widths of prominent emission lines are significantly lower exterior to the bright shell, as expected if they are respectively identified with the shocked circumstellar material and shocked ejecta. Furthermore, the spectrum of the outer rim itself is dominated by power-law emission, likely the counterpart of the non-thermal component previously seen at energies above 10 keV.
Subject headings:
supernova remnants: individual (Cassiopeia A) — X-rays: general1. Introduction
The young supernova remnant Cassiopeia A (Cas A) is thought to result from the destruction of a massive star whose explosion was likely recorded by the Dutch astronomer Flamsteed in 1680 (Ashworth 1980; Fabian et al. 1980). As one of the brightest radio and X-ray emitters in the sky, Cas A is perhaps the best studied shell-like supernova remnant (SNR). Located along the Galactic plane at a distance of kpc (Reed et al. 1995), Cas A appears today as a nearly circular, diameter bright ring, with a low surface brightness diameter radio and X-ray plateau. Multi-wavelength analysis has fleshed out a picture of an expanding shell of supernova ejecta, whose X-ray emission is dominated by a thermal spectrum characteristic of a shocked plasma, rich in emission lines from highly ionized atoms (Becker et al. 1979); Fesen, Becker & Blair 1987). The radio emission is consistent with synchrotron radiation from relativistic particles accelerated at shocks or other structures during the remnant’s expansion (Anderson & Rudnick 1996).
Studies of SNR shock structures can provide important dynamical and radiative information on the evolutionary state of the remnant (Fabian et al. 1980; Fesen, Becker & Blair 1987; Braun 1987; Greidanus & Strom 1991; Reed et al. 1995). In the standard picture of young SNRs, we expect to see an outer shock, the blast wave from the explosion moving into the circumstellar medium, and a reverse shock, responsible for decelerating and compressing the outflowing ejecta. Analytical and numerical work suggests that these two shocks are still generated even when the ejecta are very inhomogeneous, as in Cas A (see e.g., Hamilton 1985; Jun, Jones & Norman 1996). In this inhomogeneous environment, the shock structures may become locally complex, and the “contact discontinuity” between shocked ejecta and circumstellar material becomes a broad, non-uniform region.
In this Letter, we report the detection of sharp, well defined X-ray emission features encircling the outer boundary of Cas A which we argue are the signature of the forward shock front. We use new X-ray and radio data to measurement the location of both the forward and reverse shocks and compare these to previous work. The remnant is most likely in a position-dependent dynamical state in transition from free expansion to the Sedov phase.
2. Observations
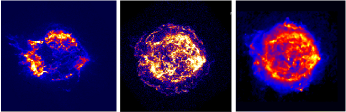
We begin our analysis of Cas A using X-ray data obtained during the “first light” observation of the Chandra Observatory (Weisskopf et al. 1996). This observation, which imaged Cas A using the Advanced CCD Imaging Spectrometer (ACIS), was the basis of a recent study by Hughes et al. (2000) on the distribution of nucleosynthesis products in the remnant; the reader is referred to this paper for details about the observation and its data set. We confirm our results using a deep 50 ks archival observation of Cas A obtained on 30 Jan 2000 using the same observational configuration. The superb imaging quality of Chandra allowed us to produce two narrow band maps of Cas A with arcsecond resolution, one restricted to the spectral region containing the He-like Si transitions near 1.86 keV (including the weaker H-like transition at 2.006 keV), and the other restricted to the continuum-dominated keV band. The Si image has been continuum subtracted using the high energy map, normalized by estimating the continuum component underlying the line emission spectrum. These images are displayed in Figure 1, along with a recent high resolution 4410 MHz radio continuum map obtained with the Very Large Array (for details see Koralesky et al. 2001, in preparation). The radio map was also used to reference the absolute aspect of the Chandra X-ray image.
3. Forward and reverse shock identification
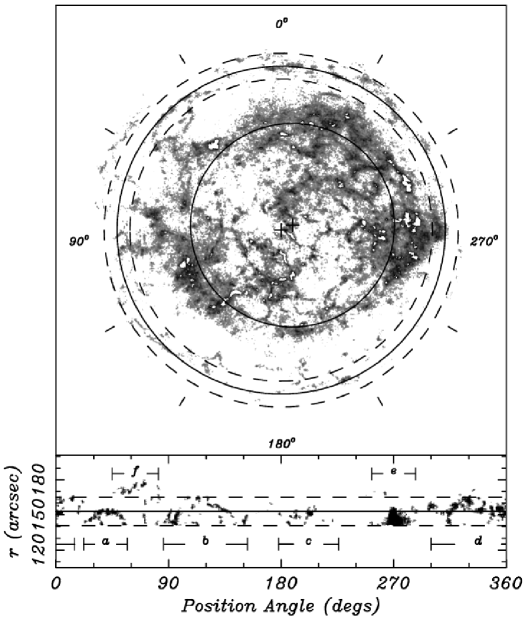
The overall morphology of Cas A as seen in the three images in Figure 1 is familiar from earlier X-ray and radio studies. The emission is dominated by the bright ring, in radius, beyond which extends a plateau of low surface brightness. However, the two new X-ray images shows a clear difference in detail, first suggested in Holt et al. 1994, with many filaments unique to each map, especially at the very edge of the plateau. Here, in the X-ray continuum image, Chandra’s arcsecond angular resolution reveals for the first time a halo of thin, tangential wisps, roughly in width, which encompasses the bulk of the thermal X-ray and radio emission. These wisps define the external boundary of the X-ray remnant centered at (J2000) with a mean radius of , extending (see Fig. 2). The fineness of these features prevented their detection in earlier, lower resolution, X-ray images. Traces of the wisps can also be seen in the Si map, consistent with a lower energy component of the X-ray continuum underlying the line emission. Below we identify these wisps with Cas A’s forward shock, where the blast wave from the supernova explosion encounters the circumstellar medium.
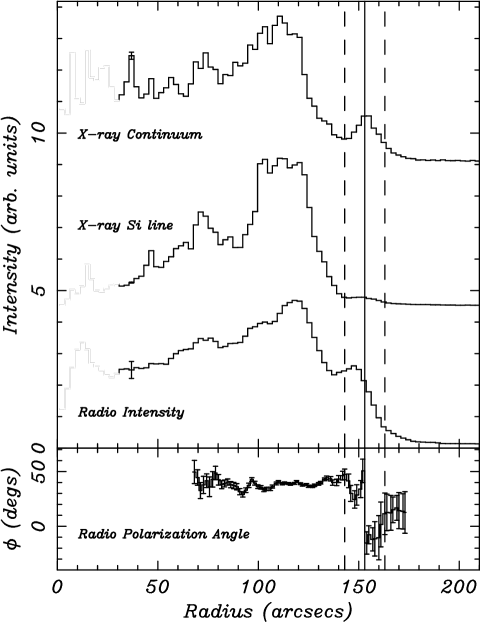
We looked at the radio map for evidence of wisps coincident with those observed in X-rays; no equivalent feature is seen. In Figure 3, we plotted the radial profiles of Cas A in the X-ray and radio wave-bands centered on the above coordinates. We find a large increase in the radio surface brightness interior to the wisps leading to the plateau prior to the bright ring. For clarity, we restricted our profiles to an azimuthal range of degs, as the offset bright ring emission is somewhat blurred around the remnant for this center. Also plotted in this figure is the synchrotron polarization angle which reveals a significant jump in angle at the rim, interior to which the inferred magnetic field is predominantly radial. The combination of this abrupt jump in polarization angle and the sharp rise in the radio brightness, both coincident with the newly resolved rim of thin X-ray wisps, strongly suggest that this emission feature is the signature of the forward shock in Cas A.
We now consider evidence for a reverse shock, for which the clearest indicator would be a sharp rise in X-ray and/or radio emissivity with increasing radius. No such feature has been previously identified in Cas A, partially due to the very patchy emissivity unresolved in X-rays. This non-uniformity reflects inhomogeneities in the ejecta and/or the circumstellar medium. The quality of the X-ray image-spectroscopy with Chandra now offers the possibility of revisiting this issue.
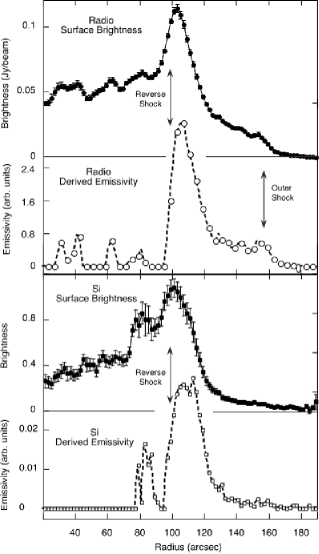
To isolate the reverse shock in Cas A we deproject the observed line-of-sight integrated brightness into a one-dimensional emissivity profile as a function of radius. An earlier attempt at shell decomposition by Fabian et al. 1980 used the ROSAT Cas A image to qualitative assigned the shocks to a two-shell structure. The general method is to assume that the emissivity (at least for a limited range in azimuth, in this case) can be modeled as a set of thin, uniform shells. We perform an iterative decomposition of the brightness profile as a function of radius into one-pixel-wide constant emissivity shells. The iteration proceeds until the residual brightness is lowered to 1% of its original peak value. Here, we restrict our analysis to the region around the bright ring ( degs) which appears to be the region most free of unrelated filamentary features seen in projection against the ring.
The results of this spatial decomposition are shown in Figure 4. We take the center of the bright ring as a reasonable approximation to the reverse shock centroid which we estimate at (; J2000). It is clear that both the radio and Si emissivity profiles for this sector show a sharp rise at a radius of , which we identify as the location of the reverse shock. The mean ratio of the outer shock to reverse shock radii is then 3:2 with a range (:). We note that these emissivity profiles are only reliable for radii , interior of which the deconvolution method applied to our data sets begins to diverge. There is also marginal evidence for the reverse shock in the emissivity profiles using the keV images (not shown).
4. Discussion
4.1. Cas A’s dynamical state
The location of the two shock fronts in Cas A allows us to place important dynamical constraints on the evolutionary state of the remnant. A key model parameter for the evolution of a young core-collapsed SNR is the ratio of the blastwave radius to that of the reverse shock, . In many models this ratio characterizes the transition from the initial free-expansion, “ejecta dominated” phase to the simpler Sedov phase (see Truelove & McKee 1999 for a review). For a broad range of assumptions about the density structure of the stellar envelope and the circumstellar material (CSM), depends primarily on the ratio of swept-up to ejected mass. Indeed, the observed shock ratio for Cas A is consistent with the models of Truelove & McKee (1999) for which . In their models, the reverse shock generally penetrates through the stellar envelope and into the core of the ejecta somewhat sooner than when . The close proximity in Cas A of the blast shock to the reverse shock suggest that the amount of swept-up material is limited, and thus the value of .
The ratio also plays a role in more sophisticated models. Borkowski et al. (1996) examined a CSM model based on the formation of a spherical shell during the final stages of presupernova evolution. In their model is also close to 3:2, but the inner shell boundary, located near , should be much more prominent than the reverse shock. Some refinement would be necessary for this model to be compatible with the new data.
The localization of the shock structures presented here allows us to compare their apparent geometric offset with the kinematic derived centers. This provides further insight into the well known large-scale asymmetries in Cas A’s expansion (Tuffs 1986; Anderson & Rudnick 1995; Reed et al. 1995; Koralesky et al. 1998). The reverse shock is found to be offset to the northwest by , ( of the ring radius) from the center of the forward shock. Interestingly, the point source (Tananbaum 1999) is located in the exact opposite direction from a vector between the forward to the reverse shock. The size of our derived geometric offset is found to be consistent with the various kinematic centers summarized by Reed et al. 1995.
These results confirm that the explosion and/or the circumstellar environment of the precursor were significantly asymmetric. A strong asymmetry in velocities is seen in both the compact radio features (Tuffs 1986; Anderson & Rudnick 1995) as well as more diffuse emission (Koralesky et al. 2001, in preparation). Reed et al. (1995) conclude that there must be a density gradient of front-to-back across the remnant from asymmetries in the line-of-sight velocities of the fast optical emission-line knots (e.g. Fesen, Becker & Blair 1987). Ongoing two-dimensional velocity analysis of the radio data and future X-ray velocity data should help elucidate the complex dynamical state of the remnant.
4.2. The nature of Cas A’s shock structures
It is illustrative to compare representative X-ray spectra from regions associated with the forward and reverse shocks. These selected spectra, shown in Figure 5, indicate clear qualitative differences, most notably in the strength of the prominent (Si and S) emission line blends. For the spectrum of the wisps, including the plateau interior to it, taken from a typical region subtending about 20 degs in the north, the Si and S line equivalent widths are 160 and 140 eV, respectively, while other regions of the rim are nearly devoid of emission lines (also see Hughes et al. 2000). For the ring, represented here by a region in the northeast, they are 990 and 730 eV. Elsewhere in the ring, these may be as much as a factor of two larger or smaller. This difference is expected if the rim emission arises predominantly from interstellar material heated by the forward shock, and the ring emission from reverse-shocked ejecta.
The spectrum of the portion of the rim discussed above can be fitted with a planar shock model (Borkowski, xspec 11.0) with kT =2.00.5 keV, over a range of nt values from 0 to 1010.8±0.2 cm-3 s, and NH=1.00.11022 cm-2. An additional hard component is required, however, for a reasonable fit. We used a power-law, and found a spectral index similar to that reported by Allen et al. (1997) for the RXTE spectrum above 10 keV. The flux of this power-law component is at least half, but can be as much as , of the total keV flux. It is possible that this component could be significantly higher in other portions of the rim. In contrast, for the bright ring spectrum shown, a hard component is not required; the confidence upper-limit for its flux contribution is . We leave a more detailed spectral analysis of the shock fronts for a future paper.
The high energy tail component required by the spectra fits to the wisp region raises the possibility of an X-ray synchrotron component produced by electrons accelerated to TeV energies in the outer shock, as seen in SN1006 (see Koyama et al. 1995; Reynolds 1996). For Cas A, however, this is somewhat problematic since there is no direct radio counterpart to the wisp emission seen in the keV X-ray energy band. A non-thermal bremsstrahlung model provides an alternative explanation for the high energy X-ray tail (Laming 2001; Bleeker et al. 2001) consistent with the lack of radio counterpart.
It is clear from the new data that the reverse shock forms a distinct inner boundary for both the hot ejecta producing the X-ray emission and the amplified magnetic fields producing the radio emission. The radio structure is more problematic since it depends sensitively on the strength of the magnetic field, in addition to the results of any local particle acceleration. We do see evidence for the effect of the outer shock on the magnetic field through the enhanced alignment of the polarization angle to the shock normal just inside the rim. But the field is still largely disorganized, since the degree of polarization remains weak (, Anderson, Keohane & Rudnick 1995). It is likely that the radio emissivity is being controlled mainly by turbulent field amplification between the two shocks.
In summary, the key results of this study are: 1) the discovery of a thin, bright X-ray wisps which we interpret as the forward shock, 2) the identification of a sharp rise in radio and X-ray line emissivity at the inner edge of the bright ring, which we associate with the reverse shock, 3) the determination of bulk differences in the X-ray spectra associated with these shocks, 4) and the inference that Cas A has currently swept up approximately its own ejected mass.
References
- (1) Allen, G. E., Keohane, J. W., Gotthelf, E. V., Petre, R., Jahoda, K., Rothschild, R. E., Lingenfelter, R. E., Heindl, W. A., Marsden, D., Gruber, D. E., Pelling, M. R., Blanco, P. R. 1997 ApJ, 487, L97
- (2) Anderson, M.C., Keohane, J. W., Rudnick, L. 1995, ApJ, 441 300.
- (3) Anderson, M.C., Rudnick, L., 1995 ApJ, 441, 307
- (4) Anderson, M.C., Rudnick, L. 1996 ApJ, 456, 234
- (5) Ashworth, W. B. 1980, J. Hist. Astr., 11, 1
- (6) Becker,H., Smith, B. W., White, N. E., Holt, S. S., Boldt, E. A., Mushotzky, R. F., & Serlemitsos, P. J. 1979, ApJ, 234, L73
- (7) Bleeker, J., Willingale, R., van der Heyden, K., Dennerl, K., Kaastra, J., Aschenbach, B., & Vink, J., 2001, AA,365, L225
- (8) Borkowski, K., Szymkowiak, A.E., Blondin, J.M., & Sarazin, C.L. 1996, ApJ, 466, 866
- (9) Braun, R. 1987, AAp 171 233
- (10) Fabian, A.C., Willingale, R., Pye, J.P., Murray, S.S., & Fabbiano, G. 1980, MNRAS, 193, 175
- (11) Fesen, R. A., Becker, R. H., Blair, W. P. 1987, ApJ, 313, 378
- (12) Greidanus, H. & Strom, R. G. 1991, 249, 521
- (13) Hamilton, A. J. S. 1985, ApJ 291, 523
- (14) Holt, S., Gotthelf, E. V., Tsunemi, H., Negoro, H. 1994 PASJ, 46, L151
- (15) Hughes, J.P., Rakowski, C.E., Burrows, D.N., & Slane, P.O. 2000, ApJ, 528, L109
- (16) Jun B.-I., Jones, T.W. & Norman, M.L. 1996, ApJ, 486, L59
- (17) Koralesky, B., Rudnick, L., Gotthelf, E. V., Keohane, J. W. 1998, ApJ, 505, L27
- (18) Koyama, K., Petre, R., Gotthelf, E.V., Hwang, U., Matsuura, M., Ozaki, M., & Holt, S.S. 1995, Nature, 378, 255
- (19) Laming, M. 2001, ApJ, 546, 1149 2000 ApJ, 531, L53
- (20) Reed, J. E., Hester, J. J., Fabian, A. C., Winkler, P. F. 1995 ApJ, 440, 706
- (21) Reynolds, S.P. 1996, ApJ, 459, L13
- (22) Tananbaum, H. 1999, IAU Circ. 7246
- (23) Truelove, J.K., & McKee, C.F. 1999, ApJS, 120, 299
- (24) Tuffs, R. 1986 MNRAS 219, 13
- (25) Weisskopf, M. C. O’Dell, S. L., van Speybroeck, L. P. 1996, Proc. SPIE 2805, Multilayer and Gazing Incidence X-ray/EUV Optics III, 2.