Serendipitous discovery of a cluster of galaxies with a peculiar central galaxy111Based on data obtained at the W. M. Keck Observatory, which is operated as a scientific partnership among the California Institute of Technology, the University of California, and the National Aeronautics and Space Administration. The Observatory was made possible by the generous financial support of the W. M. Keck Foundation.
Abstract
We report the serendipitous discovery of a cluster of galaxies at . Thirty-eight candidate members were identified based on rough broad-band photometric redshifts, and three members were confirmed spectroscopically. The brightest cluster galaxy (BCG) is exceptionally blue, with B V and . The surface-brightness profile of the BCG follows an -law profile out to 3″ in all three bands. The effective radius is significantly smaller in bluer bandpasses, resulting in a blue core and a color gradient opposite to the metallicity-induced color gradient observed in typical elliptical galaxies. Beyond 3″ an extended envelope of emission in excess of the -law profile is observed, the position angle of which coincides with the major axis of the galaxy cluster. The spectrum of the BCG contains strong Balmer absorption, a minimal 4000Å break, and a broad Mg II emission line, suggesting that the galaxy has undergone recent star formation and may harbor a central AGN. The presence of numerous nearby bright stars makes this cluster an interesting target for next-generation adaptive optics using natural guide stars.
1 Introduction
The formation and evolution of clusters of galaxies and their constituent members is one of the most active areas of research in extragalactic astronomy. Numerous large-scale surveys at x-ray (e.g. Romer et al., 2000; Scharf et al., 1997) and optical (e.g. Gonzalez et al., 2001; Scodeggio et al., 1999) wavelengths are rapidly increasing the number of known galaxy clusters at intermediate redshifts.
The central regions of many of these clusters, and of many clusters at low redshifts, contain a cD galaxy – an elliptical galaxy surrounded by an extended envelope of diffuse emission (Schombert, 1986, 1988). Studies of these galaxies have indicated that their formation involves complex and uncertain processes. It is believed by many groups that these luminous central galaxies were created by hierarchical merging in the distant past (Merritt, 1985; Dubinksi, 1998), as the velocity dispersions in relaxed galaxy clusters are too high to permit merging of galaxies. Still, other formation scenarios have not yet been ruled out (see discussion in Garijo, Athanassoula, & García-Gómez, 1997). The formation mechanism for the cD envelope also remains controversial (e.g. McLaughlin, Harris, & Hanes, 1993).
We present the serendipitous discovery of a cluster of galaxies at an intermediate redshift, . The brightest cluster galaxy shows many of the properties of a cD galaxy, including a deviation from an otherwise smooth luminosity profile, a high luminosity, and a surrounding cluster of galaxies. However, closer inspection reveals many peculiarities, including a strong color gradient, a potential AGN, and evidence of recent star formation. This unusual combination of traits makes this cluster of galaxies a candidate for the study of cD galaxy formation.
Here we briefly discuss the observations (§2) before detailing the candidate selection and photometric analysis (§3), including a discussion of the surface-brightness profile of the BCG. In §4 we discuss the spectroscopic results, focusing on the central galaxy (§4.1). We conclude with a discussion of the central galaxy, including speculation on the origins of its unusual spectral and photometric properties, as well as the possibilities for future study (§5).
In this paper, we assume km s-1 Mpc-1, , and . With these parameters, corresponds to a physical distance of 8.8 kpc at the cluster redshift.
2 Observations
2.1 Discovery images
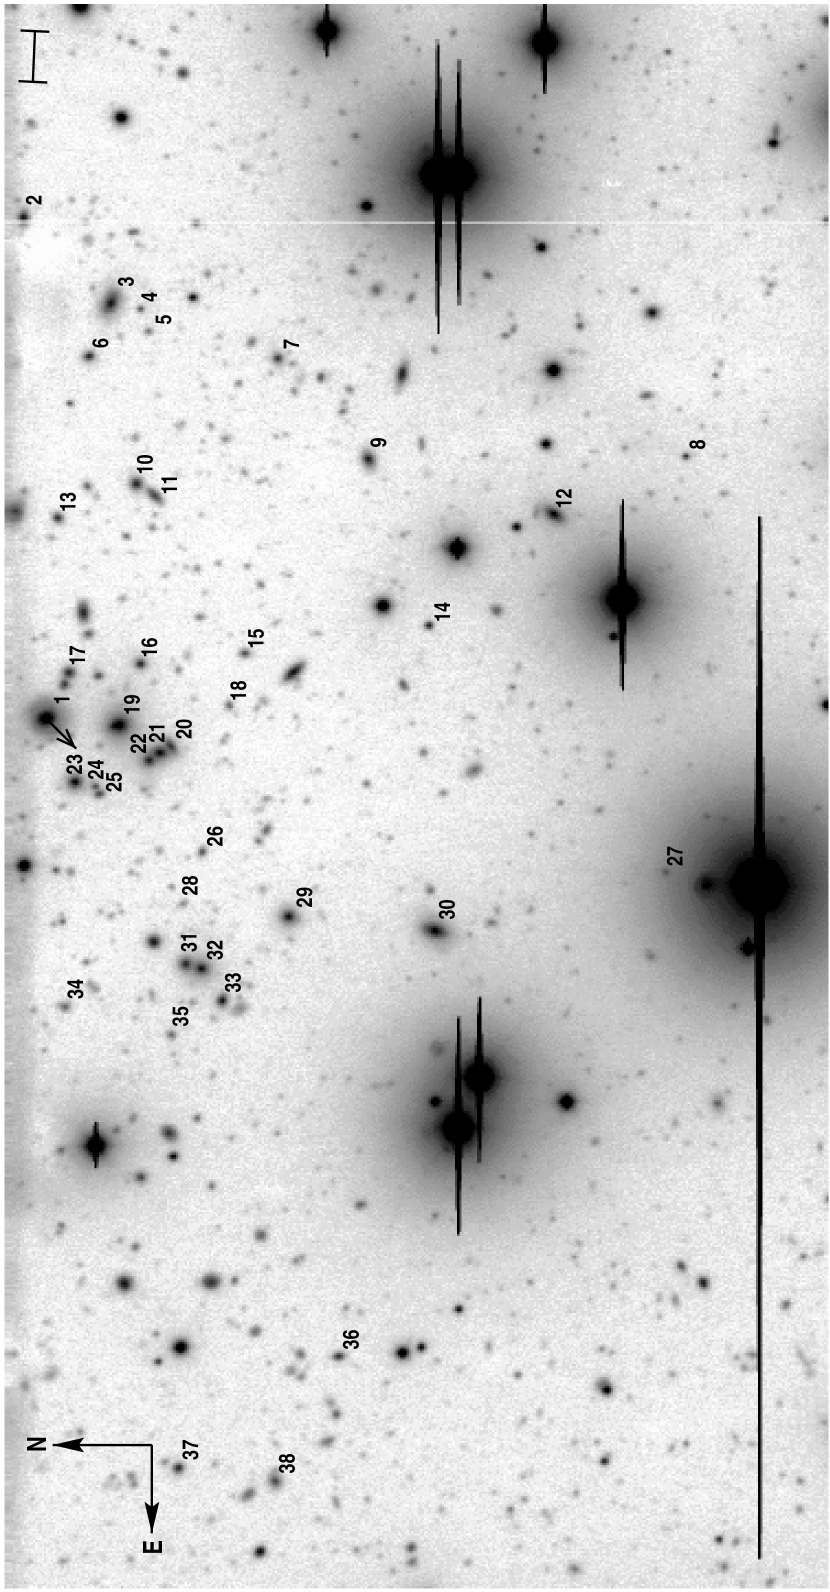
The cluster of galaxies was discovered in images of the star cluster M67 taken using the imaging mode of the LRIS imaging spectrometer (Oke et al., 1995) on Keck II on 1 February 1997. These observations are described in detail in Williams et al. (2001). For this analysis, we select only the small subset of images wholly containing the bright central galaxy. Images taken with each filter were shifted and co-added, resulting in total exposure times of 1200s in , 600s in , and 360s in . The FWHMs for each band, determined by measurements of PSF stars with DAOPHOT (Stetson, 1987), were in , in , and in . The galaxy cluster is located on the northern edge of the frames. The section of the image containing the cluster is shown in Fig. 1. A search of the NASA/IPAC Extragalactic Database finds no objects listed within a 2′ radius of the brightest cluster galaxy (BCG).
The images were reduced and flat-fielded via standard methods. Calibration was performed in each filter using local calibration stars from the M67 photometry of Montgomery, Marschall, & Janes (1993). Source detection, photometric analysis, and shape analysis were performed using the SExtractor data analysis program (Bertin & Arnouts, 1996). Objects are detected to . SExtractor assigns a stellarity parameter to each object with a value between 0 and 1, with 0 indicating an extended source, 1 indicating a point source, and intermediate numbers indicating a degree of uncertainty about the classification. The measured stellarity parameters of objects in these images reliably separate point sources from extended sources for , corresponding to an absolute magnitude of for an E/S0 galaxy at the cluster redshift (Coleman, Wu, & Weedman, 1980). We consider all objects brighter than and having shape parameters to be galaxies. All other objects, being either stellar or ambiguous classifications, were excluded from further analysis.
2.2 Spectroscopic observations
Spectra were taken in the same field of view as the images during a follow-up run on 26 and 27 February 2000 at Keck I. LRIS was used in spectroscopic mode with the 600 mm-1 grating and a multi-slit mask with slitlet widths of . Seeing was highly variable, averaging around 1 arcsecond. The spectroscopic setup was optimized for study of faint white dwarfs and planetary nebulae, and the covered wavelength range (4000Å to 6000Å) is less than ideal for analysis of the cluster members. Spectroscopic resolution is measured to be Å, and the total exposure time is 3600s.
The spectra were bias-corrected and flat-fielded via standard methods in IRAF. Relative flux calibration was performed using spectra of the spectrophotometric standard star Feige 66 (catalog ), although the absolute calibration is considered unreliable due to the use of a different slit width () and the highly variable seeing. The relative calibrations are also considered unreliable for due to the rapid decline in instrumental response and for , since the calibration spectrum ends at this point. No corrections were made for atmospheric extinction.
3 Candidate Galaxy selection and photometry
Galaxy photometry was performed using the SExtractor analyses of the images. It has been noted that SExtractor systematically underestimates the total flux of an object (Bertin & Arnouts, 1996), and we observed that the various magnitudes calculated by SExtractor (e.g. isophotal magnitudes, corrected isophotal magnitudes, and “best” magnitudes) did not agree, and that the disagreement was worse for fainter objects. In order to estimate the true total magnitudes for each galaxy, we created several populations of artificial galaxies in each band using standard IRAF routines.
The artificial galaxy luminosities are spaced randomly within 0.5-magnitude-wide bins, are convolved with the appropriate seeing for each band, and are placed randomly in the region of the images containing the cluster. 25% of the artificial population are exponential disk galaxies, while the remainder have -law luminosity profiles. The scale radii and effective radii are set to 2.5 pixels, or approximately 5 kpc at the cluster distance. The artificial galaxies are detected and analyzed using SExtractor, and the mean magnitude offset and standard deviation about the offset are calculated for each bin in each band. The results for the -band are shown in Fig. 2; other bands are omitted from the figure for clarity.
The suspected systematic offset between SExtractor magnitudes and known artificial galaxy magnitudes is confirmed, with the SExtractor magnitudes at least 0.1 magnitudes fainter than the actual magnitudes. This discrepancy increases toward fainter magnitudes, and the discrepancy differs with the observed band. Our measured systematic offsets are consistant with the offsets discussed in Bertin & Arnouts (1996). The photometric measurements for each galaxy are corrected for the missing flux using a cubic spline interpolation of the measured offsets. After correction, the various calculated magnitudes for a given galaxy agree to within the photometric errors.
The standard deviations of the artificial-galaxy magnitudes about the mean offset are much larger than the SExtractor-calculated errors. The source of this discrepancy is unclear. We therefore interpolate between the standard deviations measured in each magnitude bin to find the error for each photometric measurement. Errors for colors are determined by adding the errors from the two bandpasses in quadrature. The standard deviations from the galaxy simulations for the -band, as well as the SExtractor-calculated -band errors, are plotted as an example in the lower panel of Fig. 2.
The selection of candidate cluster members was performed by analysis of all 174 SExtractor-selected galaxies within a projected 1.5 Mpc (170″) radius of the BCG. A plot of the B V, color-color diagram reveals an obvious grouping of objects near B V, , as seen in Fig. 3. A comparison with the modeled galaxy colors of Fukugita, Shimasaku, & Ichikawa (1995), shown in Fig. 3 as lines connecting different galaxy morphologies at the same redshift, suggests that these galaxies are at redshifts . Thirty-seven galaxies residing in the color-color plane between the and model lines and with B V, corresponding roughly to galaxies of type Sbc and earlier, are selected as candidate cluster members and indicated in Fig. 3 by filled circles. Their astrometric and photometric properties are listed in Table 1, and the objects are labeled by number in Fig. 1. Galactic extinction toward M67 is low, with (Montgomery, Marschall, & Janes, 1993; Schlegel, Finkbeiner, & Davis, 1998), and no reddening corrections have been applied in the analysis.
In order to determine the level of contamination due to field galaxies satisfying the selection criteria, we analyzed an area of sky of the same geometric area on a portion of the image outside the projected 1.5 Mpc radius surrounding the BCG. 118 galaxies were detected, seven of which would have been selected as candidate cluster members. These false detections were spaced fairly randomly throughout the control region, whereas the candidate cluster members are strongly clustered around the BCG. We therefore estimate that, of the thirty-eight candidate cluster members, the actual number of cluster members fulfilling our selection criteria is , assuming Poisson statistics for the contaminating population. We also note that, since the BCG is near the edge of the image, there may be a similar number of cluster members not imaged, if the cluster is symmetric about the BCG.
The cluster richness is estimated using , the number of galaxies above background within a 1.5 Mpc radius brighter than two magnitudes fainter than the third-brightest cluster member (Abell, 1958). There are 25 cluster candidates meeting these criteria, while one of the false detections from the control region met the magnitude critereon. If we assume that we are seeing only half of the galaxy cluster, , and the cluster therefore has a richness class to 1.
The BCG, listed as object 1, does not meet the photometric selection criteria for cluster membership. This galaxy is surprisingly blue, with B V and before the consideration of any K-corrections. Surface-brightness profiles were determined for the BCG using the ellipse-fitting routines in IRAF. The center of the galaxy was held fixed, and the position angle and ellipticity were permitted to vary. Neighboring sources were masked to reduce profile contamination. The resulting profiles were checked by subtracting a model galaxy from the image. The residuals reveal some structure in the central in each band. Numerous iterations incorporating variations in several ellipse-fitting parameters were attempted, but the residuals are persistent. The residuals are strongest in the image, with a deficit of emission just to the east of the nucleus and an excess of emission to the west. In the and bands, the residuals are weaker. Due to the limits of seeing and pixilation, it is difficult to determine the true nature of these residuals. Since the residuals are strongest in and weakest in , we believe that a dust lane may be present in the central regions of this galaxy.
The surface-brightness profiles are shown in Fig. 4. The profiles follow an -law profile (de Vaucouleurs, 1948) for . Interior to this, seeing effects dominate the profile. Exterior to 3, there is excess light above the -law profile, an effect observed in cD galaxies. The deviation from the -law profile occurs at the same radius in all three bands, though the amplitude of the deviation varies from band to band. This excess luminosity does not follow the canonical cD envelope luminosity profile determined by Schombert (1988): , with . The measured luminosity profile is best fit with , , and . However, the values are not significantly worsened by assuming an -law profile for the envelope luminosity profile.
The effective radius for the observed -law profile interior to is calculated by minimizing the fit of the observed profile to a model profile comprised of an -law profile convolved with a Gaussian PSF and a central point source modeled by a scaled Gaussian PSF. The resulting fits for each band are listed in Table 2, and are plotted, along with residuals, in Fig. 4. A Gaussian PSF was selected because the convolution of an -law profile with a Gaussian kernal is an analytic function. Actual PSFs for each band had been constructed for the M67 stellar analysis using DAOPHOT (Stetson, 1987), and these were compared with Gaussian functions. Inside of one FWHM, the difference between the actual PSFs and a Gaussian of the same FWHM was less than a few percent, dropping to about 1% at the core. The wings of the PSFs are markedly different from a Gaussian profile; however, since the point source is presumably located at the peak of the galaxy light profile, the wings have little effect on the solution.
The effective radii are significantly different in each band. As a result, the -band -law profile is dramatically steeper than the -law profiles in the - and -bands. The color profiles reflect this difference in effective radii, as the galaxy becomes steadily redder with increasing radius in both B Vand , as seen in Fig. 5. The colors stabilize at and , close to the typical colors for other early-type galaxies in this cluster. These color gradients are in the opposite sense of color gradients due to metallicity gradients observed in normal ellipticals (Franx, Illingworth, & Heckman, 1989) and are similar to the gradients observed in elliptical galaxies with blue cores in the Hubble Deep Field (Menanteau, Abraham, & Ellis, 2001).
The - and -bands can be well described by an -law profile. The -band model, though, is marginally improved by the inclusion of a central point source with . This is shown in the lower panel of Fig. 4(c), which plots the residuals of the analytic profile compared to the actual surface-brightness profile. Filled circles indicate the best-fitting profile without a central point source. Open circles indicate the overall best fit, including a central point source, whereas asterisks the same -law profile without a central point source.
The presence of a point source in but not in and can be explained in two ways. The spectroscopic evidence presented below suggests that there may be an AGN in the center of the galaxy. Assuming that the AGN continuum light is blue, then the point source should be brighter in the -band than in the -band. This explanation would require obscuration of the AGN in to explain the non-detection of the source in that band. An alternative explanation is that the point source detection in is spurious. The residuals in Fig. 4(c) are smaller, but not significantly so, for the -law plus point source fit than for the -law-only fit. Given the available data, it is not possible to make a definitive statement about the presence or absence of a point source in the center of the BCG.
The ellipticity of the isophotes does not vary significantly with radius or bandpass, with . The position angle is constant with radius to , with a sharp twist at that point. This is the same radius at which the extended emission envelope appears, as shown in Fig 6. The position angle of this envelope is roughly aligned with the majority of neighboring cluster member galaxies, as shown by the arrow in Fig. 1. This alignment is common for cD envelopes (Carter & Metcalfe, 1980), and an isophotal twist at the same radius as the start of the envelope is also not uncommon (Porter, Schneider, & Hoessel, 1991), providing additional evidence that the envelope is closely related to classical cD envelopes.
4 Spectroscopic Results
Spectra of candidate member galaxies were obtained as part of a follow-up multi-slit spectroscopy of M67 (catalog ) white dwarf candidates. Only four slits were devoted to candidate member spectroscopy due to spatial constraints on the slit masks. One candidate cluster member, object 10, was detected, but the signal-to-noise was too poor to permit spectral identification. Three cluster galaxies, objects 1, 23, and 31, were detected with sufficient signal-to-noise to permit redshift determinations. The three redshifts are included in Table 1.
The galaxy cluster redshift and velocity dispersion were calculated following the suggestions of Beers, Flynn, & Gebhardt (1990) using the ROSTAT program graciously made available by the authors. For tiny sample sizes (five galaxies), they determined that the median redshift is a satisfactory measurement for numerous distributions, with a decent estimate for the confidence interval given by the canonical statistic. Beers, Flynn, & Gebhardt (1990) also state that the canonical standard deviation provides a satisfactory estimate of the cluster velocity dispersion for tiny samples, with confidence intervals for the velocity dispersion adequately estimated by the jackknifed biweight. These calculations result in a cluster redshift of and a velocity dispersion of , with both errors being 68% confidence limits. Zabludoff & Mulchaey (1998) note that velocity dispersions of groups determined from a small number of bright galaxies tend to be underestimated due to insufficient sampling of the velocity distribution; this effect may likely be present in this tiny sample. A larger sample of redshifts is clearly necessary before the velocity dispersion can be reasonably well determined.
The three spectra, smoothed and trimmed, are shown in Fig. 7. Object 23 has a typical early-type galaxy spectrum. The dominant lines are the Ca II H and K lines, and the 4000Å break is prominent. The G band is contaminated by the Na I D night-sky lines and was trimmed from the spectrum. Object 31 contains a mixture of a relatively young and an older stellar population, with prominent Balmer absorption lines along with strong Ca II and Fe I absorption. The lack of [O II] emission at Å indicates a lack of current star formain in these galaxies.
4.1 The central galaxy
The spectrum of the central galaxy is peculiar. As seen in Fig. 7, Balmer absorption is present at H and higher-order lines, and the blended [O II] emission lines have an equivalent width of Å (corrected for redshift). The 4000Å break is small. An excess of emission is visible from to 4400Åthat is not observed in the other two objects. This emission feature is roughly centered on H, which is otherwise not observed. Possible emission features also bracket the H line, emission features also not observed in the spectra of the other two galaxies.
The full spectrum, shown in Fig. 8, is even more interesting. A broad Mg II emission line () is present on the blue end of the spectrum, and the continuum flux rises significantly blueward of . The Mg II emission line has a rest-frame FWHM of , suggesting the presence of a central AGN. This may explain the peculiar emission feature at H, if the core of a broad emission line is filling in the H absorption line from the young stellar population.
The presence of [O II] emission and strong Balmer absorption is indicative of recent, perhaps even ongoing, star formation in the BCG. However, the possible contamination of the H and H absorption lines by emission makes it difficult to measure equivalent widths with the data currently available. Observations of H and [O III], which are not currently available, should be able to determine the degree to which [O II] is contaminated by emission from the suspected AGN, and thereby help to determine the current star formation rate, if any (Kennicutt, 1992).
5 Discussion and conclusions
The observations of the central galaxy indicate that this BCG is a very peculiar object. The presence of a broad Mg II emission line suggests the presence of a central AGN. Marginal detection of a central unresolved source in the -band photometry, as well as possible emission wings on either side of the H and H lines offer weak supporting evidence for an AGN. Higher-resolution imaging and spectroscopy at longer wavelengths (especially near H) should be capable of confirming any active nucleus.
The anomalously blue colors of the central regions of this galaxy, combined with the strong Balmer absorption lines observed in the spectrum, suggest that recent star formation has occurred in this galaxy. Given the small equivalent width of [O II] , it appears that the star formation rate in the BCG is currently low.
A scenario that may explain the observations would involve the accretion of a gas-rich galaxy by the central elliptical galaxy. Such an event would supply cold gas for star formation and could explain the possible dust feature observed in the residuals of the ellipse fitting. However, the currently-available data do not permit useful constraints to be placed on any accretion scenarios.
Several interesting questions are raised by the observations of the BCG. Is recent star formation the source of the strong central color gradients? If so, how recent and vigorous was the activity? Could the star formation and the central nuclear activity be related? More detailed spectroscopic and higher-resolution imaging are necessary to address these questions and explain this peculiar galaxy.
The central galaxy is located 112″ from the star MMJ 5722 (catalog ) (Montgomery, Marschall, & Janes, 1993) and 89″ from the star MMJ 5568 (catalog ). In the future, these and other M67 stars may serve as natural guide stars for next-generation adaptive optics observations of this galaxy, though at the present these stars are located at too large of an angular distance from the central galaxy for AO work (Wizinowich et al., 2000; Rigaut et al., 1998).
In summary, we report the discovery of a poor cluster or group of galaxies at behind the galactic stellar cluster M67. Rough photometric redshifts result in observed member galaxies brighter than , and redshifts from three members indicate a velocity dispersion of km s-1. The central galaxy has an -law surface-brightness profile, though the effective radius increases substantially in redder bandpasses. Outside a radius of ), light in excess of the fit -law profile is observed. A central, unresolved source appears also observed in , but only upper limits on any such source can be made in and . The spectrum of the BCG contains strong Balmer absorption, weak [O II] emission, and a broad Mg II emission line, as well as possible broad emission lines of H and H. The colors and spectroscopy may be indicative of recent star formation in the BCG, but higher-resolution imaging and further spectroscopy are needed to explain this peculiar galaxy further. This cluster may be a target for future adaptive optics systems and may be useful for studying the formation and evolution of cD galaxies in poor clusters of galaxies.
References
- Abell (1958) Abell, G.O. 1958, ApJS, 3, 211
- Beers, Flynn, & Gebhardt (1990) Beers, T.C., Flynn, K., & Gebhardt, K. 1990, AJ, 100, 32
- Bertin & Arnouts (1996) Bertin, E., & Arnouts, S. 1996, A&AS, 117, 393
- Carter & Metcalfe (1980) Carter, D., & Metcalfe, N. 1980, MNRAS, 191, 325
- Coleman, Wu, & Weedman (1980) Coleman, G.D., Wu, C.-C., & Weedman, D.W. 1980, ApJS, 43, 393
- de Vaucouleurs (1948) de Vaucouleurs, G. 1948, Ann. Astrophys., 11, 247
- Dubinksi (1998) Dubinski, J. 1998, ApJ, 502, 141
- Franx, Illingworth, & Heckman (1989) Franx, M., Illingworth, G., & Heckman, T. 1989, AJ, 98, 538
- Fukugita, Shimasaku, & Ichikawa (1995) Fukugita, M., Shimasaku, K., & Ichikawa, T. 1995, PASP, 107, 945
- Garijo, Athanassoula, & García-Gómez (1997) Garijo, A., Athanassoula, E., & García-Gómez, C. 1997, A&A, 327, 930
- Gonzalez et al. (2001) Gonzalez, A.H., Zaritsky, D., Dalcanton, J.J., & Nelson, A.E. 2001, in preparation
- Kennicutt (1992) Kennicutt, R.C. 1992, ApJ, 388, 310
- McLaughlin, Harris, & Hanes (1993) McLaughlin, D.E., Harris, W.E., & Hanes, D.A. 1993, ApJ, 409, L45
- Menanteau, Abraham, & Ellis (2001) Menanteau, F., Abraham, R.G., & Ellis, R.S. 2001, MNRAS, 322, 1
- Merritt (1985) Merritt, D. 1985, ApJ, 289, 18
- Montgomery, Marschall, & Janes (1993) Montgomery, K.A., Marschall, L.A., and Janes, K.A. 1993, AJ, 106, 181
- Oke et al. (1995) Oke, J.B. et al. 1995, PASP, 107, 375
- Porter, Schneider, & Hoessel (1991) Porter, A.C., Schneider, D.P., & Hoessel, J.G. 1991, AJ, 101, 1561
- Rigaut et al. (1998) Rigaut, F. et al. 1998, PASP, 110, 152
- Romer et al. (2000) Romer, A.K. et al. 2000, ApJS, 126, 209
- Scharf et al. (1997) Scharf, C.A., Jones, L.R., Ebeling, H., Perlman, E., Malkan, M., & Wegner, G. 1997, ApJ, 477, 79
- Schlegel, Finkbeiner, & Davis (1998) Schlegel, D.J., Finkbeiner, D.P., & Davis, M. 1998, ApJ, 500, 525
- Scodeggio et al. (1999) Scodeggio, M. et al. 1999, A&AS, 137, 83
- Schombert (1986) Schombert, J.M. 1986, ApJS, 60, 603
- Schombert (1988) Schombert, J.M. 1988, ApJ, 328, 475
- Stetson (1987) Stetson, P.B. 1987, PASP, 99, 191
- Williams et al. (2001) Williams, K.A., Bolte, M., Claver, C.F., & Wood, M.A. 2001, in preparation
- Wizinowich et al. (2000) Wizinowich, P., Acton, D.S., Lai, O., Gathright, J., Lupton, W., & Stomski, P. 2000, Proc. SPIE, 4007, 2
- Zabludoff & Mulchaey (1998) Zabludoff, A.I., & Mulchaey, J.S. 1998, ApJ, 496, 39
| Object | RA(J2000.0) | Dec(J2000.0) | B V | ||||||
|---|---|---|---|---|---|---|---|---|---|
| 1 | 8 51 16.42 | +12 0 29.4 | 18.77 | 0.10 | 0.12 | 0.13 | 1.02 | 0.13 | 0.3705 |
| 2 | 8 51 9.89 | +12 0 33.8 | 21.88 | 0.12 | 1.27 | 0.17 | 1.94 | 0.17 | |
| 3 | 8 51 11.01 | +12 0 17.1 | 20.99 | 0.10 | 1.60 | 0.16 | 1.94 | 0.14 | |
| 4 | 8 51 11.08 | +12 0 11.5 | 23.29 | 0.14 | 1.14 | 0.27 | 1.50 | 0.21 | |
| 5 | 8 51 11.38 | +12 0 9.9 | 23.67 | 0.16 | 1.05 | 0.32 | 1.45 | 0.23 | |
| 6 | 8 51 11.70 | +12 0 21.3 | 22.11 | 0.13 | 1.47 | 0.19 | 1.84 | 0.18 | |
| 7 | 8 51 11.72 | +11 59 45.1 | 22.57 | 0.16 | 1.30 | 0.21 | 2.01 | 0.20 | |
| 8 | 8 51 12.99 | +11 58 26.3 | 23.20 | 0.14 | 1.35 | 0.29 | 2.06 | 0.19 | |
| 9 | 8 51 13.04 | +11 59 27.7 | 21.47 | 0.11 | 1.52 | 0.16 | 1.79 | 0.16 | |
| 10 | 8 51 13.36 | +12 0 12.2 | 21.57 | 0.11 | 1.15 | 0.17 | 1.49 | 0.16 | |
| 11 | 8 51 13.52 | +12 0 8.7 | 21.73 | 0.12 | 0.98 | 0.17 | 1.29 | 0.17 | |
| 12 | 8 51 13.75 | +11 58 51.9 | 20.86 | 0.10 | 1.54 | 0.16 | 1.94 | 0.14 | |
| 13 | 8 51 13.81 | +12 0 27.2 | 22.30 | 0.15 | 1.20 | 0.19 | 1.72 | 0.19 | |
| 14 | 8 51 15.20 | +11 59 15.8 | 22.52 | 0.16 | 1.37 | 0.21 | 1.98 | 0.20 | |
| 15 | 8 51 15.57 | +11 59 51.4 | 22.76 | 0.16 | 1.22 | 0.22 | 1.64 | 0.20 | |
| 16 | 8 51 15.71 | +12 0 11.4 | 22.21 | 0.14 | 1.45 | 0.19 | 1.89 | 0.18 | |
| 17 | 8 51 15.83 | +12 0 25.1 | 21.94 | 0.12 | 1.24 | 0.17 | 1.86 | 0.17 | |
| 18 | 8 51 16.26 | +11 59 54.3 | 23.44 | 0.14 | 1.11 | 0.29 | 1.77 | 0.21 | |
| 19 | 8 51 16.51 | +12 0 15.5 | 20.13 | 0.09 | 1.57 | 0.14 | 1.92 | 0.13 | |
| 20 | 8 51 16.78 | +12 0 5.7 | 21.76 | 0.12 | 1.16 | 0.17 | 1.62 | 0.17 | |
| 21 | 8 51 16.87 | +12 0 7.7 | 21.31 | 0.11 | 1.36 | 0.16 | 1.99 | 0.15 | |
| 22 | 8 51 16.97 | +12 0 9.7 | 21.67 | 0.12 | 1.22 | 0.17 | 1.83 | 0.16 | |
| 23 | 8 51 17.25 | +12 0 24.0 | 21.28 | 0.10 | 1.50 | 0.16 | 1.93 | 0.15 | 0.3685 |
| 24 | 8 51 17.31 | +12 0 20.0 | 23.10 | 0.14 | 0.99 | 0.22 | 1.74 | 0.20 | |
| 25 | 8 51 17.41 | +12 0 19.2 | 22.69 | 0.16 | 1.09 | 0.21 | 1.72 | 0.20 | |
| 26 | 8 51 18.18 | +11 59 59.5 | 22.95 | 0.15 | 1.37 | 0.26 | 1.61 | 0.20 | |
| 27 | 8 51 18.45 | +11 58 30.3 | 23.41 | 0.14 | 1.51 | 0.32 | 1.78 | 0.21 | |
| 28 | 8 51 18.85 | +12 0 3.2 | 23.94 | 0.20 | 1.04 | 0.35 | 1.47 | 0.27 | |
| 29 | 8 51 19.02 | +11 59 42.9 | 21.32 | 0.11 | 1.50 | 0.16 | 1.88 | 0.15 | |
| 30 | 8 51 19.21 | +11 59 14.6 | 20.54 | 0.10 | 1.49 | 0.16 | 1.87 | 0.14 | |
| 31 | 8 51 19.64 | +12 0 2.7 | 21.78 | 0.12 | 1.12 | 0.17 | 1.89 | 0.17 | 0.3680 |
| 32 | 8 51 19.70 | +11 59 59.6 | 21.39 | 0.11 | 1.27 | 0.17 | 1.88 | 0.15 | |
| 33 | 8 51 20.11 | +11 59 55.7 | 21.74 | 0.12 | 1.49 | 0.17 | 1.88 | 0.17 | |
| 34 | 8 51 20.19 | +12 0 25.8 | 22.93 | 0.15 | 1.01 | 0.21 | 1.56 | 0.21 | |
| 35 | 8 51 20.56 | +12 0 5.4 | 23.23 | 0.14 | 1.00 | 0.24 | 1.46 | 0.21 | |
| 36 | 8 51 24.75 | +11 59 33.3 | 22.30 | 0.15 | 1.52 | 0.20 | 1.75 | 0.19 | |
| 37 | 8 51 26.19 | +12 0 3.9 | 22.21 | 0.14 | 1.29 | 0.19 | 1.91 | 0.18 | |
| 38 | 8 51 26.36 | +11 59 45.4 | 21.94 | 0.13 | 1.19 | 0.18 | 1.52 | 0.17 |
| Band | aaMagnitude of central point source | |||
|---|---|---|---|---|
| (″) | (kpc) | mag arcsec-2 | mags | |
| 3.07 | ||||
| 7.29 | ||||
| 11.5 |