SN1993J VLBI (I): The Center of the Explosion and a Limit on Anisotropic Expansion
Abstract
Phase-referenced VLBI observations of supernova 1993J at 24 epochs, from 50 days after shock breakout to the present, allowed us to determine the coordinates of the explosion center relative to the quasi-stationary core of the host galaxy M81 with an accuracy of 45 as, and to determine the nominal proper motion of the geometric center of the radio shell with an accuracy of 9 as yr-1. The uncertainties correspond to 160 AU for the position and 160 km s-1 for the proper motion at the distance of the source of 3.63 Mpc. After correcting for the expected galactic proper motion of the supernova around the core of M81 using HI rotation curves, we obtain a peculiar proper motion of the radio shell center of only km s-1 to the south, which limits any possible one-sided expansion of the shell. We also find that the shell is highly circular, the outer contours in fact being circular to within 3%. Combining our proper motion values with the degree of circular symmetry, we find that the expansion of the shockfront from the explosion center is isotropic to within 5.5% in the plane of the sky. This is a more fundamental result on isotropic expansion than can be derived from the circularity of the images alone. The brightness of the radio shell, however, varies along the ridge and systematically changes with time. The degree of isotropy in the expansion of the shockfront contrasts with the asymmetries and polarization found in optical spectral lines. Asymmetric density distributions in the ejecta or more likely in the circumstellar medium, are favored to reconcile the radio and optical results. We see no sign of any disk-like density distribution of the circumstellar material, with the average axis ratio of the radio shell of SN1993J being less than 1.04.
1 INTRODUCTION
Supernova SN1993J (catalog ) was discovered in a spiral arm of M81 (catalog ) (NGC3031 (catalog )) south south-west of the galaxy’s center by Garcia (Ripero & Garcia 1993) in the late evening of 1993 March 28, shortly after shock breakout, which occurred at UT (Wheeler et al. 1993) on the same day. It subsequently became the optically brightest supernova in the northern hemisphere since SN1954A and also one of the brightest radio supernovae ever detected (see Figure 1 for an optical and radio image of
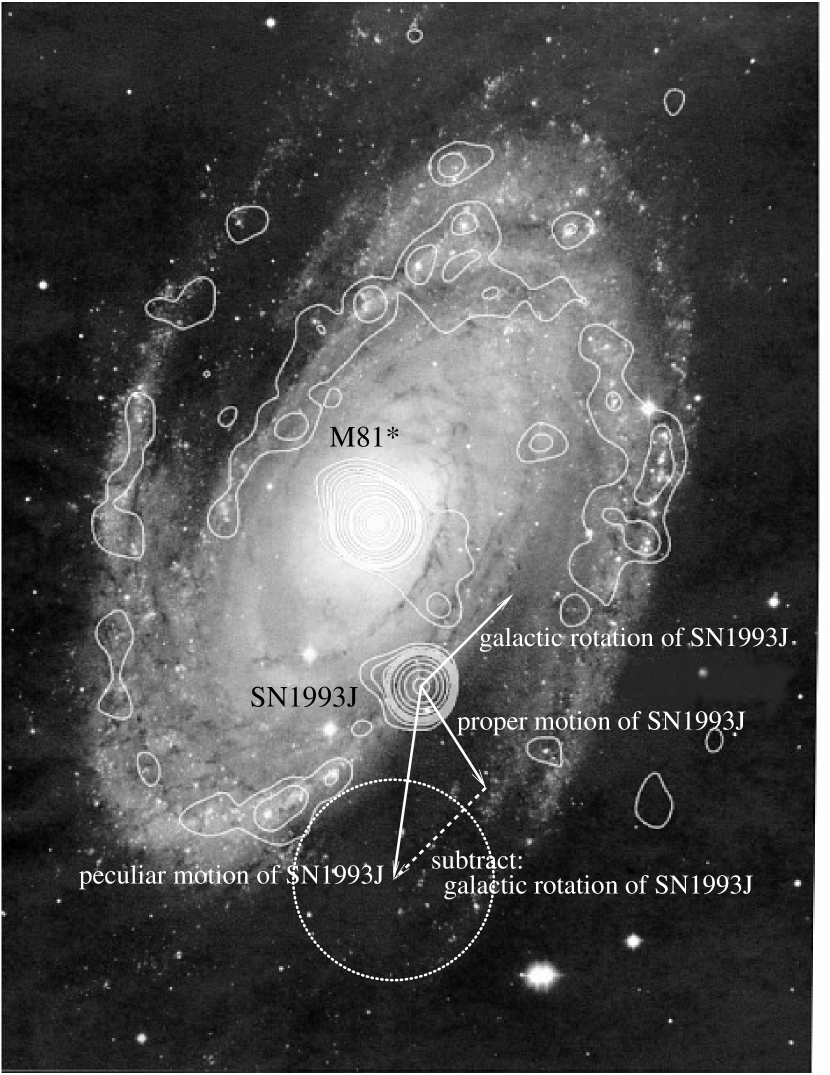
M81 showing SN1993J near the peak of its radio emission). At a Cepheid distance of Mpc (Freedman et al. 1994), SN1993J is also one of the closest extragalactic supernovae ever observed and is second only to SN1987A as the subject of intense observational and theoretical supernova studies. The precursor was identified soon after the supernova discovery (e.g. Humphreys et al. 1993) and found to be an approximately K0 I supergiant with a likely mass of 17 M☉ (Aldering, Humphreys & Richmond 1994) and a radius R☉ or AU (Clocchiatti et al. 1995).
The lightcurve and the spectral properties indicated that SN1993J was of Type IIb and was characterized by a low-mass hydrogen outer layer. Höflich, Langer, & Duschinger (1993) considered a massive ( M☉) single supergiant that had lost most of its hydrogen envelope through a strong wind. It is more likely, however, that the progenitor had the lower mass quoted above and that a close binary companion had stripped off most of its hydrogen envelope, leaving it with a residual hydrogen mass in the outer shell of 0.9 M☉ or less (Nomoto et al. 1993; Shigeyama et al. 1994; Bartunov et al. 1994), with most estimates being around 0.2 to 0.4 M☉ (e.g. Podsiadlowski et al. 1993; Woosley et al. 1994; Houck & Fransson 1996).
There were asymmetries in the spectral lines which suggested large asymmetries (e.g. Lewis et al. 1994; Spyromilio 1994) or clumps (Matheson et al. 2000a, b) in the supernova emission line regions. The asymmetry in at least one line, however, was found to be possibly due to line blending (Houck & Fransson 1996) which weakens somewhat the conclusions drawn from the asymmetries in other lines. A stronger indication for asymmetry came from the detection of significant time-variable optical polarization (Trammell et al. 1993; Tran et al. 1997), and may point to the need for a refinement of the explosion models. Most models are symmetric. They have the general characteristics of an imploding core with the creation of a neutron star (or possibly a black hole) in its gravitational center, and the subsequent formation of a shockfront that travels outward isotropically through the different layers of the progenitor and then breaks out through the surface. Asymmetric explosions may however occur if, for instance, the density distribution is not isotropic. Also, Burrows, Hayes, & Fryxell (1995) have found through their modeling of massive star explosions that shortly after the bounce the expansion has fundamentally anisotropic components and develops fingers with speeds twice the average expansion speed. Indeed, pulsars are known to have relatively large proper motions and a scale height of 400 pc in the -direction away from the galactic plane (Lyne & Graham-Smith 1990). This height is about five- to sevenfold larger than that of O-B stars (O’Connell 1958) and supernova remnants (e.g. Henning & Wendker 1975) and gives evidence for asymmetric explosions where the neutron star received a kick at the time of formation.
Thus an anisotropic velocity pattern may already be present when the shock front breaks through the surface. Further anisotropy could develop when the ejecta start to interact with a circumstellar medium (CSM) that itself may possess density anisotropies (Blondin, Lundqvist, & Chevalier 1996). These latter could be caused by the particular mass-loss pattern of the progenitor, perhaps with a predominance in the equatorial plane or perhaps with a bipolar outflow along the polar axis. In the binary scenario they could also be caused by a companion which, in stripping off a sizable quantity of the envelope in the millions of years before the explosion, would have substantially distorted the mass-loss density distribution.
To explain the observed polarization and its evolution with time, Höflich (1995) studied three different asymmetric geometries for the supernova: a) an overall ellipsoid for both inner and outer regions of the supernova, produced, e.g. through the differential rotation of the progenitor; b) an ellipsoidal inner region with a spherical shell, possibly produced by an aspherical explosion; and c) an overall spherical geometry with an off-center point source illuminating the envelope which roughly represents a binary system, or an aspherical 56Ni distribution in the ejecta. Höflich et al. (1996) favored model a), an oblate geometry with a ratio between the maximum and minimum axes or axis ratio of 1.7 seen edge-on, or model c), with the point source far inside the outer envelope. On the basis of other polarization data Tran et al. (1997) dismissed model a), and instead favored models b) and c), and in addition a model where the ejecta interacted with clumpy and anisotropically distributed material in the CSM.
Radio emission from SN1993J was discovered a few days after shock breakout (Pooley & Green 1993; Weiler et al. 1993; Phillips & Kulkarni 1993) and reached a peak of 120 mJy at 8.4 GHz. The radio lightcurve has been successfully modeled in terms of the interaction of the expanding shockfront with the CSM (van Dyk et al. 1994; Fransson & Björnsson 1998). The relatively high flux density, combined with M81’s short distance and high declination, made SN1993J an ideal target for investigations with the technique of VLBI, and guaranteed that it would become the best studied radio supernova ever.
Early VLBI observations resulted in size measurements (Bartel et al. 1993; Marcaide et al. 1993, 1994), determinations of the angular expansion velocity (Bartel et al. 1994; Marcaide et al. 1995a) and a 5% bound on any deviation from circular symmetry of the shape of the radio source from 30 to 91 days after shock breakout (Bartel et al. 1994). To reconcile the apparent differences between the radio and the optical polarization results, Tran et al. (1997) speculated that the explosion was asymmetric in the inner parts of the supernova but symmetric and isotropic in the outer envelope where the radio radiation originates. However, as we will show, circular symmetry within, say, 5% alone does not guarantee isotropic expansion within the same limit. A measurement from a fixed reference point, for example the explosion center, is needed to properly analyze the expansion of the radio shell for any anisotropy. Later, the shell-type morphology of the supernova was revealed (Bartel, Bietenholz, & Rupen 1995; Marcaide et al. 1995b) and the deceleration of the expansion determined (Marcaide et al. 1997; Rupen et al. 1998). We recently showed that the supernova was almost freely expanding during the first days, but that the expansion decelerated considerably thereafter, indicating a growing influence of the CSM on the radio shell and its evolution. The brightness distribution of the radio shell changed systematically over time, reflecting perhaps an anisotropic pattern in the CSM. After five years, the supernova has slowed down to half its original expansion velocity, suggesting that its evolution is now considerably influenced by the swept-up CSM. These results were summarized by Bartel et al. (2000a).
Here we start a series of papers to report in detail on the results from our comprehensive VLBI observations between 1993 and 2000. For almost all of our observations, and in particular for all the observations at 8.4 GHz which we report on here, we used the technique of phase-referencing with respect to the compact radio source in the center of M81. This technique allowed us to obtain the most unbiased images, and in addition and at least equally important, relative position determinations with an accuracy of up to 40 as. We recently found a quasi-stationary part in M81’s central radio source which is most likely the core and the gravitational center of the galaxy (Bietenholz, Bartel, & Rupen 2000; B00 hereafter). This finding enables us to investigate the motion of the supernova in a more fundamental way than if we did not have such a fixed galactic reference frame.
In this first paper of the series we determine the position of the explosion center astrometrically via phase-referencing, and subsequently the degree of isotropy of the expansion of the shock front from it. We describe our observations in § 2 and data reduction in § 3. In § 4 we give our results with representative images of SN1993J, determine the circularity of the outer contours of all the images, and give a limit on anisotropic expansion. In § 5 we discuss our results and in § 6 we give our conclusions. In the following papers we will present our results on the growing deceleration of the expansion (paper II), the sequence of images with the systematically changing structure (paper III), the determination of the dynamic distance to SN1993J and its host galaxy M81 (paper IV), and the spectral properties of the radio shell (paper V).
2 OBSERVATIONS
We observed SN1993J at 24 epochs between 1993 and 2000, and at frequencies between 1.7 and 23 GHz. We used a global array of between 11 and 18 telescopes, with a total time of 12 to 18 hours for each run. SN1993J’s high declination of 69° enabled essentially 100% visibility at most telescopes, and as a result, we obtained dense and nearly circular - coverage. As usual, a hydrogen maser was used as a time and frequency standard at each telescope. The data were recorded with the VLBA and either the MKIII or the MKIV VLBI systems with sampling rates of 128 or 256 Mbits per second. The characteristics of the observations are given in Table 1. At most epochs, both right and left circular polarizations were recorded.
All our 8.4 GHz images were phase-referenced, and for this purpose we alternated short scans of SN1993J and M81∗, the latter being the compact source in the center of the galaxy M81 and about 170″ away from SN1993J (Bietenholz et al., 1996; B00). We used a cycle time of min in which SN1993J was observed for 120s and M81∗ for 70s, except during the first few months in 1993 when we used a longer cycle time. In addition, the sources OQ208 and 0954+658 were observed occasionally during each observing session as fringe finders and calibrator sources. In each session, we recorded data at two to four frequencies out of a total of six (1.7, 2.3, 5.0, 8.4, 15, and 22 GHz), with 5.0 and 8.4 GHz being the standard frequencies used in most sessions. Here we report on results from VLBI observations at 8.4 GHz only.
3 DATA REDUCTION
3.1 Correlation, Calibration, and Imaging
The data were correlated with the NRAO VLBA processor in Socorro, New Mexico, USA. The analysis was carried out with NRAO’s Astronomical Image Processing System (AIPS) and a modified version of the AIPS task OMFIT. The initial flux density calibration was done through system temperature measurements at each telescope. For each experiment we first analyzed the data from M81∗ by a) fringe-fitting and then b) iteratively self-calibrating and imaging and/or model-fitting M81∗ in order to determine the complex antenna gains as a function of time. Phases were derived with a timescale of min and amplitudes with timescales of 1 to 2 h.
The complex antenna gains were then interpolated to the times of the interleaved supernova scans and applied to the supernova data to produce phase-referenced images of SN1993J. Because the two sources are so close on the sky, this procedure provides an excellent calibration of the supernova data. Our images are therefore of the highest quality given the relatively low radio brightness of the supernova. In fact, at later epochs, the source is too weak to be imaged at all without phase-referencing. In general we thus avoided the need to self-calibrate the supernova data with an arbitrary starting model, which can bias the final image especially if the source is weak. In case of the first ten epochs, however, the supernova was still relatively strong and the signal to noise ratio was sufficient to allow further improvement of the image quality. We achieved this improvement by additionally self-calibrating the antenna-based phases of the supernova data for the first ten epochs, using as a model the corresponding phase-referenced image of the supernova.
The images were deconvolved using the CLEAN algorithm. The CLEAN components were then convolved with a circular Gaussian restoring beam whose diameter was chosen to be approximately equal to or larger than the maximum axis of the elliptical Gaussian fit to the inner portion of the “dirty beam” from the uniformly weighted - data. Finally the residuals from the deconvolution process were added to the CLEAN components. Apart from improving the quality of our images for the early epochs and allowing images to be made at all for the later epochs, phase-referenced imaging also provided astrometric information relative to our reference source. SN1993J is therefore not located at the phase center of our images as it would be if self-calibration were used exclusively, but offset somewhat. Even for the epochs where self-calibration was used to improve the image quality, the position of the supernova is known from the strictly phase-referenced image, and the positions for the shell center that we use later are derived exclusively from the phase-referenced data before any self-calibration. The offset from the phase center reflects a more accurate position of the center of the supernova with respect to M81∗ than is given by the a priori coordinates of M81∗ and SN1993J used in the correlator model. The determination of this offset and its uncertainty is an important part of our analysis and is discussed in detail below.
3.2 Model-fitting
In addition to imaging we used model-fitting. As a model, we used the two-dimensional projection of a three-dimensional spherical shell of uniform volume emissivity, which we fit by weighted least squares to the calibrated - data. From these model-fits, we derived the shell’s center coordinates, and , with respect to the coordinates of the phase center of the supernova for each epoch, . These center coordinates, as stated above, were derived prior to any self-calibration of the supernova data. Since all group delays, phase delays, and phase delay rates used in the data analysis are residuals with respect to the corresponding a priori delays and rates in the correlator software model (CALC 6.0 till 1995 Apr. 10; CALC 8.1 till 1999 Nov. 18, and CALC 9.1 thereafter), the phase center simply corresponds to the nominal coordinates of the supernova used in the correlator model, for which all residual non-structure delays would be zero.
We also fit the radius of the shell at each epoch. For the last several epochs, where the supernova was sufficiently resolved for the shell thickness to be estimated with useful accuracy, we further estimated the outer radius, , and inner radius, , separately. The mean of the ratio for these epochs was , and was constant within the uncertainties (Bartel et al. 2000a). Then, for all epochs, we fit only with fixed at 111We use the value of 1.25 as a rounded, earlier value of the average ratio . This small difference does not significantly change our results.. It is from this last consistent set of fits that the values of and used in this paper were determined. We will discuss the radii and in detail in a future paper.
4 RESULTS
4.1 The Degree of Circularity in the Images
In Figure 2 we display four representative 8.4 GHz images
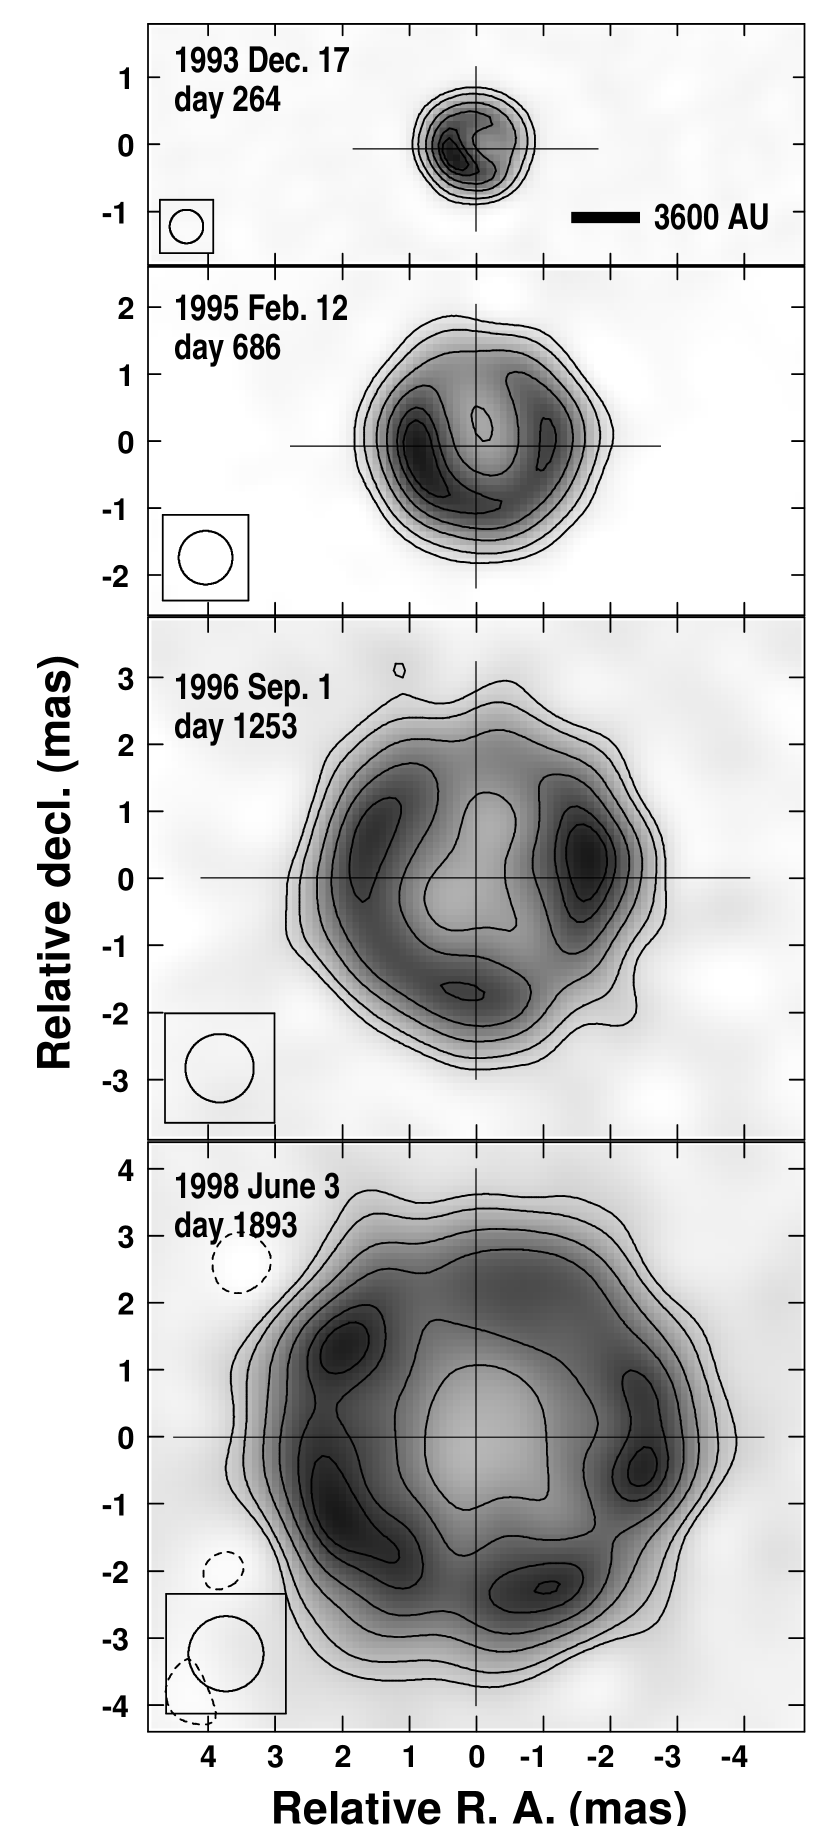
of the supernova at 264 d, 686 d, 1253 d, and 1893 d after shock breakout. For the origin of the coordinate systems in this figure, we choose the position of the geometric center of the fit radio shell (i.e. offset at from the phase center position). For a full sequence of images up to 2000 February, see Bietenholz et al. (2001); see an earlier version until June 1998 in Bartel et al. (2000a). A complete sequence of images at 8.4 and 5.0 GHz will be presented in a future paper.
Although the brightness is modulated along the ridge and is therefore rotationally asymmetric, the shape of the supernova at the lower contours is quite circular. We define to be the radius of the 20% contour around the center coordinates, and , of the fit shell. The variation of with azimuth for a particular epoch gives a measure of the departures from circular symmetry. In Figure 3 we show plots of the variation of about

its mean value vs. the position angle, p.a., for the same epochs as are shown in Fig. 2.
The rms variation of is less than 5% for any epoch after 1994. Taking the average over all the epochs from December 1993 onwards, when the supernova had become sufficiently resolved for a useful determination of departures from circular symmetry, we find that the rms deviations from circular symmetry are 3.8%. This value is likely an upper limit to the true deviations from circular symmetry, since a fraction of the observed deviations must be due to noise and CLEAN instabilities. In particular for the latest epochs, where the dynamic range is relatively low, one would expect a substantial contribution to the rms in from noise. In the case of small intrinsic variations in one would expect that the angular scale of the variation in would be similar to the resolution, as is in fact observed (Fig. 3). If we average the deviations over 30° in azimuth, we obtain a slightly lower figure of 3.1%, although a substantial fraction of this value is likely still due to noise. The real deviations from circularity not due to the noise or deconvolution are almost certainly %.
A different measure of circularity is the ellipticity, which is more sensitive to bimodal distortions. We determined the ellipticity by fitting an ellipse to values of by least squares. We find that the maximum observed axis ratio (ratio of the maximum to the minimum axis) is 1.07. The (pseudo-vector) average axis ratio is , at a p.a. of . We consider this ratio not significantly different from the circular axis ratio of 1.0. The slight difference may be due to distortions of the 20% contour caused by the eastern and western hot-spots, visible from 1995 on. We can accordingly place a formal limit on the average axis ratio of 1.04.
However, these bounds only partly constrain the degree of anisotropic expansion that the supernova may have undergone. For instance, differences between expansion velocities along different cuts through the supernova center would manifest themselves to first order in an elliptical shape of the supernova. Differences along the same cut in opposite directions, however, would shift the geometric center of the supernova in the direction of faster flow, but could leave the shape of the supernova relatively unchanged. In Figure 4, the

solid line illustrates how a supernova which has larger velocities along the axis develops an approximately elliptical structure, in this case with an axis ratio of 2. This ratio also quantifies the degree of anisotropy of the expansion: the ratio of the maximum to the minimum expansion velocity is also 2. The dashed line illustrates a supernova with the same ratio of the maximum to the minimum expansion velocity of 2, but where the expansion velocity does not have the same magnitude in opposite directions, i.e. the expansion along the positive axis is faster than in the opposite direction. The supernova remains circular, but the geometric center of the structure shifted in the direction of maximum expansion. In other words, by measuring only deviations from a circular structure, bipolar and multipolar expansion are well constrained, but one-sided expansion is less so. In order to constrain the latter, the center of explosion has to be determined, and the geometric center coordinates for each epoch, and , have to be plotted with respect to the explosion center in a fixed reference frame.
4.2 The Core in M81∗ as a Reference Point
As described in §3.2 above, the geometric center coordinates of the supernova shell, and , are determined relative to the position of the phase center of the corresponding supernova image for each of our epochs. The position of the phase center, however, is subject to variation from epoch to epoch since it corresponds only approximately to the “absolute” position on the sky. Errors in the tropospheric and ionospheric delays used at the correlation stage, as well as small errors in UT1, polar motion, and antenna coordinates in the correlator model, all contribute to the positional changes from epoch to epoch, and therefore limit the accuracy of the phase center position.
Since we phase-referenced to M81∗, the nearby central radio source of the galaxy, the position of the phase center of the supernova is a differential position, namely with respect to the position of the phase center of M81∗, which is essentially the position of the brightness peak of M81∗. The uncertainty of the differential position of the supernova phase center is due to only the differential parts of the above errors in the correlator model, which, over only on the sky, are much smaller. In total, the errors in the correlator model contribute not more than 10 as to the uncertainty of a differential position determination of any fiducial point in the brightness distribution of SN1993J (see Bartel et al. 1986, for an estimate of such errors for the close pair of quasars 3C345 and NRAO512 at the same frequency).
The brightness peak of M81∗, however, is not a stable reference point. As was shown by B00, it is part of a one-sided jet whose position, size, and orientation are variable on a time scale of months. The most stable point in the brightness distribution of M81∗ lies near one end of the brightness distribution, on average 0.3 mas southwest of the brightness peak. B00 identified this point with the core of M81∗, and therefore we will call it M81. It is likely associated with the gravitational center of the galaxy and can serve as an almost ideal reference point for monitoring the slight changes in position of the geometric center of the supernova shell.
In fact, the determination of M81’s position is not independent of the determinations of SN1993J’s position: B00 determined the most stable point in the brightness distribution of M81∗ as precisely that one which minimized the variation in the differential position of the geometric center of SN1993J over all epochs. Thus any determination of the changes in the position of SN1993J with respect to that of M81 with our data must simultaneously involve a determination of the location of M81 itself. Accordingly, we update the analysis of B00. We solved simultaneously and by least squares for the following parameters:
-
1. The displacement of M81 with respect to the brightness peak of M81∗. This displacement is taken to be along the direction of elongation of M81∗ and is measured in units of the full-width at half-maximum (FWHM) of an elliptical Gaussian fit to the brightness distribution of M81∗ (see B00).
-
2. The position of the explosion center, ie., the position of the geometric center of the radio shell of SN1993J at the time of explosion.
-
3. The proper motion of the geometric center of the radio shell of SN1993J.
The input values to this calculation were:
1. The offsets of the geometric center of SN1993J from the phase center at each epoch, . We determined the total error of and by adding in quadrature a) the aforementioned systematic errors of 10 as, b) systematic errors induced through mapping and model-fitting and estimated by monitoring the change of the center coordinate solutions when only right-circularly or left-circularly polarized data were used for the fit, and c) statistical errors from the model-fit. We obtained a rounded total error of 40 as for each epoch.
2. The times since explosion for each epoch, (no uncertainties assumed).
3. The size and orientation of the central elliptical Gaussian of M81∗ at each epoch. The uncertainties are taken from B00, namely 30 as in the FWHM and 3° in the p.a.
4.3 The Center of Explosion and the Proper Motion of the Supernova
We now give the results from the least squares fit discussed above. The standard errors for each of the fit parameters are the sum in quadrature of the statistical uncertainties in the fit, and the rms scatter obtained from a Monte-Carlo simulation where we varied the input values randomly according to their uncertainties as given in the previous section. We note that the rms of the residuals in position for the center of SN1993J is 40 as, which is consistent with the value we used for the positional uncertainty.
First we obtained a value for the displacement of M81 with respect to the brightness peak of M81∗ of FWHM, which is consistent with, but more accurate than, the earlier value of B00. On average, this value corresponds to mas, with an uncertainty at each epoch mas.
This determination of the position of M81 is supported by preliminary results from our observations of the pair of sources M81∗ and SN1993J at other frequencies, where we found that radio emission at higher frequencies tends to emanate closer to our core position (Ebbers et al. 1998). We expect to obtain a more accurate value of the position of M81 when the multi-frequency part of our phase-referencing observations is finished. Spectral index maps of M81∗ could then be made and the optically thick part of the brightness distribution of M81∗ used for another identification of M81.
What is the “absolute” position of M81? Since the structure of M81∗ is variable from epoch to epoch, the position of its phase center will be slightly variable from epoch to epoch with respect to the assumed fixed position of M81. We chose the absolute position of M81 such that the average position of the phase center (or brightness peak) is coincident with the position of M81∗ used in the correlator model, which is tied to the ICRF222ICRF: International Celestial Reference Frame. We give this position of M81∗ and the position of M81 in Table 2.
Second we obtained a value for the coordinates of the explosion center, and , also listed in Table 2. It has a standard error of 45 as which corresponds to AU at the distance of M81.
Finally we obtained a value for the proper motion of the geometric center of SN1993J, again listed in Table 2. We list the coordinates of the geometric center of SN1993J, and , relative to the explosion center in Table 3 and plot them in Figure 5. The fit proper motion is displayed as a straight

line in each of the panels.
For a distance to M81 of 3.63 Mpc the proper motion estimate corresponds to projected velocity components of km s-1 in R.A. and km s-1 in decl. We expect galactic proper motion of the supernova around M81∗, since the supernova most likely takes part in the galactic rotation. The expected velocity can be estimated from the HI rotation curve (Adler & Westpfahl 1996; See also Rots & Shane 1975) to be km s-1 in R.A. and km s-1 in decl., where the uncertainty is also estimated from the rotation curve and includes a contribution from possible non-circular motions. Subtracting the galactic proper motion from the measured proper motion gives a nominal value for the peculiar proper motion of the geometric center in the co-rotating galactic reference frame of km s-1 in R.A. and km s-1 in decl. or km s-1 at p.a. °. These values and their standard errors are listed in Table 2. We illustrate the various proper motions discussed above on the optical/radio image of the galaxy M81 in Figure 1.
4.4 Error Analysis
How much are our results on the center of explosion and the proper motion of the geometric center of the supernova dependent on structure changes of the phase-reference source M81∗ and the supernova radio shell itself? The effects of structure changes of the phase-reference source were largely compensated for by determining the position of M81, rather than using the variable position of the brightness peak. However, since the parameterization of M81∗ is not unique, and our determination of the location of M81 within the brightness distribution is uncertain at a level of as, a small residual motion of M81 with respect to the true location of the black hole is not excluded. Our uncertainties include this possibility. Such a motion would be expected to be along the average long axis of M81∗. The fact that our proper motion for the center of SN1993J w.r.t. M81 is roughly along this axis suggests this may indeed be the case, so it is likely that our peculiar velocity represents in fact an upper limit to the true peculiar velocity of the center of SN1993J.
To investigate the effects of the structure changes of the supernova radio shell, we compared the geometric center determined by model-fitting the - data to the center of the 20% contour of our images. We did not find any significant bias: the vector mean and rms of the difference over all images after 1993 November were only 11 and 37 as, respectively. However, it is likely that both the model-fit and the 20% contour are biased in a similar way. To check this possibility, we computed simulations in which we artificially modulated the brightness distribution of a projected spherical shell. We found that a simple, sinusoidal modulation in azimuth indeed somewhat biases the center coordinates of a fit symmetric model towards the brighter side of the image and the radius towards smaller values. However, these biases are smaller than our uncertainties for any realistic degree of such modulation, and they become yet smaller for more complex modulations.
In fact, when we exclude the data from the first 520 days which, if any, are most likely to be biased, we obtain coordinates of the center of explosion and a proper motion different by less than our stated standard errors. We conclude that there is no evidence for any significant systematic effects on the coordinates of the explosion center and the proper motion of the geometric center of the supernova from structure changes of either M81∗ or the supernova radio shell.
4.5 Limit on Anisotropic Expansion
While the peculiar proper motion of the geometric center of the radio shell is at the level and therefore hardly significant, it is not in fact expected to be zero. First momentum conservation dictates that the supernova shell and the putative pulsar must inherit the momentum of the progenitor. The shell as a whole would thus be expected to have a proper motion similar to that of the progenitor. The peculiar motion of the progenitor, however, is almost certainly considerably less than 320 km s-1: the peculiar velocity dispersion of F-M supergiants in the solar neighborhood is km s-1 (Binney & Merrifield 1998). Second anisotropic expansion of the supernova shell would lead to a proper motion of its geometric center. Since the contribution of the progenitor’s peculiar proper motion is likely insignificant, the proper motion of the center of the supernova shell can thus give us information about possible anisotropic expansion.
In particular, we can constrain the degree of anisotropic expansion by combining the peculiar proper motion of the geometric center in the co-rotating galactic reference frame with the bound on any deviation from circular symmetry of the supernova radio shell in the plane of the sky. The bound on the proper motion of the center of the shell is 28 as yr-1, so after five years, at the time of the observations of the radio shell in the last panel of Figure 2, the bound on the distance traveled by the geometric center of the supernova is 150 as. This distance limit is 4.6% of the outer radius of the radio shell. Adding this value in quadrature to the bound on circularity deviations (over 30° in azimuth) of 3.1% gives a bound on anisotropic expansion of the radio shell of 5.5%.
5 DISCUSSION
Twenty four epochs of observations of SN1993J, over nearly seven years from the time of explosion to the present, phase-referenced to the almost ideal reference point of the core of the host galaxy, have significantly advanced our knowledge of the evolution of supernova radio shells. In our Galaxy radio shells of supernovae have been observed at most over about 10% of the supernova’s age. SN1993J has been observed over essentially 100% of its age. In this first of a series of papers, we determined the position of the explosion center in the galactic reference frame with an accuracy of AU. This is the reference point with respect to which the expansion of the radio shell can best be measured in a physically meaningful way, from the first tens of days after the explosion to the present and for years to come. We determined an upper limit on any anisotropic expansion in the plane of the sky of 5.5%. This result is important as a limiting factor in discussions concerning an asymmetry of the explosion, the recoil velocity of a central pulsar that is expected to have formed, distortion of the ejecta velocity pattern by a binary companion, asymmetries in the CSM caused by anisotropies in the mass-loss to wind-velocity ratio of the progenitor or by the influence of a binary companion, and in determining part of the error of the dynamic distance estimate of SN1993J and its host galaxy. We will discuss each of the aspects in turn.
5.1 Constraint on Asymmetry of the Explosion
Recent modeling of core-collapse supernova explosions (Burrows et al. 1995) suggests that they have fundamentally heterogeneous and anisotropic components. During the first several tens of milliseconds after the bounce when the explosion commences, plumes and fingers can emerge with velocities twice as large as the velocity of the shock wave itself. Those authors find that these characteristics of the explosion process are consistent with the asymmetries found in the infrared line profiles of SN1987A and the “shrapnel” observed in some supernova remnants, like Cas A and Vela. SN1993J provided us with images from the earliest times after the explosion of any supernova yet, and may therefore be of particular interest for searching for traces of such jet-like features from the explosion process. No such anisotropies, however, have yet been found. If they are as yet unresolved, then they could perhaps become visible in future observations, when we will have increased relative resolution due to the continuing expansion of the supernova.
Asymmetries in the ejecta are indicated by the time-variable optical polarization (Trammell et al. 1993; Tran et al. 1997) and perhaps by the optical spectral lines (e.g. Lewis et al. 1994; Spyromilio 1994; Matheson et al. 2000a, b). With the addition of the astrometric result, our current limit on any anisotropic expansion of the outer rim of the radio shell in the plane of the sky is more stringent than our previous limit, which was based on the degree of circular symmetry of the radio shell alone. If the velocity isotropy we measure for the shock front in the plane of the sky is a good indication of the degree of velocity isotropy in space, then Höflich’s (1995) model a) of an overall elliptical structure of the supernova produced e.g. through rotation of the progenitor would have to be dismissed. The only way to reconcile the results from the optical with those from the radio observations in terms of asymmetries in the ejecta is to assume a model along the lines of Höflich’s (1995) model b) of an ellipsoidal inner region with a spherical shell, or model c) of an overall spherical geometry with an off-center point-like source represented, e.g., in the binary scenario.
In this context it is of interest to compare the optical with the radio results for SN1987A, the only other supernova for which both optical polarization measurements and VLBI images have been obtained. Based on the optical polarization, several authors (e.g., Barrett 1988; Cropper et al. 1988; Mendez et al. 1988; Jeffery 1991) concluded that the ejecta were characterized by asymmetries of at least 10%. The radio images of SN1987A (Gaensler et al. 1997) appear relatively round, although asymmetries of up to 10% are not excluded. The only other imaged radio supernova is SN1986J, and its geometry is less circular than either SN1993J or SN1987A (Bartel et al. 1991). Furthermore, young supernova remnants in M82 have been imaged, and they are also less circular (e.g. Pedlar et al. 1999; Bartel et al. 1987). Different ejecta characteristics and/or circumstellar environments may have contributed to the asymmetries. Also, the supernova remnants in M82 were imaged when they were much older than SN1993J was at our last epoch, so it is possible that asymmetries grow with time and may become apparent in SN1993J in future observations.
5.2 Limit on the Recoil Velocity of a Central Pulsar
The average speed of radio pulsars at birth is km s-1 (Lyne & Lorimer 1994; Frail, Goss, & Whiteoak, 1994), which is significantly higher than that of stars. The most natural explanation is that neutron stars receive a kick when they are formed. Asymmetries in the explosion may cause such kicks (e.g. Burrows et al. 1995). Since the pulsar expected from SN1993J is (as yet) undetected (Bartel et al. 2000b) we cannot directly determine its velocity, but the assumption of momentum conservation allows us to estimate an upper limit. It is unlikely that the pulsar acquires more than, say, 1/4 of the momentum imparted to the shell. Then, taking our proper motion of the shell’s geometric center of 320 km s-1, a shell mass of 16 M☉, and a neutron star mass of 1.4 M☉, and assuming the progenitor’s momentum to be negligible, we find the pulsar’s projected velocity unlikely to exceed km s-1. This implies that the pulsar is still within 0.4 mas of the center of the shell.
5.3 Constraint on Anisotropy in the Density of the CSM
Anisotropy in the density distribution of the CSM could be responsible for any non-sphericities the radio shell may display. This could be caused, for example, by a supernova exploding near a molecular cloud. Dohm-Palmer & Jones (1996) have investigated this case, and find that the supernova shell remains almost circular in the early stages, but that the geometric center shifts towards the region of lower density. Such anisotropy could also be caused by a latitude-dependent ratio of mass-loss to wind-velocity, , leading, e.g., to a bipolar outflow along the polar axis of the progenitor, or to an equatorial outflow resulting in a disk-like density distribution. The influence of a binary companion would likely also cause an anisotropic CSM.
Blondin, Lundqvist, & Chevalier (1996) used hydrodynamic modeling to study how the interaction zone deforms when isotropic ejecta expand into a CSM with an anisotropic density distribution. Assuming density profiles for the ejecta and the CSM of and with and , they studied the axis ratio of the self-similar density wave, or by implication the radio shell, as a function of a model axisymmetric about the polar axis and reflection symmetric about the equator with different ratios of the equatorial and polar densities. They found that for small polar to equatorial density ratios, the axial ratio of the supernova shell was only slightly larger than that expected in the case of purely radial motion, where the axial ratio is proportional to the density ratio to the power of .
The assumed values for and in Blondin et al.’s model are consistent with those for the late evolution of SN1993J (Bartel et al. 2000a), and their model can therefore be used to place useful limits on the density distribution of the CSM around SN1993J. Extrapolating from Blondin et al. we find, for times applicable to those of our SN1993J measurements, that our upper limit on the axis ratio of 1.04 gives a limit of the density ratio of approximately 1.2. This limit indicates that a spherically symmetric density distribution dominates, and that any disk-like component of the density distribution is small. In any case, deformations of the radio shell, whether they are caused by a disk-like or an irregular density distribution of the CSM, may need time to develop. The expansion velocity of the shockfront had already slowed from about km s-1 at the start of our observations to km s-1 by June 1998 (Bartel et al. 2000a), indicating that swept-up material of the CSM already dominates the evolution of the radio shell. It may be just a matter of time till significant protrusions and other asymmetries develop. Having determined the center of explosion and being able to identify that center in any image at future observing epochs will make us very sensitive in measuring such asymmetries.
5.4 The Binary Scenario
In the likely case that the progenitor of SN1993J had a binary companion, that companion could perhaps have influenced the density distribution of the CSM. Lundqvist (1994) argues that the result of such influence would be a disk-like density distribution. We see no sign of a disk-like density distribution in our images. Our limit on the axis ratio can constrain any disk-like density distribution, provided it extends beyond the radius of our first image or AU. This extent, however, is much larger than the orbital size of any plausible binary system, and so it is not clear whether a disk-like density distribution of this size might realistically result from the influence of the binary companion.
If we postulate a disk of extent AU, then our limit on the axis ratio above suggests either that the density distribution in fact resembles a slightly flattend sphere rather than a disk, or that we are seeing the disk almost face on. In the latter case, the evolving azimuthal variations along the ridge of SN1993J might be a reflection of the azimuthal density distribution and its changes with time.
5.5 Improving the Accuracy of a Dynamic Distance Estimate
Finally, the bound on anisotropy in the radio shell velocities is important for determining the uncertainty of a dynamic distance estimate for SN1993J and its host galaxy M81. The distance can be determined directly (Bartel 1984; Bartel et al. 1985) by combining the radial velocity in optical spectra, determined from the blue edge of the H absorption trough (Trammell, Hines, & Wheeler 1993; Lewis et al. 1994) with the transverse angular velocity of the outer boundary of the radio shell. One component in the error budget for the distance is the degree to which radial and transverse velocities are the same. Save for conspiracies, our limit on anisotropic velocities in the plane of the sky also gives a reasonable limit on the anisotropic velocities in three dimensions, and is therefore useful for constraining the error of the distance. A paper on the distance determination is in preparation.
6 CONCLUSIONS
Here we list a summary of our main conclusions.
1. We determined the center of explosion of SN1993J relative to M81 with a standard error of 45 as or AU, only times the estimated radius of the progenitor.
2. We could thus accurately determine the location of the center of explosion in each of the VLBI images. We can also accurately determine the location of the explosion center in images from future phase-referenced observations of SN1993J.
3. Despite the brightness varying with azimuth along the ridge, we found no protrusions. The outer contour of the radio shell is circular to within 3%.
4. The geometric center of the radio shell has a nominal proper motion of as yr-1 in R.A. and as yr-1 in decl. relative to M81 which is presumably the black hole and gravitational center of the galaxy. For a distance of 3.63 Mpc, the values correspond to velocity components of km s-1 and km s-1, respectively. After correction for galactic HI rotation, the peculiar proper motion of the geometric center of the radio shell relative to M81 is km s-1 in R.A. and km s-1 in decl.
4. The expansion velocity of the shockfront is isotropic to within 5.5% in the plane of the sky.
5. The circularity of the outer contours of the radio shell and the degree of isotropic expansion of the shockfront constrain the large-scale density distribution of the circumstellar medium. We saw no sign of a disk-like density distribution of the CSM. The average axis ratio for elliptical fits to the 20% contour of the shell was . If a disk-like density distribution was formed by the purported binary system before the explosion, and if such distribution extends over 1000’s of AU, then we are seeing the disk close to face-on.
6. The swept-up material is likely to have an increasing influence on the evolution of the radio shell in the years to come. Significant anisotropic expansion may develop in the future, and any anisotropy will likely first be detected reliably with the combination of imaging and astrometry presented in this paper.
References
- (1)
- (2) Adler, D. F., & Westpfahl, D. J. 1996, AJ, 111, 735
- (3) Aldering, G., Humphreys, R. M., & Richmond, M. 1994, AJ, 107, 662
- (4) Barrett, P. 1988, MNRAS, 234, 937
- (5) Bartel, N. 1984, in Supernovae as Distance Indicators, Lecture Notes in Physics, ed. N. Bartel (Berlin: Springer), 221
- (6) Bartel, N., Bietenholz, M. F., & Rupen, M. P. 1995, Proc. Nat. Acad. Sci., 92, 11374
- (7) Bartel, N., Herring, T. A., Ratner, M. I., Shapiro, I. I., & Corey, B. E. 1986, Nature, 319, 733
- (8) Bartel, N., Ratner, M. I., Rogers, A. E. E., Shapiro, I. I., Bonometti, R. J., Cohen, N. L., Gorenstein, M. V. Marcaide, J. M., & Preston, R. A. 1987, ApJ, 323, 505
- (9) Bartel, N., Rupen, M. P., Shapiro, I. I., Preston, R. A., & Rius, A. 1991, Nature, 350, 212
- (10) Bartel, N., Shapiro, I. I., Gorenstein, M. V., Gwinn, C. R., & Rogers, A. E. E. 1985, Nature, 318, 25
- (11) Bartel, N., et al. 1993, IAU Circ., 5914
- (12) Bartel, N., et al. 1994, Nature, 368, 610
- (13) Bartel, N., et al. 2000a, Science, 287, 112
- (14) Bartel, N., et al. 2000b, in IAU Colloquium 177: Pulsar Astronomy - 2000 and Beyond, ed. M. Kramer, N. Wex and R. Wielebinski (San Francisco: ASP), 515
- (15) Bartunov, O. S., Blinnikov, S. I., Pavlyuk, N. N., & Tvsetkov, D. Yu. 1994, A&A, 281, L53
- (16) Bietenholz, M. F., Bartel, N., & Rupen, M. P. 2000, ApJ, 532, 895, (B00)
- (17) Bietenholz, M. F., et al. 1996, ApJ, 457, 604
- (18) Bietenholz, M. F., et al. 2001, in IAU Symposium 205: Galaxies and Their Constituents at the Highest Angular Resolution, ed. R. T. Schilizzi, S. Vogel, F. Paresce & M. Elvis, (San Francisco: ASP) in press
- (19) Binney, J. & Merrifield, M. 1998, Galactic Astronomy (Princeton: Princeton University Press)
- (20) Blondin, J. M., Lundqvist, P., & Chevalier, R. A. 1996, ApJ, 472, 257
- (21) Burrows, A., Hayes, J., & Fryxell, B. A. 1995, ApJ, 450, 830
- (22) Clocchiatti, A., Wheeler, J. C., Barker, E. S., Filippenko, A. V., Matheson, T., & Liebert, J. W. 1995, ApJ, 446, 167
- (23) Cropper, M., Bailey, J., McCowage, J, Cannon, R. D., & Couch, W. J. 1988, MNRAS, 231, 695
- (24) Dohm-Palmer, R. C., & Jones, T. W. 1996, ApJ, 471, 279
- (25) Ebbers, A., Bartel, N., Bietenholz, M. F., Rupen, M. P., & Beasley, A. J. 1998, in IAU Colloquium 164: Radio Emission from Galactic and Extragalactic Compact Sources, ed. J. A. Zensus, J. M. Wrobel, & G. B. Taylor, (San Francisco: ASP), 203
- (26) Frail, D. A., Goss, W. M., & Whiteoak, J. B. Z. 1994, ApJ, 437, 781
- (27) Fransson, C., & Björnsson, C.-I. 1998, ApJ, 509, 861
- (28) Freedman, W. L., et al. 1994, ApJ, 427, 628
- (29) Gaensler, B. M., Manchester, R. N., Staveley-Smith, L., Tzioumis, A. K., Reynolds, J. E., & Kesteven, M. J. 1997, ApJ, 479, 845
- (30) Henning, K., & Wendker, H. J. 1975, A&A, 44, 91
- (31) Höflich, P. 1995, ApJ, 440, 821
- (32) Höflich, P., Langer, N., & Duschinger, M. 1993, A&A, 275, L29
- (33) Höflich, P., Wheeler, J. C., Hines, D. C., & Trammell, S. R. 1996, ApJ, 459, 307
- (34) Houck J. C., & Fransson, C. 1996, ApJ, 456, 811
- (35) Humphreys, R. M., Aldering, G. S., Bryja, C. O., Thurmes, P. M., & Richmond, M. 1993, IAU Circ., 5739
- (36) Jeffery, D. J. 1991, ApJS, 77, 405
- (37) Lewis, J. M., et al. 1994, MNRAS, 266, L27
- (38) Lundqvist, P. 1994, in Circumstellar Media in the Late Stages of Stellar Evolution, ed. R. E. S. Clegg, I. R. Stevens, & W. P. S. Meikle, (Cambridge: Cambridge Univ. Press), 213
- (39) Lyne, A. G., & Graham-Smith, F. 1990, Pulsar Astronomy (Cambridge: Cambridge Univ. Press)
- (40) Lyne, A. G., & Lorimer, D. R. 1994, Nature, 369, 127
- (41) Marcaide J. M., et al. 1993, IAU Circ., 5820
- (42) Marcaide J. M., et al. 1994, ApJ, 424, L25
- (43) Marcaide J. M., et al. 1995a, Science, 270, 1475
- (44) Marcaide J. M., et al. 1995b, Nature, 373, 44
- (45) Marcaide J. M., et al. 1997, ApJ, 486, L31
- (46) Matheson, T., et al. 2000a, AJ, 120, 1487
- (47) Matheson, T., Filippenko, A. V., Ho, L. C., Barth, A. J., & Leonard, D. C. 2000b, AJ, 120, 1499
- (48) Mendez, M., Clocchiatti, A., Benvenuto, O. G., Feinstein, C., & Marraco, H. G. 1988, ApJ, 334, 295
- (49) Nomoto, K., Suzuki, T., Shigeyama, T., Kumagai, S., Yamaoka, H., & Saio, H. 1993, Nature, 364, 507
- (50) O’Connell, D. J. K. 1958, Stellar Populations (New York: Interscience)
- (51) Pedlar, A., Muxlow, T. W. B., Garrett, M. A., Diamond, P., Wills, K. A., Wilkinson, P. N., & Alef, W. 1999, MNRAS, 307, 761
- (52) Phillips, J. A., & Kulkarni, S. R. 1993, IAU Circ., 5884
- (53) Podsiadlowski, Ph., Hsu, J. J. L., Joss, P. C., & Ross, R. R. 1993, Nature, 364, 509
- (54) Pooley, G. G., & Green D. A. 1993, MNRAS, 264, L17
- (55) Ripero, J., & Garcia, F. 1993, IAU Circ., 5731
- (56) Rots, A. H., & Shane, W. W. 1975, A&A, 45, 25
- (57) Rupen, M. P., et al. 1998, in IAU Coll. 164: Radio Emission from Galactic and Extragalactic Compact Sources, ed. J. A. Zensus, G. B. Taylor, & J. M. Wrobel (San Francisco: ASP), 355
- (58) Sandage, A. 1961, The Hubble Atlas of Galaxies, (Washington: Carnegie Institution of Washington)
- (59) Shigeyama, T., Suzuki, T., Kumagai, S., Nomoto, K., Saio, H., & Yamaoka, H. 1994, ApJ, 420, 341
- (60) Spyromilio, J. 1994, MNRAS, 266, L61
- (61) Trammell, S. R., Hines, D. C., & Wheeler, J. C. 1993, ApJ, 414, L21
- (62) Tran, H. D., Filippenko, A. V., Schmidt, G. D., Bjorkman, K. S., Jannuzi, B. T., & Smith, P. S. 1997, PASP, 109, 489
- (63) Van Dyk, S. D., Weiler, K. W., Sramek, R. A., Rupen, M. P., & Panagia, N. 1994, ApJ, 432, L115
- (64) Weiler, K. W., Sramek, R. A., Van Dyk, S. D., & Panagia, N. 1993, IAU Circ., 5752
- (65) Wheeler, J. C., et al. 1993, ApJ, 417, L71
- (66) Woosley, S. E., Eastman, R. G., Weaver, T. A., & Pinto, P. A. 1994, ApJ, 429, 300
- (67)
| ANTENNAaa Ef= 100m, MPIfR, Effelsberg, Germany; Wb= equivalent diameter 94m, Westerbork, the Netherlands;Mc= 32m, IdR-CNR, Medicina, Italy; Nt= 32m, IdR-CNR, Noto, Italy; On= 20m, Onsala Space Observatory, Sweden; Go= 70m, NASA-JPL, Goldstone, CA, USA (Asterisk denotes use of the 34m antenna at the same station); Ro= 70m, NASA-JPL, Robledo, Spain (Asterisk denotes use of the 34m antenna at the same station); Aq= 46m, ISTS (now CRESTech/York Univ.), Algonquin Park, Ontario, Canada; Gb= 43m, NRAO, Green Bank, WV, USA; Y = equivalent diameter 130m, NRAO, near Socorro, NM, USA;Br= 25m, NRAO, Brewster, WA, USA; Fd= 25m, NRAO, Fort Davis, TX, USA; Hn= 25m, NRAO, Hancock, NH, USA; Kp= 25m, NRAO, Kitt Peak, AZ, USA; La= 25m, NRAO, Los Alamos, NM, USA; Mk= 25m, NRAO, Mauna Kea, HI, USA; Nl= 25m, NRAO, North Liberty, IA, USA; Ov= 25m, NRAO, Owens Valley, CA, USA; Pt= 25m, NRAO, Pie Town, NM, USA; Sc= 25m, NRAO, St. Croix, Virgin Islands, USA. | Total | On-Source | Recording | |||||||||||||||||||||||
|---|---|---|---|---|---|---|---|---|---|---|---|---|---|---|---|---|---|---|---|---|---|---|---|---|---|---|
| Date | Freq. | timebbMaximum span in hour angle at any one antenna. | timeccNumber of baseline-hours spent on SN1993J, after data calibration and editing. | ModeddRecording mode: III-B= Mk III mode B double speed;
128-4-2= VLBA format, 128 MHz recorded in 4 baseband channels with 2-bit sampling. 256-8-2= VLBA format, 256 MHz recorded in 8 baseband channels with 2-bit sampling. |
||||||||||||||||||||||
| (GHz) | Eb | Wb | Mc | Nt | On | Go | Ro | Aq | Gb | Y | Br | Fd | Hn | Kp | La | Mk | Nl | Ov | Pt | Sc | (hr) | (baseline-hr) | ||||
| 1993 | May | 17 | 8.4 | X | X | X | X | X | X | X | X | X | X | X | X | 9.6 | 41 | III-B | ||||||||
| 1993 | Jun | 27 | 8.4 | X | X | X | X | X | X | X | X | X | 13.0 | 41 | III-B | |||||||||||
| 1993 | Aug | 4eeData from this epoch were not used in this paper due to the poor convergence of the M81∗ model-fit | 8.4 | X | X | X | X | X | X | X | X | X | 16.6 | 15 | III-B | |||||||||||
| 1993 | Sep | 19 | 8.4 | X | X | X | X | X | X | X | X | X | X | X | X | X | X | 17.6 | 164 | III-B | ||||||
| 1993 | Nov | 6 | 8.4 | X | X | X | X | X | X | X | X | X | X | X | X | X | X | 18.0 | 202 | III-B | ||||||
| 1993 | Dec | 17 | 8.4 | X | X | X∗ | X | X | X | X | X | X | X | X | X | X | X | X | 18.0 | 133 | III-B | |||||
| 1994 | Jan | 28 | 8.4 | X | X∗ | X | X | X | X | X | X | X | X | X | X | 17.6 | 85 | III-B | ||||||||
| 1994 | Mar | 15 | 8.4 | X | X | X∗ | X | X | X | X | X | X | X | X | X | X | X | X | 18.4 | 273 | III-B | |||||
| 1994 | Apr | 22 | 8.4 | X | X | X∗ | X∗ | X | X | X | X | X | X | X | X | X | X | X | X | 16.9 | 159 | III-B | ||||
| 1994 | Jun | 22 | 8.4 | X | X | X∗ | X∗ | X | X | X | X | X | X | X | X | X | X | X | X | 16.1 | 216 | III-B | ||||
| 1994 | Aug | 30 | 8.4 | X | X | X∗ | X | X | X | X | X | X | X | X | X | X | X | 14.8 | 135 | III-B | ||||||
| 1994 | Oct | 31 | 8.4 | X | X | X | X | X | X | X | X | X | X | X | X | X | X | X | 15.1 | 134 | III-B | |||||
| 1994 | Dec | 23 | 8.4 | X | X | X | X | X | X | X | X | X | X | X | X | X | X | X | X | 16.1 | 233 | III-B | ||||
| 1995 | Feb | 12 | 8.4 | X | X | X | X | X | X | X | X | X | X | X | X | X | X | X | X | X | X | 11.8 | 641 | III-B | ||
| 1995 | May | 11 | 8.4 | X | X | X | X | X | X | X | X | X | X | X | 15.4 | 71 | 128-4-2 | |||||||||
| 1995 | Aug | 18 | 8.4 | X | X | X | X | X | X | X | X | X | X | X | 14.2 | 59 | 128-4-2 | |||||||||
| 1995 | Dec | 19 | 8.4 | X | X | X | X | X | X | X | X | X | X | X | X | 15.7 | 121 | 128-4-2 | ||||||||
| 1996 | Apr | 8 | 8.4 | X | X | X | X | X | X | X | X | X | X | X | X | 7.4 | 190 | III-B | ||||||||
| 1996 | Sep | 1 | 8.4 | X | X | X | X | X | X | X | X | X | X | X | X | 16.4 | 133 | 128-4-2 | ||||||||
| 1996 | Dec | 13 | 8.4 | X | X | X | X | X | X | X | X | X | X | X | X | 17.2 | 123 | 256-8-2 | ||||||||
| 1997 | Jun | 7 | 8.4 | X | X | X | X | X | X | X | X | X | X | X | X | X | 17.2 | 114 | 256-8-2 | |||||||
| 1997 | Nov | 15 | 8.4 | X | X | X | X | X | X | X | X | X | X | X | X | X | X | X | X | X | 13.8 | 266 | 256-8-2 | |||
| 1998 | Jun | 3 | 8.4 | X | X | X | X | X | X | X | X | X | X | X | X | X | 10.9 | 300 | 256-8-2 | |||||||
| 1998 | Dec | 7 | 8.4 | X | X | X | X | X | X | X | X | X | X | X | X | X | X | X | 12.2 | 304 | 256-8-2 | |||||
| 2000 | Feb | 25 | 8.4 | X | X | X | X | X | X | X | X | X | X | X | X | X | X | X | X | X | 9.4 | 418 | 256-8-2 | |||
| R.A. (J2000) | decl. (J2000) | |
| Position of M81∗ (ICRF)aaThis position was used in the correlator model and is tied to the International Celestial Reference Frame (ICRF) and essentially refers to the brightness peak of M81∗. | ||
| Position of M81bbThe position was computed by adding the average offset of M81 from the brightness peak, which was 0.3 mas to the southwest, to the position of M81∗. It was used as a reference position for the determinations of the coordinates of the geometric center of the supernova () for each epoch, . For more information, see text §§4.2 – 4.3. | ||
| Position of explosion centerccThe position () was determined as the intercept at age = 0 d of the fit center coordinates () as a function of time. The numbers in parentheses are the standard errors in the last two digits. | (85) | (45) |
| Proper motion of geometric center of radio shellddThe proper motion determined relative to M81. | as yr-1 | as yr-1 |
| Projected velocity of geometric center of radio shelleeThe projected velocity determined relative to M81(see text § 4.4). | km s-1 | km s-1 |
| Projected velocity of HI gas at SN positionffThe projected velocity computed from the radial velocity of the HI gas at the position of SN1993J by assuming circular motion in the plane of the galaxy. | km s-1 | km s-1 |
| Projected velocity of geometric center of SN in the co-rotating galactic reference frameggVector subtraction of the projected velocity of the HI gas at the position of SN1993J from the projected velocity of the geometric center of the radio shell. | km s-1 | km s-1 |
| Date | AgeaaTime since shock breakout on 28.0 March 1993. | Epoch, | bb: The coordinates of the geometric center of the fit model of the radio shell of SN1993J () minus the extrapolated coordinates of the center of explosion () for each epoch . The uncertainties are standard errors. For more information, see text §§ 3–4. | bb: The coordinates of the geometric center of the fit model of the radio shell of SN1993J () minus the extrapolated coordinates of the center of explosion () for each epoch . The uncertainties are standard errors. For more information, see text §§ 3–4. | ||
|---|---|---|---|---|---|---|
| (days) | (mas) | (mas) | ||||
| 1993 | May | 17 | 50 | 1 | ||
| 1993 | Jun | 27 | 91 | 2 | 0.002 | 0.010 |
| 1993 | Sep | 19 | 175 | 3 | 0.056 | 0.013 |
| 1993 | Nov | 6 | 223 | 4 | 0.042 | 0.070 |
| 1993 | Dec | 17 | 264 | 5 | 0.078 | |
| 1994 | Jan | 28 | 306 | 6 | 0.025 | |
| 1994 | Mar | 15 | 352 | 7 | 0.008 | 0.041 |
| 1994 | Apr | 22 | 390 | 8 | 0.092 | |
| 1994 | Jun | 22 | 451 | 9 | 0.013 | |
| 1994 | Aug | 30 | 520 | 10 | 0.031 | 0.023 |
| 1994 | Oct | 31 | 582 | 11 | 0.035 | |
| 1994 | Dec | 23 | 635 | 12 | 0.007 | 0.027 |
| 1995 | Feb | 12 | 686 | 13 | 0.007 | |
| 1995 | May | 11 | 774 | 14 | 0.007 | 0.035 |
| 1995 | Aug | 18 | 873 | 15 | 0.064 | |
| 1995 | Dec | 19 | 996 | 16 | 0.026 | |
| 1996 | Apr | 8 | 1107 | 17 | 0.031 | |
| 1996 | Sep | 1 | 1253 | 18 | 0.007 | 0.020 |
| 1996 | Dec | 13 | 1356 | 19 | 0.053 | |
| 1997 | Jun | 7 | 1532 | 20 | 0.017 | |
| 1997 | Nov | 15 | 1693 | 21 | 0.071 | |
| 1998 | Jun | 3 | 1893 | 22 | 0.070 | |
| 1998 | Dec | 7 | 2080 | 23 | 0.018 | 0.112 |
| 2000 | Feb | 25 | 2525 | 24 | 0.007 | |