56Ni Mixing in the Outer Layers of SN 1987A
Abstract
Supernova 1987A remains the most well-observed and well-studied supernova to date. Observations produced excellent broad-band photometric and spectroscopic coverage over a wide wavelength range at all epochs. Here, we focus on the very early spectroscopic observations. Only recently have numerical models been of sufficient detail to accurately explain the observed spectra. In SN 1987A, good agreement has been found between observed and synthetic spectra for day one, but by day four, the predicted Balmer lines become much weaker than the observed lines. We present the results of work based on a radiation-hydrodynamic model by Blinnikov and collaborators. Synthetic non-LTE spectra generated from this model by the general radiation transfer code PHOENIX strongly support the theory that significant mixing of 56Ni into the outer envelope is required to maintain strong Balmer lines. Preliminary results suggest a lower limit to the average nickel mass of solar masses is required above 5000 km s-1 by day four. PHOENIX models thus have the potential to be a sensitive probe for nickel mixing in the outer layers of a supernova.
1 Introduction
Until the explosion of Supernova 1987A in the LMC, computer models of supernovae were usually calculated with assumptions that allowed only the prediction of bolometric light curves. The matter temperature was usually assumed to be equal to the radiation temperature, and grey opacities were used (Arnett et al., 1989; Blinnikov, 1999). Often, the models did not account for the effects of radiation on the hydrodynamic gas flow, or the effects of sphericity on the spectrum (Schmutz et al., 1990).
Observations of SN 1987A produced extensive broad-band photometry, especially during its earliest phase of expansion. This motivated the development of models to predict its spectral and photometric evolution. In our analysis here we make use of the optical data obtained at CTIO (Phillips et al., 1988) and the extensive IUE data which was obtained, re-reduced and analyzed by Pun et al. (1995).
While SN 1987A led to the growth of observational data, so too did it lead to an improvement in theoretical models. Höflich (1991) modeled the early phase of SN 1987A, using a pure hydrogen atmosphere and accounting for non-LTE (Local Thermodynamic Equilibrium). Eastman & Kirshner (1989) modeled the first ten days of the SN 1987A explosion. H I and He I were modeled in NLTE, while metal lines were treated as pure scattering LTE lines. Takeda (1991) used a pure H/He envelope in NLTE and attempted to understand the lineshapes of the Balmer lines.
Our work here utilized a hydrodynamic model developed by Blinnikov and collaborators using the STELLA software package (Blinnikov et al., 1998; Blinnikov, 1999; Blinnikov et al., 2000). This model calculated the light curve for up to six months after the explosion, and includes allowance for time-dependent, multi-group radiation hydrodynamics, monochromatic scattering effects, and the effects of spectral lines on the opacity (Blinnikov et al., 2000). The hydrodynamical models were based on the stellar evolution models of Saio, Nomoto, & Kato (1988), Saio, Kato, & Nomoto (1988), and Nomoto & Hashimoto (1988). The procedure for synthesizing SN 1987A spectra from Blinnikov et al.’s model and the results are described in § 2. Here we concentrate on the fact that, by day 4.52, significant discrepancies begin to appear in the synthetic spectra of SN 1987A with respect to the observed spectra. In § 3 we review earlier works which noted this discrepancy. In § 4 we show that nickel mixing at early times seems to be the only way to make the synthetic spectra agree with observations. In a subsequent paper, we will discuss NLTE effects with regard to the results of Blinnikov et al. (2000).
2 Models
2.1 PHOENIX
PHOENIX is a general radiation transfer code that computes temperature, opacity, and level populations for each of typically 50–100 radial zones in a moving stellar envelope. PHOENIX allows the user to calculate level populations for a multitude of different nuclear species in LTE or NLTE (Hauschildt & Baron, 1999; Short et al., 1999). For this study, the following species were calculated in NLTE: H I, He I, He II, O I, Ne I, Na I, Mg II, Si II, S II, Ca II, Fe I, Fe II, and Fe III.
The Blinnikov et al. hydrodynamic model consists of an ejecta envelope divided into 300 zones, with compositions defined for each layer (Blinnikov, 1999; Blinnikov et al., 2000). The outer layers of this model were re-zoned onto the 75-zone grid that is used by a modified version of PHOENIX, preserving the compositions in velocity-space. The inner boundary condition was taken to be diffusive, which is well justified in these calculations. The gamma-ray energy deposition rate, which is the energy in gamma-rays deposited in the matter in the envelope per unit mass per unit time, is calculated for each new zone. The new grid was chosen so as to maintain both composition and density profiles with adequate resolution.
2.2 Spectral Synthesis
Figures 1–3 show the spectra resulting from PHOENIX computations on days 1.36, 2.67, and 3.59, respectively, of SN 1987A. The fits between the IUE spectra and the synthetic UV spectra are very good, an indicator of the importance of NLTE effects in the supernova envelope. [Blinnikov et al. (2000) noted that the predicted UV flux 5–10 days after shock breakout was much greater than the actual flux when computed in LTE.] For days 1.36 and 2.67, the agreement between the synthetic and observed optical spectra are also reasonably good. However, by day 3.59 a discrepancy in the strengths of the Balmer lines begins to appear in the synthetic spectra, most notably H, even when NLTE effects are included. Figure 4 shows the PHOENIX-generated optical/near-UV spectrum for day 4.52 compared with the observations (Phillips et al., 1988; Pun et al., 1995), and here the Balmer lines are clearly much weaker in the synthetic spectrum than they are in the observed spectrum.
3 Weak Lines
Schmutz et al. (1990), using various hydrodynamic models, noted the hydrogen atoms appeared to be sufficiently excited to create strong lines, despite the fact that the photospheric temperature had dropped below the ionization threshold (). They could offer no explanation for this discrepancy. The pure H/He non-LTE model of Takeda (1991) also resulted in weak Balmer lines, as did a model by Hauschildt & Ensman (1994), which used an earlier version of PHOENIX with H I, He I, Mg II, and Ca II in NLTE and metal line blanketing in LTE. These two groups suggested that differences between the theoretical and actual density distributions might be responsible.
Figure 5 shows temperature vs. velocity for Blinnikov et al.’s models at days 1.36 to 4.52. The diamonds on the graph show where is approximately equal to 1 in each model ( total continuum optical depth at 5000 Å). Assuming the line-forming region lies in the vicinity of , note that for days 1 and 2, the gas temperature is well above the ionization threshold for hydrogen, thus ensuring the presence of strong Balmer lines. (A good rule of thumb is that one sees the strongest lines from the species that is just below the dominant ionization stage. For example, Si II lines are strongest if Si III is the dominant stage, etc.) By day 3, the temperature is beginning to approach the threshold at , and at day 4 the temperature is such that sufficient ionization can no longer be assumed in the line-forming region.
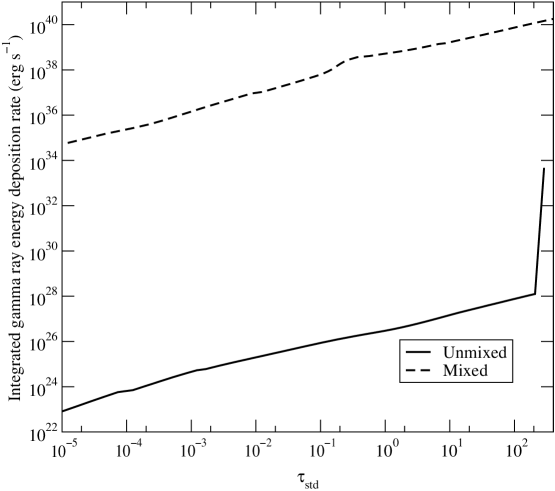
Figure 6 shows the gamma-ray energy deposition predicted by Blinnikov et al.’s hydrodynamic model. The total energy deposited per second is shown as a function of and the integral is performed from the outside proceeding inward. Until we reach the innermost layers of the envelope model (), the deposition is negligible, and therefore hydrogen atoms cannot become sufficiently excited through the absorption of gamma rays.
4 Nickel Mixing
4.1 Model Results
In order for the synthetic Balmer lines to match the strength of the observed lines, either higher matter temperatures (to thermally populate the Balmer states) or higher radiation temperatures (to radiatively populate the Balmer states in NLTE) would be required. Both of these would significantly degrade the quality of the fit, since they would both lead to model spectra that would be significantly bluer than the observed spectrum. A third way to strengthen the Balmer lines is to populate the states non-thermally, via fast electrons created from the deposition of gamma-rays produced by the radioactive decay of 56Ni. In our models this is controlled by the gamma-ray energy deposition rate. In order to obtain a larger energy deposition rate, more mixing of radioactive 56Ni into the supernova’s outer envelope than exists in Blinnikov et al.’s model (Blinnikov, 1999; Blinnikov et al., 2000) is required. In PHOENIX this can be accomplished by replacing the self-consistent energy deposition rate from the Blinnikov et al. model with an ad hoc function that simulates a gamma-ray population created by excess nickel mixing. To simulate mixing, we assume a uniform mass fraction of 56Ni distributed homogeneously (i.e., constant), and local deposition of gamma-rays. The new energy deposition rate is therefore much larger (and smoother) than the original (Figure 6), allowing for more hydrogen ionization and excitation in the line-forming region. Comparisons between the synthetic spectrum and the actual spectrum provide a sensitive probe for how much 56Ni must be mixed into the supernova envelope.
Figure 7 shows the results of modeling the day-4.52 spectrum with constant gamma-ray deposition, resulting from a nickel mass fraction of in the envelope. The fit between the predicted lines and the actual lines is much better, illustrating the validity of this model. A mass fraction of distributed thoughout our model atmosphere with a mass of about corresponds to a requirement of approximately of nickel to create enough gamma rays above the line forming region of the envelope. The mass is low (and corresponds to a lower boundary in velocity space of about 5000 km s-1), because at these early times the density is high and the continuum optical depth is already at this mass/velocity point, so that spectrum formation occurs in the very outer layers of the ejecta. At later times we see deeper due to geometrical dilution. Although the model produced by PHOENIX utilized a constant nickel mass fraction (so that the number density of nickel follows the rather steep density gradient), this by no means precludes the possibility of inhomogeneous mixing. In the case of that the nickel is in clumps, our nickel mass is a lower limit (since the clumps could self-absorb gamma rays) and our results indicate that at least some of the clumps must be optically thin to the gamma rays that are produced.
In preliminary lower resolution studies, we found that the synthetic H line in day 4.52 was slightly redshifted with respect to the actual H. This was also observed in synthetic spectra for days 3.71 and 5.76 created by the radiative transfer code SYNOW (Jeffery & Branch, 1990). This indicates that when the line strengths are correct, so is their velocity and demonstrates the diagnostic power of detailed spectral synthesis.
4.2 More Evidence for Nickel Mixing
The mechanism for the mixing of 56Ni into the envelope is the subject of intense debate, and won’t be settled until the core-collapse supernova mechanism is better understood. Kifonidis et al. (2000b) and Kifonidis et al. (2000a) suggested that nickel mixing into the hydrogen shell would be suppressed in Type II supernovae due to strong deceleration at the He/H boundary. Nevertheless, evidence exists to support the results of the PHOENIX models. Early detection of X-rays (Dotani et al., 1987) and gamma-rays (Matz et al., 1988), the expansion velocities in infrared line widths (Erickson et al., 1988; Witteborn et al., 1989) and in 56Co gamma-ray lines (Barthelmy et al., 1989), the detection of H velocities as low as 800 km s-1 at day 221 (Höflich, 1988), and the late detection of the He I 10830 line (Fassia & Meikle, 1999) all suggest that significant mixing has occurred in the ejecta [see Arnett et al. (1989), McCray (1993) and references therein].
Two-dimensional, axially symmetric models calculated by Fryxell et al. (1991) and by Herant & Benz (1991, 1992) suggested that 56Ni could be mixed into the envelope via finger-like structures that are produced shortly after the explosion by instabilities in the matter behind the shock front. By days, these fingers of nickel had broken up and expanded through radioactive heating into low-density bubbles of cobalt or iron, the decay products of 56Ni.
Inhomogeneous mixing has already been suggested as an explanation for the so-called “Bochum event,” an emission satellite on the red side of the H line in days 20–100. Utrobin et al. (1995) suggested that a high-velocity clump of 56Ni caused an asymmetric over-excitation of hydrogen in the outer envelope. Recent studies by Chandra have detected the presence of diffuse high-velocity Fe bubbles at the outer edge of the Cassiopeia A supernova remnant. Hughes et al. (2000) noted the detection of Fe bubbles at the outer edge of the supernova ejecta, outside the Si-rich layers, and suggested that their diffuse nature could be explained by radioactive heating from decaying nickel.
Models of the composition of SN 1987A in the nebular phase by Kozma & Fransson (1998a), based on the results of various explosion models, used a number fraction of iron of in the hydrogen layer, with a filling factor . This corresponds to a mass fraction on the order of . The results of the simulations of Kozma & Fransson (1998b) indicate that the iron mass fraction should be within a factor of 2 of the predicted value. Li et al. (1993) suggest that the light curve of SN 1987A during the nebular phase was dominated by of 56Co in the form of 50 to 100 clumps. Their models contained nickel clumps that were initially opaque to gamma rays with , accounting for of the total envelope mass. Gamma-ray absorption heated the clumps, causing them to expand until . The nickel mass fraction and total mass values predicted by the PHOENIX runs are well within the limits imposed by these two studies.
Detection of the He I 10830 line at times after 10 days suggests that helium is also being re-ionized by 56Ni decay. Fassia & Meikle (1999) applied spectral synthesis models to SN 1987A and noted that the best fit to the helium line required at least 3% of the total 56Ni mass (0.07 ) be mixed to above 3000 km s-1, but that 56Ni concentrations should be negligible above km s-1. Fassia et al. (1998) carried out a similar analysis of the Type II supernova 1995V, where they noted the best fit to the He line required the 56Ni density to be constant up to 650–1150 km s-1, then fall off by a power law of 8–9 (consistent with our mixing assumption). Only of 56Ni was required above the helium photosphere ( km s-1 at day 69) in the SN 1995V models. Burrows & Van Riper (1995), using Monte Carlo calculations of gamma-ray transport in clumpy debris models of SN 1987A’s envelope, suggest that up to 50% of the total 56Ni mass in SN 1987A should remain below 1000 km s-1.
Herant et al. (1994) suggest that significant iron/nickel inversion may be the result of neutrino-driven convection within the fraction of a second just prior to the supernova explosion. Convection would destroy the spherical symmetry of the elemental distribution, possibly creating the iron/nickel clumps predicted and/or detected in later stages. This theory is supported by 2D hydrodynamic simulations performed by Kifonidis et al. (2000a), although in their models the nickel was strongly decelerated at the He/H interface.
5 Further Research
Future work with the Blinnikov et al. 1987A model will involve using PHOENIX to synthesize the entire time series of the supernova up to around day 100. The detailed time series will indicate the location of nickel in the entire envelope, since the spectra probe deeper as time goes on due to the geometrical thinning of the envelope. PHOENIX spectra for this period may shed light on the later-time phenomena discussed in § 4. Once the whole time series of SN 1987A is modeled, the synthetic spectra will be applied to the Spectral-fitting Expanding Atmosphere Method (SEAM) in order to calculate the distance to SN 1987A, and hence to the LMC (Baron et al., 1993, 1994, 1995a, 1995b). Our calculations will also be useful to ascertain whether a 1-D representation of SN 1987A is sufficient. So far both breakout models (Blinnikov et al., 2000) and our preliminary calculations here indicate this to be the case.
References
- Arnett et al. (1989) Arnett, W. D., Bahcall, J., Kirshner, R. P., & Woosley, S. E. 1989, Ann. Rev. Astr. Ap., 27, 629
- Baron et al. (1994) Baron, E., Hauschildt, P. H., & Branch, D. 1994, ApJ, 426, 334
- Baron et al. (1995a) Baron, E., Hauschildt, P. H., Branch, D., Austin, S., Garnavich, P., Ann, H. B., Wagner, R. M., Filippenko, A. V., Matheson, T., & Liebert, J. 1995a, ApJ, 441, 170
- Baron et al. (1993) Baron, E., Hauschildt, P. H., Branch, D., Wagner, R. M., Austin, S. J., Filippenko, A. V., & Matheson, T. 1993, ApJ, 416, L21
- Baron et al. (1995b) Baron, E., Hauschildt, P. H., & Young, T. R. 1995b, Physics Reports, 256, 23
- Barthelmy et al. (1989) Barthelmy, S. et al. 1989, IAU Circ. No. 4764
- Blinnikov (1999) Blinnikov, S. 1999, Astronomy Letters, 25, 359
- Blinnikov et al. (1998) Blinnikov, S., Eastman, R., Barunov, O., Popolitov, V., & Woosley, S. 1998, ApJ, 496, 454
- Blinnikov et al. (2000) Blinnikov, S., Lundqvist, P., Bartunov, O., Nomoto, K., & Iwamoto, K. 2000, ApJ, 532, 1132
- Burrows & Van Riper (1995) Burrows, A. & Van Riper, K. A. 1995, ApJ, 455, 215
- Dotani et al. (1987) Dotani, T., Hayashida, K., Inoue, H., Itoh, M., Koyama, K., et al. 1987, Nature, 330, 230
- Eastman & Kirshner (1989) Eastman, R. & Kirshner, R. P. 1989, ApJ, 347, 771
- Erickson et al. (1988) Erickson, E. F. et al. 1988, ApJ, 330, L39
- Fassia & Meikle (1999) Fassia, A. & Meikle, W. P. S. 1999, MNRAS, 302, 314
- Fassia et al. (1998) Fassia, A., Meikle, W. P. S., Geballe, T., Walton, N., Pollaco, D., Rutten, R., & Tinney, C. 1998, MNRAS, 299, 150
- Fryxell et al. (1991) Fryxell, B., Müller, E., & Arnett, W. D. 1991, ApJ, 367, 619
- Hauschildt & Baron (1999) Hauschildt, P. H. & Baron, E. 1999, J. Comp. Applied Math., 109, 41
- Hauschildt & Ensman (1994) Hauschildt, P. H. & Ensman, L. 1994, ApJ, 424, 905
- Herant & Benz (1991) Herant, M. & Benz, W. 1991, ApJ, 370, L81
- Herant & Benz (1992) —. 1992, ApJ, 387, 294
- Herant et al. (1994) Herant, M., Benz, W., Hix, W. R., Fryer, C. L., & Colgate, S. A. 1994, ApJ, 435, 339
- Höflich (1988) Höflich, P. 1988, in IAU Colloquium 108: Atmospheric Diagnostics of Stellar Evolution, ed. K. Nomoto (Berlin: Springer), 288
- Höflich (1991) Höflich, P. 1991, in Proceedings of the ESO/EPIC Workshop on SN 1987A and other Supernovae, ed. I. J. Danziger & K. Kjär (Munich: ESO), 449
- Hughes et al. (2000) Hughes, J. P., Rakowski, C. E., Burrows, D. N., & Slane, P. O. 2000, ApJ, 528, L109
- Jeffery & Branch (1990) Jeffery, D. & Branch, D. 1990, in Supernovae, ed. J. C. Wheeler & T. Piran (Singapore: World Scientific), 149
- Kifonidis et al. (2000a) Kifonidis, K., Plewa, T., , & Müller, E. 2000a, Nuclear Phys., A, in press, astro-ph/0011206
- Kifonidis et al. (2000b) Kifonidis, K., Plewa, T., Janka, H.-T., & Müller, E. 2000b, ApJ, 531, L123
- Kozma & Fransson (1998a) Kozma, C. & Fransson, C. 1998a, ApJ, 496, 967
- Kozma & Fransson (1998b) —. 1998b, ApJ, 497, 431
- Li et al. (1993) Li, H., McCray, R., & Sunyaev, R. A. 1993, ApJ, 419, 824
- Matz et al. (1988) Matz, S. M., Share, G. H., Leising, M. D., Chupp, E. L., Vestrand, W. T., et al. 1988, Nature, 331, 416
- McCray (1993) McCray, R. 1993, Ann. Rev. Astr. Ap., 31, 175
- Nomoto & Hashimoto (1988) Nomoto, K. & Hashimoto, M. 1988, Phys. Repts., 163, 13
- Phillips et al. (1988) Phillips, M., Hamuy, M., Heathcote, S., Suntzeff, N., & Kirhakos, S. 1988, AJ, 95, 1087
- Pun et al. (1995) Pun, C. S. J. et al. 1995, ApJ Suppl., 99, 223
- Saio et al. (1988) Saio, H., Kato, M., & Nomoto, K. 1988, ApJ, 331, 388
- Saio et al. (1988) Saio, H., Nomoto, K., & Kato, M. 1988, Nature, 334, 508
- Schmutz et al. (1990) Schmutz, W., Abbott, D. C., Russell, R. S., Hamann, W.-R., & Wessolowski, U. 1990, ApJ, 355, 255
- Short et al. (1999) Short, C. I., Hauschildt, P. H., & Baron, E. 1999, ApJ, 525, 375
- Takeda (1991) Takeda, Y. 1991, A&A, 245, 182
- Utrobin et al. (1995) Utrobin, V. P., Chugai, N. N., & Andronova, A. A. 1995, A&A, 295, 129
- Witteborn et al. (1989) Witteborn, F. C., Bregman, J. D., Woode, D. H., Pinto, P. A., Rank, D. M., et al. 1989, ApJ, 338, L9