NICS–TNG low–resolution 0.85–2.45 m spectra of L-Dwarfs: a near-infrared spectral classification scheme for faint dwarfs
Abstract
We present complete near-infrared (0.85–2.45 m), low-resolution (100) spectra of a sample of 26 disk L-dwarfs with reliable optical spectral type classification. The observations have been obtained with NICS at the TNG using a prism-based optical element (the Amici device) that provides a complete spectrum of the source on the detector. Our observations show that low-resolution near-infrared spectroscopy can be used to determine the spectral classification of L-dwarfs in a fast but accurate way. We present a library of spectra that can be used as templates for spectral classification of faint dwarfs. We also discuss a set of near-infrared spectral indices well correlated with the optical spectral types that can be used to accurately classify L-dwarfs earlier than L6.
1 Introduction
The latest years have witnessed the discovery of numerous brown dwarfs close to the Sun, in nearby clusters and associations, and in binaries. The strategy of the optical and near-infrared imaging surveys (2MASS, Kirkpatrick et al. 1999; 2000; the Sloan Digital Sky Survey, Fan et al. 2000; and DENIS, Delfosse et al. 1997, Tinney et al. 1998) has been so successful that two new spectral classes (L and T) have been added to the previous types, to help to classify very cool stellar objects.
For L-dwarfs, in spite of the remaining uncertainties in model atmospheres for such cool objects (e.g. Leggett et al. 2001), it has been possible to derive a detailed spectral classification system in 9 subclasses from the systematic changes observed in selected spectral features (Kirkpatrick et al. 1999, Martín et al. 1999) . This spectral classification has been developed in the red part of the optical spectrum: the beginning of the L type is set by the weakening of the TiO and VO bands, while the appearence of the CH4 bands signals the transition to the T type. However, the optical spectral confirmation and classification of a candidate DENIS or 2MASS L-dwarf requires up to 1 hr of integration time with a low-resolution (1000) optical spectrograph at a large (10m-class) telescope, depending on the spectral type and magnitude of the candidate. This prevents the applicability of the optical classification to deeper surveys.
Given that L-dwarfs emit most of their radiation in the near-infrared bands from 1 to 2.5 m, the advantage of longer wavelengths is obvious. At present, near-infrared spectra are available for a handful of objects (14) and very recently Reid et al. (2001) attemped to establish a near-infrared classification scheme from full (0.9 to 2.5 m) UKIRT spectra with resolution 500-1000; each spectrum required integration times between 1 and 4 hours, depending on the spectral type of the star. With a 4-m class telescope the time demand is comparable (or higher) to that required for the optical classification, and thus prohibitive for large surveys. It is clear that intermediate- and high-resolution spectroscopy, while necessary for investigating photospheric properties of selected objects, is not suitable for candidate confirmation and classification of large, deep surveys.
In this paper we present low-resolution (100) near-infrared spectra of a sample of 26 L-dwarfs with reliable optical spectral classification from Kirkpatrick et al. (2000). The spectra have been obtained with a prism-based optical element (the Amici device), which provided a complete near-infrared spectrum of each star in less than 15 min on source at the italian Telescopio Nazionale Galileo (TNG), a 3.56-m telescope. We describe the observations in §2 and show in §3 that low-resolution near-infrared spectroscopy can be used to determine the spectral classification of L-dwarfs in a fast but accurate way. The potential of such an observing mode is discussed in §4, which concludes the paper.
2 Observations and results
The observational data were collected at the 3.56m TNG with the Near Infrared Camera and Spectrograph (NICS), a cryogenic focal reducer designed as a near-infrared common-user instrument for that telescope. The instrument is equipped with a Rockwell 10242 HAWAII near-infrared array detector. Among the many imaging and spectroscopic observing modes (Baffa et al. 2000), NICS offers a unique, high throughput, very low-resolution mode with an approximately constant resolving power of 50, when the 1″ wide slit is used. In this mode a prism-based optical element, the Amici device, is used to obtain on the detector a complete 0.85–2.45 m long slit spectrum of the astronomical source (Oliva 2001).
The 26 L-dwarfs in our sample cover in an approximately uniform way the optically defined spectral types ranging from L0 to L8. All the selected sources are brighter than K, with 3 exceptions with Ks=14.5–14.8. The sources were observed during the commissioning of NICS in several observing runs from December 2000 to February 2001. We used the 05 wide slit and the resulting spectra have an effective resolution of 100 across the entire spectral range. Integration times on source varied from 4 to 15 minutes depending on the source brightness. Wavelength calibration was performed using an Argon lamp and the deep telluric absorption features. The telluric absorption was then removed by dividing each of the object spectra by an A0 reference star spectrum observed at similar airmass, and normalized using a synthetic A0 star spectrum smoothed to the appropriate resolution. Four of the targets, which are also among the fainter in our sample, were observed in unfavorable weather conditions resulting in a poor compensation of the deep atmospheric features and noisier spectra. The accuracy of the spectral shapes was checked by computing the expected 2MASS colors from our spectra. When normalized at H band, our synthesized and the 2MASS fluxes at J and Ks differ by less than 2 in all but three cases, where one of the two bands is more discrepant.
The final spectra are shown in Figure 1. The objects are shown from top to bottom and from left to right in order of increasing optical spectral type from L0 to L8. The spectra have been normalized by the average flux in the 1.235–1.305 m region, a constant offset has been added to each one to avoid overlap. The spectra show the same general features described in Leggett et al. (2001) and Reid et al. (2001). In our low-resolution spectra the atomic lines of Na I and K I and the FeH lines in the J-band are not resolved, although their blended absorption features are clearly seen in the early type dwarfs. The spectra are dominated by the H2O features at 0.95, 1.15, 1.40, 1.85, and 2.4 m. TiO, near 0.85 m, and CO, longward of 2.3 m, are visible in some of the spectra, depending on spectral type and signal to noise.
3 The NIR classification scheme
Despite their low-resolution, the spectra of Figure 1 allow us to identify a set of spectral indices that can be used to define a near-infrared spectral classification scheme which is well correlated with the widely used optical classification scheme of Kirkpatrick et al. (1999) and Martín et al. (1999). A first attempt in this direction has already been taken by Reid et al. (2001). The main conclusion of their study is that while the J-band atomic lines are only weakly correlated with the optical spectral types, it is possible to define indices based on the H2O wings which are well correlated with the optical types (at least up to L6). For all the stars in our sample we computed the three indices that Reid et al. (2001) found to be the most correlated with the optical spectral type: K1 (see also Tokunaga & Kobayashi 1999), H2OA, and H2OB, all related to the strength or slope of the water absorption features. In the top panels of Fig. 2 we show the datapoints from our sample compared with the fits reported by Reid et al. (2001); our spectra are generally consistent with their fits. Note that, as in Reid et al. (2001), the K1 index can be used only for types earlier than L5; moreover our data indicate saturation at late spectral types also for H2OB, while H2OA shows a very large scatter. It is possible that this behaviour of the H2OA and H2OB indices may be caused by the lower resolution of our spectra.
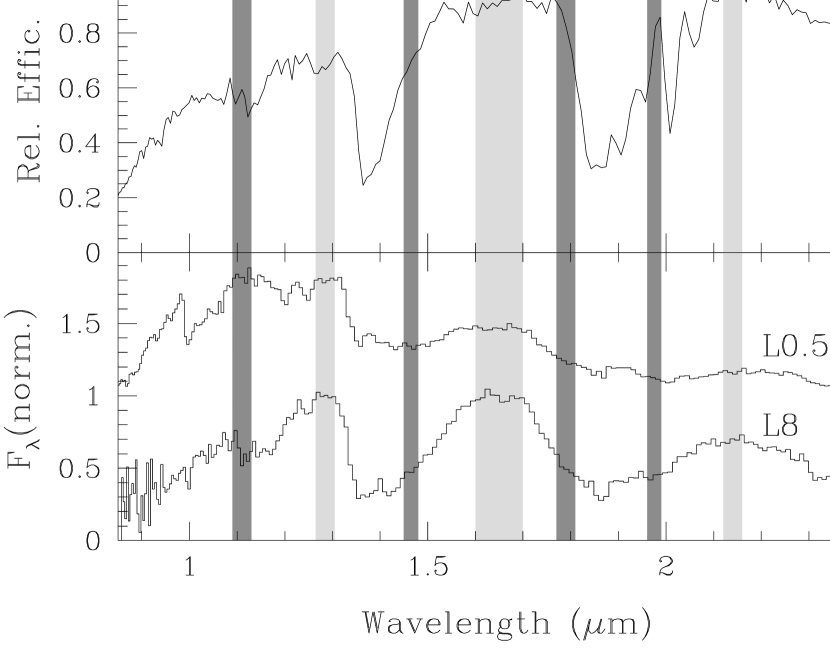
We also computed six additional indices which are best suited for low-resolution, complete spectra. The new indices are defined in Table 1 in a similar way as the Tokunaga & Kobayashi (1999) indices. Two of the new indices (sHJ and sKJ) are based on the slope of the continuum, and can be reliably defined using our spectra because the entire spectral range is observed simultaneously in the same atmospheric conditions, without the need of a problematic intercalibration of various spectral segments. All the other indices measure the slope of the water line wings. They have been defined so as to avoid as much as possible the spectral regions affected by the worse telluric absorption. To illustrate this point in Fig. 3 we show the relative system efficiency (including atmosphere), two of the spectra of Fig. 1, representative of the extreme classes (L0.5 and L8), and the spectral regions used to define the various indices shaded in grey. In Figure 2 the value of all the six indices are plotted against the optical spectral type of each star. The sH2OJ index is a measure of the strength of the water absorption feature at 1.1 m and, although it shows a very nice correlation with the optical spectral type in our data, it should be used with care as it may be seriously affected by a poor correction of the telluric absorption. With only few exceptions, all stars with good spectra show a tight correlation between the newly defined spectral indices and the optical spectral type. In Table 1 we also show the linear relation between the optical spectral types and the index values; the spectral types are coded as: L01.0, L81.8, with 0.1 step per subclass. We did not attempt to fit again the indices of Reid et al. (2001). For the spectral range L0 to L6 the linear fits offer a classification accurate to approximately half a subclass, at later spectral types most of the water indices saturate and the classification based on the fits is not as accurate and a direct comparison with the spectral library of Fig. 1 is preferable.
It is interesting to note that the good correlation of our “narrow-band” continuum indices (sJH and sJK) with the spectral type desappears when the broad-band colours are used (Kirkpatrick et al. 2000). This can be understood in terms of the competing effects of the reddening of the continuum at later spectral types and the increasing absorption from water features, the latter mostly affects the H and Ks broad bands.
4 Conclusions
We have presented a library of complete 0.85–2.45 m low-resolution (100) spectra of 26 disk L-dwarfs. This kind of spectral library, and the spectral indices we have defined, provide a unique tool for the identification and spectral classification of L-dwarfs from large, deep surveys, where the number and magnitudes of potential candidates make other techniques prohibitive, even at large telescopes. As an example, we estimate that the VLT next-generation, low-resolution near-infrared spectrograph (NIRMOS), will allow one to measure in 1 hr the m spectrum of faint (J) dwarfs, and classify them using one of our sHJ, sH2OJ or sH2OH1 indices.
Finally, we want to stress the advantage of using a device that produces the complete near-infrared spectrum in one shot, without the need for intercalibration of various spectral segments obtained in varying atmospheric conditions. This makes it possible to measure spectral indices that use the shape of the continuum, rather than the lines. These continuum indices (sHJ and sKJ) turn out to be very sensitive and reliable tools for the spectral classification of cool objects. Our results suggest that a rough, but very efficient spectral classification, could be obtained by narrow-band imaging through filters corresponding to the flux ranges used in the definitions of sHJ and sKJ in Table 1.
Acknowledgements: This paper is based on observations made with the Italian Telescopio Nazionale Galileo (TNG) operated on the island of La Palma by the Centro Galileo Galilei of the CNAA (Consorzio Nazionale per l’Astronomia e l’Astrofisica) at the Spanish Observatorio del Roque de los Muchachos of the Instituto de Astrofisica de Canarias Support from ASI grants ARS-99-15 and 1/R/27/00 to the Osservatorio di Arcetri is gratefully acknowledged. It is a pleasure to thank the Arcetri and TNG technical staff and the TNG operators for their assistance during the commissioning of NICS.
References
- Baffa et al. (2000) Baffa C., Gennari S., Lisi F., et al. 2000, in The Scientific Dedication of the Telescopio Nazionale Galileo, conference held in Santa Cruz de La Palma on November 3–5, 2000
- Basri et al. (2000) Basri, G., Mohanty, S., Allard, F., Hauschildt, P.H., Delfosse, X, Martín, E.L., Forveille, T. & Goldman, B. 2000, ApJ, 538, 363
- Delfosse et al. (1997) Delfosse, X., Tinney, C.G., Forveille, T. et al. 1997, A&A, 327, L25
- Fan et al. (2000) Fan, X. et al. 2000, AJ, 119, 928
- Kirkpatrick et al. (1999) Kirkpatrick J.D., Reid I.N., Liebert J., et al. 1999, ApJ, 519, 802
- Kirkpatrick et al. (2000) Kirkpatrick J.D., Reid I.N., Liebert J., et al. 2000, AJ, 120, 447
- Leggett et al. (2001) Leggett S.K., Allard F., Geballe T.R., Hauschildt P.H., Schweitzer A. 2001, ApJ, 548, 908
- Martìn et al. (1999) Martìn E.L., Delfosse X., Basri G., Goldman B., Forveille Th., Zapaterio Osorio M.R. 1999, AJ, 118, 2466
- Oliva (2001) Oliva E. 2001, Mem. Sc. Astr. It., in press (astro-ph/9909108)
- Reid et al. (2001) Reid I.N., Burgasser A.J., Cruz K.L., Kirkpatrick J.D., Gizis J.E. 2001, AJ, in press (astro-ph/0012275)
- Tinney et al. (1998) Tinney, C.G., Delfosse, X., Forveille, T. & Allard, F. 1998, A&A, 338, 1066
- Tokunaga & Kobayashi (1999) Tokunaga A. & Kobayashi N. 1999, AJ, 117, 1010
| Index | Definition | Fit to optical Sp. Type |
|---|---|---|
| sHJ | Sp=–1.87 sHJ+1.67 | |
| sKJ | Sp=–1.20 sKJ+2.01 | |
| sH2OJ | Sp=+1.54 sH2OJ+0.98 | |
| sH2OH1 | Sp=+1.27 sH2OH1+0.76 | |
| sH2OH2 | Sp=+2.11 sH2OH2+0.29 | |
| sH2OK | Sp=+2.36 sH2OK+0.60 |
Note. — is the average flux in the range to .