High-Resolution X-ray and Ultraviolet Spectroscopy of the Complex Intrinsic Absorption in NGC 4051 with Chandra and HST
Abstract
We present the results from simultaneous observations of the Narrow-Line Seyfert 1 galaxy NGC 4051 with the Chandra High Energy Transmission Grating Spectrometer and the HST Space Telescope Imaging Spectrograph. The X-ray grating spectrum reveals absorption and emission lines from hydrogen-like and helium-like ions of O, Ne, Mg and Si. We resolve two distinct X-ray absorption systems: a high-velocity blueshifted system at km s-1 and a low-velocity blueshifted system at km s-1. In the UV spectrum we detect strong absorption, mainly from C IV, N V and Si IV, that is resolved into as many as nine different intrinsic absorption systems with velocities between km s-1 and 30 km s-1. Although the low-velocity X-ray absorption is consistent in velocity with many of the UV absorption systems, the high-velocity X-ray absorption seems to have no UV counterpart. In addition to the absorption and emission lines, we also observe rapid X-ray variability and a state of low X-ray flux during the last ks of the observation. NGC 4051 has a soft X-ray excess which we fit in both the high and low X-ray flux states. The high-resolution X-ray spectrum directly reveals that the soft excess is not composed of narrow emission lines and that it has significant spectral curvature. A power-law model fails to fit it, while a blackbody produces a nearly acceptable fit. We compare the observed spectral variability with the results of previous studies of NGC 4051.
The Astrophysical Journal, 557:1–16, 2001 August 10, astro-ph/0104125
1 INTRODUCTION
NGC 4051 is a Narrow-Line Seyfert 1 (NLS1) galaxy with a rich observational history. Its optical emission-line spectrum was first noted by Hubble (1926), and it is one of the archetypical Seyfert galaxies (Seyfert 1943). It has been studied with every X-ray mission since Einstein, as well as with EUVE, HST and IUE, because it is bright [; based on optical emission lines (de Vaucouleurs et al. 1991)] and has relatively little Galactic absorption [ cm-2; Elvis, Lockman, & Wilkes 1989]. NGC 4051 is highly variable in X-rays and has even been seen virtually to shut off (decreasing in flux by a factor of from the average; e.g., Guainazzi et al. 1998; Uttley et al. 1999). Its typical 2–10 keV luminosity is (2–5) erg s-1 ( km s-1 Mpc-1; ). At lower energies the X-ray continuum is dominated by a variable soft excess (e.g., Turner & Pounds 1989; Guainazzi et al. 1996, hereafter G96).
NGC 4051 is also known to contain a ‘warm absorber’ (X-ray absorbing highly ionized gas) from ROSAT and ASCA observations (e.g., McHardy et al. 1995; G96; Komossa & Fink 1997; Reynolds 1997; George et al. 1998). Although edges from O VII and O VIII have been statistically detected in many recent analyses of NGC 4051, the addition of these features cannot entirely account for the observed spectral complexity (even when a blackbody model for the soft excess is also included in the fitting). For example, G96 identified a narrow spectral feature near 1 keV but were unable to determine if this feature was an absorption edge or emission line. George et al. (1998) suggested that the strong emission lines that are expected to arise in the warm absorber (e.g., Krolik & Kriss 1995; Netzer 1996) may comprise a significant fraction of the observed soft excess and contribute to the spectral complexity; however, all X-ray observations to date have lacked the spectral resolution needed to confirm or reject this hypothesis. G96 also argued for significant variability of the O VII edge while the O VIII edge remained roughly constant in strength, a somewhat surprising result if the O VIII absorption occurs closer to the central source on average than the O VII absorption (see Reynolds 1997). The best-fit ionization parameter of the warm absorber in NGC 4051 does not always track source intensity; such behavior could arise if the warm absorber is not in photoionization equilibrium or has a multi-zone nature (e.g., McHardy et al. 1995; Nicastro et al. 1999). Finally, we note that the possible presence of intrinsic UV absorption was briefly suggested by Voit, Shull, & Begelman (1987), but to date such absorption has not been studied in any detail.
In this paper, we present the results from our analyses of simultaneous Chandra High Energy Transmission Grating Spectrometer (HETGS) and HST Space Telescope Imaging Spectrograph (STIS) observations of NGC 4051. Through this study, we aim to constrain the dynamics (e.g., bulk velocity and velocity dispersion) and geometry (e.g., location and covering factor) of the X-ray and UV absorbers, and to determine whether these features might plausibly arise in the same gas (e.g., Mathur, Elvis, & Wilkes 1995). As our observation comprises the first X-ray grating spectroscopy of NGC 4051, we shall also use the high spectral resolution of the HETGS to place the best constraints to date on the spectral form and nature of the soft excess and to examine flux and spectral variability. In § 2 we describe the observations and data analysis, and in § 3 we interpret our results.
2 OBSERVATIONS AND DATA ANALYSIS
2.1 Chandra HETGS Observation
2.1.1 Observation Details and Basic Analysis
NGC 4051 was observed by Chandra (Weisskopf et al. 2000) on 2000 April 24–25 (starting at 06:08:25 UT) using the HETGS (C.R. Canizares et al. 2001, in preparation).111For additional information on the HETGS and ACIS, see the Chandra Proposers’ Observatory Guide at http://asc.harvard.edu/udocs/docs. This observation was part of the Chandra Cycle 1 guest observer program (observation identification number 00859). The detector was the Advanced CCD Imaging Spectrometer (ACIS; G.P. Garmire et al. 2001, in preparation).9 The observation was continuous with a total integration time of 81.5 ks. We used the Chandra Interactive Analysis of Observations (ciao) software Version 1.1.4 (M. Elvis et al. 2001, in preparation) to reduce the data.222See http://asc.harvard.edu/ciao.
The zeroth order X-ray spectrum shows substantial photon pileup. The nuclear position derived from the Chandra image is , , in agreement with the radio position from Ulvestad & Wilson (1984); our position is offset from theirs by to the North, while the absolute Chandra astrometry for our observation is expected to be good to within .333See http://asc.harvard.edu/mta/ASPECT. Comparing the point spread function (PSF) wings of the NGC 4051 image to the PSF of a point source (the HETGS observation of Capella), we find good agreement with no clear evidence for an extended circumnuclear X-ray component in NGC 4051. This is in contrast to the findings of Singh (1999) who claimed to detect extended circumnuclear emission in a ROSAT HRI observation; the extended emission was claimed to contain % of the total flux. Our observation has times better spatial resolution than the ROSAT HRI observation and is times longer (the ROSAT HRI instrument had a comparable effective area to the zeroth order of the HETGS). The extended emission reported by Singh (1999) may be a result of limitations in the ROSAT ‘de-wobbling’ procedure or the theoretical model of the ROSAT HRI PSF. We also comment on the presence of two weak off-nuclear ( and ) sources, located at , and , , coincident with the galactic disk of NGC 4051. These sources, which do not have any apparent discrete counterparts in Palomar Observatory Sky Survey (POSS) or HST images, have and counts, respectively, corresponding to rest-frame luminosities of and if they are at the distance of NGC 4051. They are plausibly X-ray binaries or luminous supernova remnants in NGC 4051, although they could also be unrelated background sources; the probability of obtaining one background source coincident with the optical disk of NGC 4051 is % at the observed flux levels.

The HETGS produces higher order spectra from two grating assemblies, the High Energy Grating (HEG) and Medium Energy Grating (MEG); each produces positive and negative orders. The two first-order MEG spectra agree well with each other and with the first-order HEG spectra. The averaged first-order MEG and HEG spectra have signal-to-noise ratios (S/Ns) of and (near 7 Å) for bin sizes of 0.005 Å and 0.0025 Å, respectively. The higher orders have only a small number of counts, and we therefore exclude them from our analysis. We have used ciao to produce Ancillary Response Files (ARFs) in order to flux calibrate the spectra, and we have corrected for the Galactic absorption and the cosmological redshift. The flux calibration is currently estimated to be accurate to %, 20% and 10% in the 0.5–0.8, 0.8–1.5 and 1.5–6 keV bands, respectively (H. L. Marshall 2000, private communication).444See http://space.mit.edu/ASC/calib/hetgcal.html. We have also corrected for the wavelength shift of 0.054% induced by the thermal contraction of ACIS-S pixels (H. L. Marshall 2000, private communication). We present the mean MEG first-order spectrum in Figure 1. This spectrum contains a total of 32087 counts between 1.8 Å and 25 Å (0.5–6.9 keV). The MEG velocity resolution is 1400 km s-1 at 5 Å and 350 km s-1 at 20 Å.
The general shape and flux of the X-ray spectrum are consistent with previous observations of NGC 4051. The average fluxes measured from the Chandra spectrum are () erg cm-2 s-1 in the 0.5–2 keV band and () erg cm-2 s-1 in the 2–7 keV band; the errors on these figures represent the flux calibration uncertainties mentioned above. We also observe short-timescale variability (see Figure 2.1.2) and a state of low flux during the last 15 ks of the observation. For this interval, the average Chandra fluxes are () erg cm-2 s-1 in the 0.5–2 keV band and () erg cm-2 s-1 in the 2–7 keV band; these fluxes, while quite low for NGC 4051, are still about four times higher than during the most extreme of the ultra-dim X-ray states mentioned in § 1. The largest amplitude of count-rate variability observed is a factor of , and the average count rate during the last 15 ks of the observation is times smaller than for the preceding data. We note that the low-flux state could not have lasted for more than days, as NGC 4051 was observed to be in a more typical flux state shortly after our observation (P. Uttley 2000, private communication).
2.1.2 Detected X-ray Spectral Features
The most interesting features revealed in the high-resolution X-ray spectrum of NGC 4051 are narrow absorption and emission lines, similar to those recently detected in other Seyfert 1s such as NGC 3783 (Kaspi et al. 2000) and NGC 5548 (Kaastra et al. 2000). Because only a small number of the individual
![[Uncaptioned image]](/html/astro-ph/0104125/assets/x2.png)
Chandra MEG light curve and hardness ratio for NGC 4051. The hardness ratio is defined to be the ratio of the 2–8 keV and 0.5–2 keV counts. The top panel has a bin size of 300 s, and the bottom panel has a bin size of 3000 s. Note the low count rate during the last ks; the spectrum clearly hardens during this time. The horizontal lines in the top panel show the times when STIS data were acquired.
absorption features are statistically significant at a high level of confidence, we have adopted the following procedure to measure relevant properties of the lines. We created ‘velocity spectra’ by adding, in velocity space, several absorption lines from the same ion. This method has the advantage of a significant increase in S/N and the disadvantage of somewhat deteriorated spectral resolution since, for each ion, the resolution is then defined by the line with the shortest wavelength. The velocity spectra were built up on a photon-by-photon basis from the raw data, rather than by interpolating spectra already binned in wavelength. In all cases, the two strongest predicted features for each ion were included (H. Netzer 2000, private communication), and in some cases other lines were added in order to improve the strength of the signal. We chose the lines to be relatively free from contamination by unrelated adjacent features based upon observations and modeling of other Seyfert galaxies with warm absorbers (mainly NGC 3783; Kaspi et al. 2001). In addition to combining the absorption lines from single ions, we also combined all the transitions from H-like ions into one spectrum and all the transitions from He-like ions into another. This step was phenomenologically motivated by the observed similarities between many of the spectra for the H-like and He-like ions. The velocity spectra created in this way are shown

in Figure 2. We measured the velocity shifts and widths of the observed absorption systems from Gaussian fits to the total H-like and He-like spectra. We detect two distinct absorption components with % confidence according to the -test (see Bevington & Robinson 1992): a high-velocity system at km s-1 ( in the H-like spectrum) and a low-velocity system at km s-1 ( in the He-like spectrum and in the H-like spectrum). The two absorption components have FWHMs of km s-1 and km s-1, respectively. These values are consistent with the resolution of the MEG at the wavelengths of some of the lines in each coadded spectrum.
Constraining the velocity shifts of the two components to have the values we measured from the H-like (high-velocity component) and He-like (low-velocity component) ions, we then performed -tests on the velocity spectra of the individual ions in order to check statistically for the presence of both absorption systems from each ion. This process consisted of fitting the continuum from to 5000 km s-1 with a linear model and noting the change in when narrow (unresolved) Gaussian absorption lines were added at fixed velocities corresponding to either high-velocity or low-velocity absorption. Because the only free parameter in the Gaussian model was the normalization, the values of correspond to one parameter of interest. The results of this procedure are shown in Table 1. According to the -test, we detect absorption at the % confidence level from the high-velocity system in Si XIV, Mg XII, and Ne X, and from the low-velocity system in O VII. Absorption is also suggested from the remaining H-like or He-like species of O, Ne, Mg and Si. Because deviations in the continuum from a linear model may introduce small inaccuracies into our -test results, we only consider features indicated at the % confidence level to be reliable detections.
TABLE 1
Values of for Co-added X-ray Line Profiles
Low Vel.
High Vel.
Ion
Si XIII
4.66
0.38
Si XIV
0.49
14.75
Mg XI
4.72
Mg XII
0.38
18.05
Ne IX
5.82
5.77
Ne X
3.44
21.19
O VII
37.72
0.49**footnotemark:
O VIII
6.79
3.44**footnotemark:
NOTE. —
Values of represent the difference in derived from
linear models and linear models with one Gaussian component to represent
absorption from the indicated velocity system, except for the values marked with
‘*’. In these cases, is the difference in derived from
linear models with one Gaussian component to represent low-velocity absorption
and linear models with Gaussian components to represent absorption at both
velocities. All fits have at least 40 degrees of freedom. For 40 degrees of
freedom, some values and their corresponding significance levels
are: / 95%; / 99%;
/ 99.9% (see Table C.5 of Bevington & Robinson 1992).
In Table 2 we list information about the individual absorption and emission lines. We have used the same procedure detailed in the preceding paragraph to search for individual absorption lines in the X-ray spectrum, again constraining the absorption components to be narrow and to occur at wavelengths corresponding to the velocities given above. Although this procedure was very effective at identifying strong features, we note that it cannot entirely account for the observed spectral complexity (see Figure 1 for clarification). In regions of the spectrum where there are not enough counts to permit fitting, we have manually searched for absorption features. Similarly, we have not performed statistical significance testing on any of the identified emission lines because many of these occur in regions of the spectrum with low S/N. We measured the velocity shifts and widths of the emission lines from simple Gaussian fits. Where allowed by the strength of the signal, we have calculated the errors on these values at the 90% confidence level (). In other cases, we have estimated the errors by visual inspection of the features. We note that the emission lines appear to be unresolved (see § 3.1 for further discussion) and are generally consistent with zero velocity within the NGC 4051 rest frame. We present the X-ray emission-line fluxes in Table 3. In general, the statistical significances of the emission lines and the low S/N absorption lines can be judged by the sizes of the errors on the equivalent widths (EWs). In order to measure the EWs of all the individual features, we have excised the line-dominated areas in the spectrum and fit the remainder with a cubic spline which serves as the continuum reference point in the centers of the lines. Errors on EWs represent the combination of a global 10% uncertainty in the continuum level and the statistical photon noise.
Some of the strong absorption lines occurring at the long-wavelength end of the MEG spectrum appear to be resolved (see Figure 2.1.2). Fitting a Gaussian profile to the coadded O VII velocity spectrum yields a best-fit FWHM for the low-velocity absorption system of km s-1 (errors are for ), whereas the instrumental resolution (FWHM) of the MEG at 17.768 Å (the line in the O VII velocity spectrum with the shortest wavelength and therefore the worst resolution) is 390 km s-1. Correcting for the instrumental broadening gives a true FWHM of km s-1 for the low-velocity X-ray absorption system. Although the high-velocity system appears to
TABLE 2
X-ray Absorption and Emission Lines From NGC 4051
Rest
Velocity
Measured
(System
EW
Ion
(Å)
or km s-1)
(mÅ)
Absorption Lines
S XVI
4.728
2.20
High
Si XIV
6.181
13.05
High
Si XIII
6.648
3.58
Low
Mg XIIaaBlended with one or more other components (see
Figure 5 for clarification). The components that are blended too
strongly to separate their EWs are the following:
component 5 (1548 Å) and component G
(1551 Å); component 6 (1548 Å) and component 1 (1551 Å); components 7
and 8 (1548 Å) and component 2 (1551 Å).
8.419
14.14
High
Ne XaaBlended with one or more other components (see
Figure 5 for clarification). The components that are blended too
strongly to separate their EWs are the following:
component 5 (1548 Å) and component G
(1551 Å); component 6 (1548 Å) and component 1 (1551 Å); components 7
and 8 (1548 Å) and component 2 (1551 Å).
10.239
2.90
High
Ne XaaBlended with one or more other components (see
Figure 5 for clarification). The components that are blended too
strongly to separate their EWs are the following:
component 5 (1548 Å) and component G
(1551 Å); component 6 (1548 Å) and component 1 (1551 Å); components 7
and 8 (1548 Å) and component 2 (1551 Å).
12.132
4.60
Low
Ne XaaBlended with one or more other components (see
Figure 5 for clarification). The components that are blended too
strongly to separate their EWs are the following:
component 5 (1548 Å) and component G
(1551 Å); component 6 (1548 Å) and component 1 (1551 Å); components 7
and 8 (1548 Å) and component 2 (1551 Å).
12.132
11.52
High
Fe XVIIaaBlended with one or more other components (see
Figure 5 for clarification). The components that are blended too
strongly to separate their EWs are the following:
component 5 (1548 Å) and component G
(1551 Å); component 6 (1548 Å) and component 1 (1551 Å); components 7
and 8 (1548 Å) and component 2 (1551 Å).
12.263
7.30
Low
Ne IX
13.447
4.70
Low
Ne IX
13.447
2.90
High
Fe XVIII
14.539
2.33
Low
O VIIIaaBlended with one or more other components (see
Figure 5 for clarification). The components that are blended too
strongly to separate their EWs are the following:
component 5 (1548 Å) and component G
(1551 Å); component 6 (1548 Å) and component 1 (1551 Å); components 7
and 8 (1548 Å) and component 2 (1551 Å).
16.006
3.48
Low
O VIIIaaBlended with one or more other components (see
Figure 5 for clarification). The components that are blended too
strongly to separate their EWs are the following:
component 5 (1548 Å) and component G
(1551 Å); component 6 (1548 Å) and component 1 (1551 Å); components 7
and 8 (1548 Å) and component 2 (1551 Å).
16.006
2.93
High
O VII
17.768
3.15
Low
O VII
18.628
6.28
Low
O VIII
18.967
Low
O VII
21.602
Low
Emission Lines
Fe I – XVIII
1.937
bbComponent 9 (1548 Å) is also strongly blended
with components 7 and 8 (1548 Å) and component 2 (1551 Å).
Si XIII
6.741
Ne X
12.132
Ne IX
13.553
Ne IX
13.699
O VIII
18.967
O VII
21.807
O VII
22.102
aPossibly blended with Fe absorption lines.
bThe velocity of Fe K is not well-constrained
due to the low S/N in that region of the spectrum (see Figure
7). The velocity reported here is the average velocity
measured in the MEG and HEG spectra.
The wavelength of this observed line corresponds to the expected iron
K line from Fe I to Fe XVIII.
TABLE 3
X-ray and UV Emission-Line Fluxes
Rest
Wavelength
Flux
Ion
(Å)
( erg cm-2 s-1)
X-ray Emission Lines
Fe I – XVIII
1.937
Si XIII
6.741
Ne X
12.132
Ne IX
13.553
Ne IX
13.699
O VIII
18.967
O VII
21.807
O VII
22.102
UV Emission Lines
H I
1215.7
137aaBlended with one or more other components (see
Figure 5 for clarification). The components that are blended too
strongly to separate their EWs are the following:
component 5 (1548 Å) and component G
(1551 Å); component 6 (1548 Å) and component 1 (1551 Å); components 7
and 8 (1548 Å) and component 2 (1551 Å).
N V
1238.8/1242.8
24aaBlended with one or more other components (see
Figure 5 for clarification). The components that are blended too
strongly to separate their EWs are the following:
component 5 (1548 Å) and component G
(1551 Å); component 6 (1548 Å) and component 1 (1551 Å); components 7
and 8 (1548 Å) and component 2 (1551 Å).
Si II
1304.4
C II
1334.5
Si IV
1393.8/1402.8
N III
1485.8
C IV
1548.2/1550.8
117aaBlended with one or more other components (see
Figure 5 for clarification). The components that are blended too
strongly to separate their EWs are the following:
component 5 (1548 Å) and component G
(1551 Å); component 6 (1548 Å) and component 1 (1551 Å); components 7
and 8 (1548 Å) and component 2 (1551 Å).
He II
1639.8
aFluxes for the heavily absorbed UV lines, Ly, N V,
and C IV, are highly uncertain as a result of the strong absorption.
be unresolved in all of the coadded line profiles, we can use the Ne X profile to place an upper limit on its measured FWHM of 1140–1860 km s-1, which corresponds to a true width of 910–1730 km s-1. We are unable to use the HEG spectrum to place tighter constraints on the lines’ widths due to its low S/N.
| Power law | Power law and | Power law and | |
|---|---|---|---|
| ( keV data only) | power law | blackbody | |
| Low State | 37.1 / 42 | 137.7 / 103 | 133.9 / 103 |
| High State | 523.7 / 585 | 2178.0 / 1942 | 2060.3 / 1942 |
| Average Spectrum | 593.3 / 623 | 2255.0 / 2019 | 2133.7 / 2019 |
2
![[Uncaptioned image]](/html/astro-ph/0104125/assets/x4.png)
O VII velocity spectrum from Figure 2 built up from the 17.768 Å, 18.628 Å and 21.602 Å lines. The top panel shows a simulated unresolved absorption line profile as it would appear in the MEG at a wavelength of 17.768 Å (the shortest wavelength O VII line and therefore the one with the worst MEG velocity resolution). The coadded spectrum is shown with two different bin sizes to allow easy comparison with the instrumental response.
We have checked the two strongest emission lines, O VII 22.102 Å and Ne IX 13.699 Å, for flux variability between the high and low states (see § 2.1.3) and find no clear evidence for it. The upper limit on the variability amplitude of the O VII line, which is stronger than the Ne IX line, is %.
2.1.3 Spectral Variability and Soft X-ray Excess
We have independently analyzed the grating spectra from the first ks of the observation (hereafter the ‘high state’) and the last ks (‘low state’) in order to study spectral variability (see Figure 2.1.2). We have binned the spectra to have a minimum of 15 counts per data point, in order to allow fitting. Since we have flux calibrated the spectra and corrected for Galactic absorption and redshift, we have used the ciao tool sherpa to fit spectral models directly to the data, without having to make further accounting for instrumental response. We simultaneously fit all four first-order HETGS spectra, constraining all shared spectral shape parameters to be the same, but allowing the absolute model normalizations to vary (to allow for absolute instrumental flux-calibration uncertainties). We note that the model normalizations were in general consistent to within 10%. In order to obtain the most reliable constraints on continuum spectral properties, we have excised all strong narrow features prior to fitting. In the high-state and average spectra, we have removed all the lines identified in Table 2 as well as the unidentified features marked in Figure 1. In the low state, we have removed only those parts of the spectrum containing strong emission lines.
We fit the keV continuum with a power law. The fits were statistically acceptable (see Table 4), and the best-fit photon indices with 90% confidence ranges () were for the high state and for the low state. The flattening of the hard power-law continuum in the low state is qualitatively consistent with the behavior seen in previous X-ray observations (see §3.2 for discussion). Upon extrapolating the power-law fits to lower energies, the soft excess becomes strongly apparent (see Figure 3). It appears to be continuous rather than composed of many narrow emission lines. Given the detection of this strong and continuous soft excess in high-resolution X-ray data, it seems unlikely that the extreme-ultraviolet to hard X-ray continuum of NGC 4051 is composed only of a single power law (see Uttley et al. 2000). Comparison of the two panels of Figure 3 shows that the soft excess is rapidly variable. In order to measure the amplitude of this variability, we have subtracted the power-law models shown in Figure 3 from the data and calculated the remaining 0.5–1.5 keV fluxes in both the high and low states. The ratio of the high-state to low-state soft excess fluxes we obtain is . The soft excess is proportionally stronger (relative to the underlying continuum) in the low state than in the high state; the fraction of the 0.5–1.5 keV flux due to the soft excess is % in the low state and % in the high state. We comment that our basic results on the soft excess are not sensitive to the correction for Galactic absorption; NGC 4051 has a small and precisely measured Galactic column density (see §1).
We first attempted to fit the soft excess with a power law. This model is rejected at % confidence for the high state and at 98.7% confidence for the low state (see Table 4). In the high state, this fit displays systematic residuals in the soft band, indicating that the soft excess has significant spectral curvature. Therefore we next attempted to fit it with a curved model, a blackbody. This provides a highly significant improvement to the fit in the high state (), while in the low state the fit improves only slightly (); the shape of the soft excess is poorly constrained in the low state due to its low S/N. The addition of a second blackbody component with a different temperature does not result in a statistically significant improvement in either state. Although the single blackbody model is still statistically rejected with high confidence, this is largely the result of unmodeled spectral complexity, much of which

may be from iron L-shell lines that are individually below the detection threshold but which have a significant cumulative effect (e.g., Kaspi et al. 2001). The spectral shape of the blackbody component is consistent to first order with the shape of the soft excess. The best-fit blackbody temperatures (with 90% confidence uncertainties) for the high and low states are keV and keV, respectively. Adding an intrinsic neutral absorption column does not improve the fit; the upper limit on the column density of such a component is cm-2. We note that the presence of any intrinsic, neutral absorption in NGC 4051 would only increase the strength of the required soft X-ray excess.
Adopting the blackbody as the best model for the soft-excess continuum, we then statistically tested for the presence of absorption edges in the high-state spectrum. We find evidence for an O VII absorption edge () with a velocity consistent with the range of velocities encompassed by the X-ray absorption lines and with , implying an O VII column density of cm-2. The precise energy of the edge ( keV) is not well constrained due to the loss of resolution necessary to reach statistics. Our test results also suggest the presence of an O VIII edge () with a similar and equally uncertain implied velocity (energy in the range 0.8714–0.8787 keV) and with , implying an O VIII column density of cm-2. In addition, there is statistical evidence for another absorption edge with an energy of keV and (; the energy, strength and significance depend on the presence or absence of other edges in the model). This feature may be caused by the previously mentioned iron L-shell absorption lines. We note that the presence of such absorption lines may also result in systematic uncertainties in the O VII and O VIII edge depths and hence the implied column densities.
2.2 HST STIS Observation
2.2.1 Observation Details and Basic Analysis

NGC 4051 was observed with STIS (Woodgate et al. 1998) on HST during the Chandra observation (see Figure 2.1.2). This observation was part of the HST Cycle 8 guest observer program (data sets O5F001010, O5F001020, O5F001030, and O5F001040). The STIS observation was made with the medium-resolution echelle (E140M mode), using an aperture size of . The total exposure time was 10.3 ks (4 orbits), and the wavelength coverage was 1173–1730 Å with a resolution of km s-1 and an absolute wavelength calibration good to within one resolution element. We have analyzed the standard STScI pipeline spectrum and compared it with the spectrum produced using the Interactive Data Language (idl) software of the Instrument Definition Team (IDT) for STIS (see, e.g., Crenshaw et al. 2000). We find good overall consistency between the two spectra, and we use the IDT spectrum in the analysis below. Figure 4 shows the UV spectrum of NGC 4051 from 1190–1720 Å.
We have searched for orbit-to-orbit variability of the UV continuum, absorption lines and emission lines. We detect none despite the simultaneous large-amplitude X-ray variability (see Figure 2.1.2; compare with Done et al. 1990). The continuum fluxes in broad wavelength bands are consistent to within %. This lack of detected variability justifies our use of the mean UV spectrum below.
2.2.2 Detected Ultraviolet Absorption Lines
The STIS spectrum of NGC 4051 reveals the presence of a number of intrinsic absorption systems with velocities ranging from km s-1 to 30 km s-1. The velocity widths (FWHM) of the components range from 23 km s-1 to 165 km s-1. We see up to nine major systems in C IV and N V, and we detect some of these in Si IV, Si III, Si II, and C II as well (see Table 5 and Figures 4, 5, and 2.2.3). We note, however, that our criteria for identifying distinct absorption systems are somewhat subjective. We classified two adjacent absorption systems as distinct if they appeared visually separate in at least one of the transitions shown in Figure 5. Unfortunately, we were unable to examine intrinsic Ly absorption from NGC 4051, since it displays a saturated absorption trough due to Galactic and intrinsic absorption (as well as perhaps intergalactic material) that extends from about km s-1 to 50 km s-1 (in the rest frame of NGC 4051; see Figure 2.2.3). This trough includes the entire range of observed intrinsic UV absorption velocities and is therefore consistent with our other results. We note that there are also two Ly absorption systems that are not saturated with velocities of km s-1 and km s-1. These systems do not seem to have counterparts in any of the high-ionization UV lines; they may represent low-ionization, high-velocity clouds in NGC 4051 (as in our Galaxy; e.g., Wakker & van Woerden 1997). We identify a Galactic absorption system candidate (having velocity approximately consistent with Galactic origin) in all ions but N V (labeled ‘G’ in Figures 5 and 2.2.3), and we note that this absorption could possibly be subdivided into two distinct systems. We also point out that system 1 could be Galactic in origin.
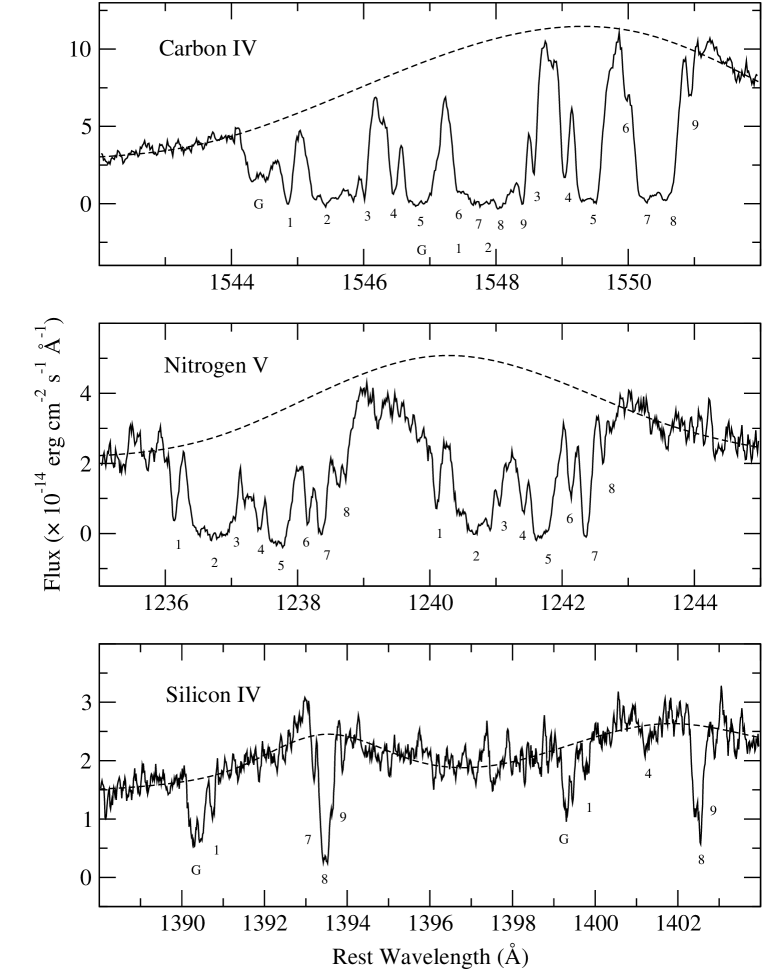
In Figure 5 and Table 5 we present the absorption systems from the higher ionization ions (C IV, N V, and Si IV). In order to measure the velocity shifts, FWHMs, and EWs of the systems (many of which are saturated), we have fit the continuum on either side of the absorption with a cubic spline. The relevant continuum fits are shown in Figure 5. Although this fitting technique may underestimate the continuum level if there is a significant narrow component to the emission, visual inspection of the less-strongly absorbed emission lines suggests that this is probably not a highly significant effect. Because the error on the spline-fit continuum level is difficult to quantify, we adopt a global uncertainty of 10% on these values, which is consistent with the range of possible continuum fits we considered. The errors on the equivalent widths represent a combination of this uncertainty in the continuum level and the actual photon noise. In general, where two or more absorption components appear to be strongly blended together, we report the sum of the EWs rather than attempting to separate them. The velocities and velocity FWHMs of the systems have been determined from simple Gaussian fits to the absorption. The velocity shifts reported in Table 5 represent the averages from N V, C IV, and Si IV; we take the root-mean-square deviations of these measurements (which are typically 10–15 km s-1) to be the best estimates of the uncertainties involved.
In Figure 2.2.3 we present the absorption systems from the lower-ionization ions (C II, Si III, and Si II). In these lines we identify an additional absorption system (labeled as ‘10’) which has a velocity of km s-1. For the lower-ionization ions, we tentatively identify counterparts to some of the absorption systems found using the higher-ionization ions (the statistical significances of these features are strongly dependent upon the adopted continuum level). The most notable counterparts are systems 1, 4, 7, 8, and 9, which are found in all ions, system 2 (found in Si II and Si III), and system 5 (found in C II and Si III). The low-velocity absorption systems (8–10) may originate within the host galaxy rather than the active nucleus. However, the high-velocity absorption systems (2–5) seen in the low-ionization ions are most likely related to the nucleus. Such high-velocity absorption systems in low-ionization ions have been observed in only one other Seyfert galaxy, NGC 4151 (Weymann et al. 1997).
2.2.3 Comparison with IUE and Ultraviolet Emission Lines
Peterson et al. (2000) present He II and C IV emission lines for NGC 4051 from a mean UV spectrum of 31 observations carried out by the International Ultraviolet Explorer (IUE)
![[Uncaptioned image]](/html/astro-ph/0104125/assets/x8.png)
Intrinsic UV absorption systems in NGC 4051 from the low-ionization ions C II, Si III, and Si II. The bin size is Å. Spectra have been smoothed with a boxcar filter that is five bins in width. The expected wavelengths of the absorption systems from Figure 5 and Table 5 are marked as vertical lines in each panel. Some detected absorption features are labeled as in Figure 5. Here we also identify an additional absorption system, labeled as ‘10’, which has a blueshifted velocity of km s-1.
![[Uncaptioned image]](/html/astro-ph/0104125/assets/x9.png)
Absorption near Ly in the spectrum of NGC 4051. The bin size is Å. The spectrum has been smoothed with a boxcar filter that is five bins in width. Note the wide absorption trough and the narrow geocoronal emission line near 1213 Å (the spectrum has been corrected for the cosmological redshift). The two absorption systems with redshifted velocities of km s-1 and km s-1 are marked with arrows. These systems may originate in low-ionization, high-velocity clouds within NGC 4051 (as in our Galaxy).
![[Uncaptioned image]](/html/astro-ph/0104125/assets/x10.png)
Mean IUE spectra of NGC 4051 (around the C IV emission line) for several epochs. The epochs are presented on the left, and the number of spectra averaged is on the right. Note the absorption Å blueward of the line peak, which is present in all epochs and is consistent with the absorption seen in the HST STIS spectrum. The small wavelength shifts between the spectra are probably due to wavelength calibration problems and the low resolution. These small wavelength shifts are one reason that the absorption is difficult to see in the mean spectrum presented by Peterson et al. (2000).
Short-Wavelength Prime camera (SWP; wavelength range 1150–2000 Å) over a period of 16 years. Though it is not clear from Peterson et al. (2000), a careful plotting of the C IV line reveals the likely existence of absorption in 90% of the spectra (see Figures 2.2.3 and 6; the lack of apparent absorption in the other spectra is probably due to their low S/N). Thus it appears that C IV absorption has existed in NGC 4051 since at least 1978.

The STIS spectrum of NGC 4051 is consistent with the mean IUE spectrum at wavelengths longer than 1225 Å. Around the Ly line the IUE spectrum is contaminated by geocoronal Ly emission, and no comparison is possible. The emission lines from both spectra agree well in their profiles. The blueward asymmetry of the He II and C IV broad emission described by Peterson et al. (2000) is also detectable in the STIS spectrum. This effect is also seen in other NLS1s (e.g., Leighly 2000). We list the UV emission-line fluxes in Table 3; in all cases the fluxes have been measured from unabsorbed line profiles fit to the data as described in § 2.2.2. Note that the fluxes given for Ly, N V, and C IV are quite uncertain due to their heavily absorbed profiles.
Although the strong absorption and blueward asymmetry make measurements of the widths of the UV emission lines difficult, we have attempted to measure the FWHMs of the C IV 1548.2 Å and 1550.8 Å lines from the STIS data. To do this, we started by assuming the centers of these lines are consistent with rest-frame emission in NGC 4051. We have attempted to deblend the features by fitting the cubic spline representing the continuum in this area with two Gaussians centered at the fixed wavelengths of the transitions; we required the relative strengths of the 1548.2 Å and 1550.7 Å lines to lie between 1:1 and 2:1. After obtaining the best fit, we blueshifted the lines by steps of 50 km s-1 and repeated the fitting. We find the best fit to be when the lines are blueshifted by km s-1 and the strengths of the lines are approximately equal. The FWHMs of the lines are km s-1. These FWHMs, although rather uncertain, are consistent with the value of km s-1 reported by Peterson et al. (2000) for the FWHM of the variable broad component of H.
3 DISCUSSION
3.1 X-ray and UV Absorption and Emission
The most significant results of this analysis are the discovery of X-ray emission lines and blueshifted X-ray absorption lines similar to those recently found from several other Seyfert 1s (e.g., Kaastra et al. 2000; Kaspi et al. 2000), as well as the identification of multiple intrinsic X-ray and UV absorption systems in the spectrum of NGC 4051. The velocities of the X-ray absorption components are measured to be km s-1 (the X-ray warm absorber with the highest velocity yet discovered) and km s-1, with an average velocity for the emission lines (excluding Fe K) of km s-1. The low-velocity X-ray absorption system, taking into account its measured width of km s-1, is consistent with the velocity
| N V | N V | Si IV | Si IV | C IV | C IV | |||
|---|---|---|---|---|---|---|---|---|
| Velocity | 1238.8 | 1242.8 | 1393.8 | 1402.8 | 1548.2 | 1550.8 | ||
| Sys. | Velocity | FWHM | EW | EW | EW | EW | EW | EW |
| No. | (km s-1) | (km s-1) | (mÅ) | (mÅ) | (mÅ) | (mÅ) | (mÅ) | (mÅ) |
| G | aaBlended with one or more other components (see Figure 5 for clarification). The components that are blended too strongly to separate their EWs are the following: component 5 (1548 Å) and component G (1551 Å); component 6 (1548 Å) and component 1 (1551 Å); components 7 and 8 (1548 Å) and component 2 (1551 Å). | |||||||
| 1 | aaBlended with one or more other components (see Figure 5 for clarification). The components that are blended too strongly to separate their EWs are the following: component 5 (1548 Å) and component G (1551 Å); component 6 (1548 Å) and component 1 (1551 Å); components 7 and 8 (1548 Å) and component 2 (1551 Å). | |||||||
| 2 | aaBlended with one or more other components (see Figure 5 for clarification). The components that are blended too strongly to separate their EWs are the following: component 5 (1548 Å) and component G (1551 Å); component 6 (1548 Å) and component 1 (1551 Å); components 7 and 8 (1548 Å) and component 2 (1551 Å). | |||||||
| 3 | ||||||||
| 4 | ||||||||
| 5 | aaBlended with one or more other components (see Figure 5 for clarification). The components that are blended too strongly to separate their EWs are the following: component 5 (1548 Å) and component G (1551 Å); component 6 (1548 Å) and component 1 (1551 Å); components 7 and 8 (1548 Å) and component 2 (1551 Å). | |||||||
| 6 | aaBlended with one or more other components (see Figure 5 for clarification). The components that are blended too strongly to separate their EWs are the following: component 5 (1548 Å) and component G (1551 Å); component 6 (1548 Å) and component 1 (1551 Å); components 7 and 8 (1548 Å) and component 2 (1551 Å). | |||||||
| 7 | aaBlended with one or more other components (see Figure 5 for clarification). The components that are blended too strongly to separate their EWs are the following: component 5 (1548 Å) and component G (1551 Å); component 6 (1548 Å) and component 1 (1551 Å); components 7 and 8 (1548 Å) and component 2 (1551 Å). | |||||||
| 8 | aaBlended with one or more other components (see Figure 5 for clarification). The components that are blended too strongly to separate their EWs are the following: component 5 (1548 Å) and component G (1551 Å); component 6 (1548 Å) and component 1 (1551 Å); components 7 and 8 (1548 Å) and component 2 (1551 Å). | |||||||
| 9 | bbComponent 9 (1548 Å) is also strongly blended with components 7 and 8 (1548 Å) and component 2 (1551 Å). |
Note. — The FWHM values represent the averages from the N V lines, except for systems G and 9 which are from C IV and Si IV. The uncertainties on the system velocities and FWHMs are roughly 10–15 km s-1. EW errors are reported at the 1 level.
2
range of the intrinsic UV absorption systems from km s-1 to km s-1 (systems 1–5). On the other hand, the high-velocity X-ray absorption system appears to have no kinematically consistent counterpart in the UV (see Figure 6a), and the UV absorption systems with the smallest blueshifts appear to have no strong counterparts in the X-rays. These observations are physically consistent, however, because the lowest-velocity UV absorption systems are seen preferentially in low-ionization species while the high-velocity X-ray absorption system is seen only in very high-ionization species. Another notable point is that the X-ray absorption may well be subdivided into more than the two systems we are able to resolve with the HETGS. For example, Figure 6 shows the gain in information between IUE resolution and STIS resolution; there may well be equal complexity awaiting discovery in X-rays. This warning should be remembered in efforts to perform detailed modeling of the X-ray absorption lines, particularly when using data from the XMM-Newton Reflection Grating Spectrometer (RGS) which has lower resolution than the Chandra HETGS.

In terms of ionization potential, the high-velocity X-ray absorption component is observed preferentially in the higher-ionization (H-like) ions, while the low-velocity component is stronger in the lower-ionization (He-like) ions (i.e., the ionization potentials to create the H-like ions in Figure 2 from their He-like counterparts are all higher than the ionization potentials to create the He-like ions in this figure from their Li-like counterparts), although its presence is also statistically suggested in some of the H-like ions. This ionization potential approach was phenomenologically motivated by the observed similarities between many of the velocity spectra for the H-like ions as a group and the He-like ions as a group. However, it is also relevant to compare the ionization parameters for which the relative populations of particular ions are maximized (assuming photoionization equilibrium). Kallman & McCray (1982) present curves showing the relative fractions of different ionization states of O, Ne and Si as functions of ionization parameter in the context of several different X-ray nebular models. Examination of these curves reveals that the population of He-like Si XIII is expected to peak at a larger ionization parameter than either of the H-like ions O VIII and Ne X, which seems to conflict with the ionization potential approach used to construct Figure 2. Detailed modeling will be required to ascertain if there is truly a conflict, but unfortunately such modeling will prove difficult if the absorbing gas in NGC 4051 is not in photoionization equilibrium (e.g., Krolik & Kriss (1995); McHardy et al. 1995; Nicastro et al. 1999). NGC 4051 typically shows large-amplitude variability of its average flux on timescales ranging from s to a couple days (see Figure 2.1.2 and McHardy, Papadakis, & Uttley 1998), so if the recombination timescale of the warm absorber lies in this range it is unlikely to be in photoionization equilibrium. All states of highly ionized oxygen, for example, recombine on a timescale given by s, where cm-3 and K (Shull & Van Steenberg 1982). Adopting a typical warm absorber temperature of K, we find that the warm absorber will fall out of photoionization equilibrium if its density lies between cm-3 and cm-3.555If the density is cm-3, corresponding to a value of much longer than the typical variability timescale, then the warm absorber might be in equilibrium with the average continuum flux; it would not respond to short-timescale continuum flux variations. This fairly wide range of densities is consistent with the constraints derived using He-like lines and with the upper end of the range of plausible densities for the Narrow Line Region (see below for the He-like line constraints and dynamical consistency between the Narrow Line Region lines and the X-ray warm absorber lines). Hence the warm absorber of NGC 4051 is plausibly not in photoionization equilibrium, and our phenomenological approach based on ionization potential seems appropriate for this analysis. The limited photon statistics prevent us from investigating the details of the ionization physics via timing analyses (e.g., Nicastro et al. 1999).
The strongest emission features seen in the X-ray spectrum of NGC 4051 are the O VII 22.1 Å and Ne IX 13.7 Å lines. Such features have been predicted to arise from the X-ray absorbing gas (e.g., Krolik & Kriss 1995; Netzer 1996) and have now been seen from other Seyfert 1s as well. The low Galactic column density to NGC 4051 allows for a full appreciation of the strengths of these lines, which are shown (along with Fe K) in Figure 7. The best-fit FWHMs of these lines are km s-1 and km s-1, respectively, which are consistent with being unresolved by the MEG. The upper limit on the width of the O VII line is significantly below the observed widths of the broad optical and ultraviolet lines. If a simple anticorrelation of line width and radial location in a virialized system is appropriate, this line must arise in a region farther from the central source than the Broad Line Region. It may arise in the Narrow Line Region, which for NGC 4051 has a characteristic [O III] FWHM of 210–330 km s-1 (e.g., Heckman et al. 1981; De Robertis & Osterbrock 1984). However, we note that the O VII line probably arises in a higher-ionization gas component than the [O III] line. An alternative explanation is that this high-ionization line may originate in the gas that produces the optical coronal lines (e.g., Porquet et al. 1999).
The Fe K line from NGC 4051 (see Figure 7 and Table 2) also deserves mention. The upper limit on the width of the Chandra line (FWHM) is km s-1, substantially below the width of the broad accretion-disk line observed by ASCA (e.g., G96). The line is also consistent with being unresolved by the HEG. The line’s width, along with its measured EW of eV ( mÅ) and energy of keV, are consistent with an origin in neutral material surrounding the nuclear region, such as the putative molecular torus of AGN unification schemes (e.g., Krolik, Madau, & Zycki 1994). We note that the EW of this relatively narrow feature is a significant fraction of the EW of the line seen by G96 ( eV). This point should be remembered in future attempts to model the broad Fe K line.
Since the UV absorption seen from NGC 4051 strongly absorbs the broad UV emission-line flux, it is clear that the gas in which this absorption arises must be coincident with or farther from the central engine than the UV Broad Line Region. Our estimate of the width of the C IV lines, which is consistent with the width of the H line, suggests that the physical sizes of the optical and UV Broad Line Regions are roughly comparable. This sets a rough lower limit of 3–6 light days (Peterson et al. 2000) on the distance from the central source to the UV-absorbing gas.
3.2 Column Density and Density Estimates
We have estimated ionic column densities using the X-ray absorption-line EWs and the ‘curve of growth’ technique described in § 3.4 of Spitzer (1978). In these analyses, we have treated the high-velocity and low-velocity X-ray absorption systems separately. Unfortunately, the column densities for the high-velocity system are quite uncertain because (1) the lines are not resolved so we can only constrain the velocity-spread parameter to be km s-1 and (2) we are near or on the ‘flat’ part of the curve of growth. Furthermore, if the X-ray absorption lines have unresolved substructure (see Figure 6) this may confuse curve of growth analyses. The two X-ray absorption lines in the high-velocity system with the best photon statistics are Mg XII 8.419 Å and Si XIV 6.181 Å. If we require km s-1, for example, the Mg XII column density formally allowed by our curve of growth analysis is between cm-2 and cm-2. We consider the upper end of this range to be implausibly large (e.g., the implied absorber becomes optically thick to electron scattering), but the lower end is plausible. For solar abundances and the likely ionization correction, the corresponding lower bound on is cm-2. Similarly, for Si XIV the column density formally allowed is between cm-2 and cm-2. Assuming solar abundances, the column densities of these two ions could plausibly arise in a zone characterized by a single ionization parameter, although this is not surprising given the large uncertainties. We note that the O VIII column density of cm-2 derived from the absorption edge depth is consistent with the plausible range of column densities in the high-velocity X-ray absorption line system.
The ionic column densities of the low-velocity system are easier to constrain because (1) the O VII lines are resolved and thus we can measure directly and (2) we are on the linear part of the curve of growth. The low-velocity lines most useful for this analysis are O VII 17.768 Å, 18.628 Å and 21.602 Å. The allowed O VII column density ranges for these lines are, respectively, (5–20) cm-2, (3–7) cm-2, and (8–20) cm-2. Although these ranges are not all consistent with a single value, they are not wildly different. With solar abundances and a plausible ionization correction, the implied is between cm-2 and cm-2. We point out, however, that the O VII column density of cm-2 indicated from the absorption-edge depth is larger than the upper limit derived from the curve of growth technique. The seeming inconsistencies among the implied column densities may result from either the effects of iron L-shell absorption lines near the O VII absorption edge or the existence of multiple unresolved absorption components within the low-velocity X-ray absorption system.
We note that the optical spectrum of NGC 4051 contains a small contribution from polarized light (e.g., Grupe et al. 1998). If there is a corresponding scattered X-ray continuum component (e.g., if the flux is due to Thompson scattering), non-zero flux levels may be observed in the troughs of absorption lines that are saturated along the primary line of sight. An effect of this type could confuse column density estimates made using the techniques detailed above. However, because the polarization fraction is small and because no noticeable effect of this type is observed for the saturated UV absorption lines (see § 2.2.1), this effect should hopefully be small for the X-ray lines as well.
The emission lines from the He-like ions we identified can serve as plasma density diagnostics (e.g., Porquet & Dubau 2000). For both O VII and Ne IX we identified, in emission, only the intercombination () and forbidden () lines and not the resonance () line. The forbidden-to-intercombination line ratios are , and for O VII and Ne IX, respectively (errors are estimated by the numerical method described in § 1.7.3 of Lyons 1991). As the resonance emission line is not identified, its flux is lower than the intercombination line flux, and the forbidden-to-resonance line ratio () has to be . Such high implies that the plasma emitting the lines is photoionization dominated (with little collisional ionization), and the upper limit on its temperature is K. The upper limit on the plasma density, using the ratios and Figure 8 of Porquet & Dubau (2000), is then cm-3.
The S/N of the X-ray spectrum of NGC 4051 is not favorable for detailed photoionization modeling such as Kaspi et al. (2001) have performed for NGC 3783. However, as Figure 3.2 shows, the correlation between the EWs of spectral features from NGC 4051 and from NGC 3783 is striking (although NGC 3783 has stronger X-ray absorption overall). This suggests that the basic physical nature of the absorbing gas is sim-
![[Uncaptioned image]](/html/astro-ph/0104125/assets/x13.png)
Comparison of the EWs of features detected in the Chandra spectra of both NGC 4051 and NGC 3783 (Kaspi et al. 2000). Dots represent absorption features, and triangles represent emission features. EWs of absorption lines from NGC 4051 that are detected in both the high-velocity and low-velocity systems represent the sums of the measured values for the two systems. A line with slope equal to unity is plotted to guide the eye. Although the features seen from NGC 4051 are generally weaker than those seen from NGC 3783, the noticeable correlation spanning a factor of in EW indicates a basic similarity in the warm absorbers of the two systems.
ilar in these two Seyferts and that the results of the detailed modeling of the absorber in NGC 3783 should be applicable, at least to first order, for NGC 4051 as well. This correlation is notable given (1) the different 0.5–10 keV ionizing continuum shapes of the two objects (while their average hard power-law slopes are similar, NGC 3783 lacks the strong soft X-ray excess seen from the NLS1 NGC 4051) and (2) the fact that NGC 4051 is times less luminous in X-rays than NGC 3783. However, it is also important to note that the UV absorption in NGC 4051 is much stronger than in NGC 3783 (while the opposite is true for the X-ray absorption). Crenshaw et al. (1999) report EWs of Å and Å for the N V 1238.8 Å and 1242.8 Å lines from NGC 3783, while the total values we measure for NGC 4051 are roughly seven and nine times larger, respectively. The combination of weaker X-ray absorption and stronger UV absorption seems to indicate that the absorbing gas in NGC 4051 is characterized by a smaller ionization parameter than the gas in NGC 3783. This may result from the different extreme-ultraviolet to soft X-ray continuum shapes of the two objects (since this is the ionizing continuum relevant for the UV lines) or from the difference in luminosity between the two objects; observations of additional Seyferts are required to search for connections of these types.
3.3 Variability and Soft X-ray Excess
The low state that NGC 4051 entered for the last ks of our Chandra observation is comparable to the lowest states in which it has been previously observed, although it is not the lowest. Guainazzi et al. (1998) reported a state in which the average 2–10 keV flux was erg cm -2 s-1, smaller by a factor of about four than that which we observe. The flux during our low state is comparable to that seen during the 1990 Broad-Band X-ray Telescope (BBXRT) low-state observation (Weaver 1993). Previous analyses have found that the 2–10 keV spectrum of NGC 4051 becomes increasingly hard with decreasing flux (e.g., Matsuoka et al. 1990; G96; Uttley et al. 1998). Our data show the expected qualitative behavior (see §2.1.3), and quantitatively our hard photon index of for the low state is consistent with the observed by BBXRT (as well as the observed by Guainazzi et al. 1998). However, both of these values lie somewhat below a linear extrapolation of the photon index versus X-ray flux correlation established for NGC 4051 at higher fluxes; either this correlation becomes nonlinear at low fluxes or we are witnessing the effects of its long-term secular evolution. The flat photon index is probably due to a large contribution from a reflection component that lags the primary continuum variations, but unfortunately our ks of low-state Chandra data lack the photon statistics to examine this matter in detail.
Our high-resolution data on the soft X-ray excess reveal that (1) it is continuous rather than composed of a forest of narrow emission lines, (2) it shows significant spectral curvature, and (3) it is rapidly variable. A simple blackbody model does not entirely fit the shape of this excess, and comparison with more detailed physical models is required. The continuous nature of the soft X-ray excess is as expected given its rapid variability (Elvis et al. 1991), and it parallels the recent result of Turner et al. (2001) regarding the NLS1 Ton S180.
4 conclusions
We have performed the first X-ray grating spectroscopy and the first detailed UV absorption study of the famous Narrow-Line Seyfert 1 galaxy NGC 4051. Our high-resolution X-ray and UV spectroscopic analyses reveal a number of significant results:
-
•
We detect a number of O, Ne, Mg and Si X-ray absorption lines belonging to two distinct absorption systems at blueshifted velocities of km s-1 and km s-1. The former, which has the highest velocity of any known X-ray warm absorber in a Seyfert, is observed preferentially in the higher-ionization (H-like) ions, while the latter is stronger in lower-ionization (He-like) ions (see § 2.1.2, § 3.1, Tables 1 and 2, and Figures 1 and 2).
-
•
The STIS spectrum reveals rich intrinsic UV absorption consisting of multiple () systems, some of which are consistent in velocity with the low-velocity X-ray absorption system (but not the high-velocity system) and some of which are detected in both high-ionization (C IV, N V and Si IV) and low-ionization (C II, Si III and Si II) ions. Our analysis of archival IUE data reveals that UV absorption has been present at some level for more than 20 yr (see § 2.2.2, § 2.2.3, § 3.1, Table 5, and Figures 4, 5, 2.2.3 and 2.2.3).
- •
- •
-
•
We estimate that the X-ray warm absorber has a column density of cm-2 in the high-velocity system and cm-2 in the low-velocity system (although we note that these values may be subject to systematic uncertainties). Plasma diagnostic techniques reveal that the gas is primarily photoionized (rather than collisionally ionized) and set upper limits of K and cm-3 on its temperature and density, respectively (see § 3.2).
- •
- •
References
- Bevington & Robinson (1992) Bevington, P. R., & Robinson, D. K. 1992, Data Reduction and Error Analysis for the Physical Sciences (2nd ed.; New York; McGraw Hill)
- Crenshaw et al. (1999) Crenshaw, D. M., Kraemer, S. B., Boggess, A., Maran, S. P., Mushotzky, R. F., & Wu, C.-C. 1999, ApJ, 516, 750
- Crenshaw et al. (2000) Crenshaw, D. M., Kraemer, S. B., Hutchings, J. B., Danks, A. C., Gull, T. R., Kaiser, M. E., Nelson, C. H., & Weistrop, D. 2000, ApJ, 545, L27
- De Robertis & Osterbrock (1984) De Robertis, M. M., & Osterbrock, D. E. 1984, ApJ, 286, 171
- de Vaucouleurs et al. (1991) de Vaucouleurs, G., de Vaucouleurs, A., Corwin, H. G., Buta, R. J., Paturel, G., & Fouque, P. 1991, Third Reference Catalogue of Bright Galaxies (New York; Springer-Verlag)
- Done et al. (1990) Done, C., Ward, M. J., Fabian, A. C., Kunieda, H., Tsuruta, S., Lawrence, A., Smith, M. G. & Wamsteker, W. 1990, MNRAS, 243, 713
- Elvis, Lockman & Wilkes (1989) Elvis, M., Lockman, F. J., & Wilkes, B. J. 1989, AJ, 97, 777
- Elvis et al. (1991) Elvis, M., Wilkes, B. J., Giommi, P., & McDowell, J. 1991, ApJ, 378, 537
- George et al. (1998) George, I. M., Turner, T. J., Netzer, H. N., Nandra, K., Mushotzky, R. F., & Yaqoob, T. 1998, ApJS, 114, 73
- Grupe et al. (1998) Grupe, D., Wills, B. J., Wills, D., & Beuermann, K. 1998, A&A, 333, 827
- Guainazzi et al. (1996) Guainazzi, M., Mihara, T., Otani, C., & Matsuoka, M. 1996, PASJ, 48, 781 (G96)
- Guainazzi et al. (1998) Guainazzi, M., et al. 1998, MNRAS, 301, L1
- Heckman et al. (1981) Heckman, T. M., Miley, G. K., van Breugel, W. J. M., & Butcher, H. R. 1981, ApJ, 247, 403
- Hubble (1926) Hubble, E. P. 1926, ApJ, 64, 321
- Kaastra et al. (2000) Kaastra, J. S., Mewe, R., Liedahl, D. A., Komossa, S., & Brinkman, A. C. 2000, A&A, 354, L83
- Kallman & McCray (1982) Kallman, T. R., & McCray, R. 1982, ApJS, 50, 263
- Kaspi et al. (2000) Kaspi, S., Brandt, W. N., Netzer, H., Sambruna, R., Chartas, G., Garmire, G. P., & Nousek, J. A. 2000, ApJ, 535, L17
- Kaspi et al. (2001) Kaspi, S., et al. 2001, ApJ, 554, in press (astro-ph/0101540)
- Komossa & Fink (1997) Komossa, S., & Fink, H. H. 1997, A&A, 322, 719
- Krolik & Kriss (1995) Krolik, J. H., & Kriss, G. A. 1995, ApJ, 447, 512
- Krolik, Madau, & Zycki (1994) Krolik, J. H., Madau, P., & Zycki, P. T. 1994, ApJ, 420, L57
- Leighly (2000) Leighly, K. M. 2000, New Ast. Rev., 44, 395
- Lyons (1991) Lyons, L. 1991, A Practical Guide to Data Analysis for Physical Science Students (Cambridge; Cambridge University)
- Mathur, Elvis, & Wilkes (1995) Mathur, S., Elvis, M., & Wilkes, B. 1995, ApJ, 452, 230
- Matsuoka et al. (1990) Matsuoka, M., Piro, L., Yamauchi, M., & Murakami, T. 1990, ApJ, 361, 440
- McHardy et al. (1995) McHardy, I. M., Green, A. R., Done, C., Puchnarewicz, E. M., Mason, K. O., Branduardi-Raymont, G., & Jones, M. H. 1995, MNRAS, 273, 549
- McHardy et al. (1998) McHardy, I. M., Papadakis, I. E., & Uttley, P. 1998, Nuclear Physics B, 69, 509
- Morton, York & Jenkins (1988) Morton, D. C., York, D. G., & Jenkins, E. B. 1988, ApJS, 68, 449
- Netzer (1996) Netzer, H. 1996, ApJ, 473, 781
- Nicastro et al. (1999) Nicastro, F., Fiore, F., Perola, G. C., & Elvis, M. 1999, ApJ, 512, 184
- Peterson et al. (2000) Peterson, B. M., et al. 2000, ApJ, 542, 161
- Porquet & Dubau (2000) Porquet, D., & Dubau, J. 2000, A&AS, 143, 495
- Porquet et al. (1999) Porquet, D., Dumont, A.-M., Collin, S., & Mouchet, M. 1999, A&A, 341, 58
- Reynolds (1997) Reynolds, C. S. 1997, MNRAS, 286, 513
- Seyfert (1943) Seyfert, C. K. 1943, ApJ, 97, 28
- Shull & Van Steenberg (1982) Shull, J. M., & Van Steenberg, M. 1982, ApJS, 48, 95 (erratum 49, 351 [1982])
- Singh (1999) Singh, K. P. 1999, MNRAS, 309, 991
- Spitzer (1978) Spitzer, L. 1978, Physical Processes in the Interstellar Medium (New York; John Wiley & Sons)
- Turner et al. (2001) Turner, T. J., et al. 2001, ApJ, 548, L13
- Turner & Pounds (1989) Turner, T. J., & Pounds, K. A. 1989, MNRAS, 240, 833
- Ulvestad & Wilson (1984) Ulvestad, J. S., & Wilson, A. S. 1984, ApJ, 285, 439
- Uttley et al. (1998) Uttley, P., McHardy, I. M., Papadakis, I. E., Cagnoni, I., & Fruscione, A. 1998, Nuclear Physics B, 69, 490
- Uttley et al. (1999) Uttley, P., McHardy, I. M., Papadakis, I. E., Guainazzi, M., & Fruscione, A. 1999, MNRAS, 307, L6
- Uttley et al. (2000) Uttley, P., McHardy, I. M., Papadakis, I. E., Cagnoni, I., & Fruscione, A. 2000, MNRAS, 312, 880
- Voit, Shull & Begelman (1989) Voit, G. M., Shull, J. M., & Begelman, M. C. 1987, ApJ, 316, 573
- Wakker & van Woerden (1997) Wakker, B. P., & van Woerden, H. 1997, ARA&A, 35, 217
- Weaver (1993) Weaver, K. A. 1993, PhD thesis, The University of Maryland
- Weisskopf et al. (2000) Weisskopf, M.C., Tananbaum, H.D., Van Speybroeck, L.P., & O’Dell, S.L. 2000, Proc. SPIE, 4012, 2
- Weymann, Morris, Gray, & Hutchings (1997) Weymann, R. J., Morris, S. L., Gray, M. E., & Hutchings, J. B. 1997, ApJ, 483, 717
- Woodgate et al. (1998) Woodgate, B. E., et al. 1998, PASP, 110, 1183