Host Galaxies of Gamma-ray Bursts:
Spectral Energy Distributions and
Internal Extinction.
We present broad-band flux spectra for the host galaxies of GRB 970508, GRB 980613, GRB 980703, GRB 990123 and GRB 991208 obtained with the 6-m telescope of SAO RAS. The comparison of the broad-band flux spectra of these host galaxies with the template spectral energy distributions (SEDs) of local starburst galaxies of different morphological types shows that the of the hosts are best fitted by the spectral properties of template SEDs of starburst galaxies and that there is a significant internal extinction in these host galaxies. We derived the absolute magnitudes of the GRB host galaxies making use of SEDs for the starburst galaxies. To create theoretical templates we performed the population synthesis modeling of the continuum spectral energy distribution of the host galaxies of GRB 970508 and GRB 980703 using different extinction laws (Cardelli et al. Card (1989) and Calzetti et al. Calz2000 (2000)) and assuming burst and exponential scenarios of star formation. The comparison of broad-band flux spectra with the local starburst galaxies templates and theoretical templates as well as direct estimates (using Balmer emission lines) of the internal extinction shows that it is likely to be of great importance to take into account effects of the internal extinction in the host galaxies. From the energy distribution in the spectrum of the host galaxy of GRB 991208 and from the intensity of their spectral lines (with allowance for the effects of internal extinction) it follows that this is a GRB galaxy with the highest massive star-formation rate of all known GRB galaxies – up to hundreds of solar masses per year. The reduced luminosity of these dusty galaxies (e.g. for the host of GRB 970508 mag, for the host of GRB 980703 mag and for the host of GRB 991208 mag) could explain the observational fact (it results independently from our photometry and from calculated spectral distribution for the subset of galaxies having been observed with the 6-m telescope): none of the observed GRB host galaxies with known distances is brighter than the local galaxies with the luminosity (where is the “knee” of the local luminosity function).
Key Words.:
galaxies: starburst – galaxies: photometry – cosmology: observations – gamma rays: bursts – ISM: dust, extintion1 Introduction
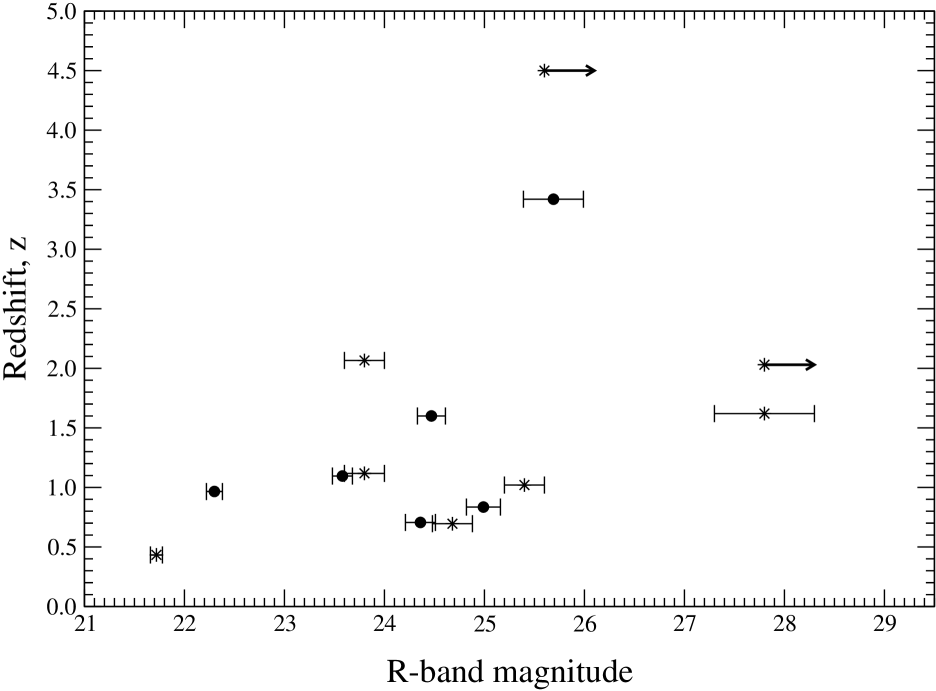
Currently, more than 20 optical afterglows of long-duration gamma-ray bursts (GRBs) have been detected (J. Greiner, http://www.aip.de/∼jcg/grbgen.html), almost all within a fraction of an arcsecond of very faint galaxies (Bloom et al. 2000a ), with R-band magnitudes from 22 to 28 or more. For example, in the case of GRB 000301C the host is fainter than 28.5 mag (Fruchter et al. Fruchter2000 (2000)) and we have no certain detection of a host galaxy. About 14 redshifts have been measured in the range from to (Castro-Tirado 2001a ). In Table 1 we present a summary of observational data related to the GRB host galaxies. The magnitudes of the hosts were corrected for the Galactic extinction. Table 2 shows the values of the reddening toward the hosts for the bands for which we had measurements. In Fig. 1 the -band vs. redshift diagram for the 14 GRB host galaxies are presented.
| Host | Date UT | Band | Dereddened | spectrum |
|---|---|---|---|---|
| magnitude | ||||
| GRB 970228 | 01.35 Sep. 1998 | (VLT-UT1) | emission host (z=0.69500.0003) | |
| 04.71 Sep. 1997 | (HST/STIS) | (Bloom et al. 2000) | ||
| 04.71 Sep. | (HST/STIS) | |||
| 04.71 Sep. | (HST/STIS) | |||
| GRB 971214 | 24.85 Jul. 1998 | (BTA) | emission host+OT (z=3.4180.010) | |
| 24.84 Jul. | (BTA) | (Kulkarni et al. Kulkarni (1998)) | ||
| GRB 970508 | 21.74 Aug. 1998 | (BTA) | emission host+OT (z=0.83490.0003) | |
| 23.95 Jul. 1998 | (BTA) | emission host | ||
| 21.74 Aug. | (BTA) | (Metzger et al. Metzger1997 (1997), | ||
| 23.95 Jul. | (BTA) | Bloom et al. 1998b ) | ||
| GRB 980613 | 24.80 Jul. 1998 | (BTA) | emission host+OT (z=1.09640.0003) | |
| 24.82 Jul. | (BTA) | (Djorgovski et al. GCN #189) | ||
| 23.00 Jul. | (BTA) | |||
| GRB 980703 | 24.05 Jul. 1998 | (BTA) | emission host+OT (z=0.96620.0002) | |
| 24.06 Jul. | (BTA) | emission host | ||
| 24.06 Jul. | (BTA) | (Djorgovski et al. Djorgovski (1998)) | ||
| 24.07 Jul. | (BTA) | |||
| GRB 990123 | 8.85 Jul. 1999 | (BTA) | absorption host+OT (z=1.6) | |
| 8.86 Jul. | (BTA) | (Kelson et al. Kelson (1999); | ||
| 8.84 Jul. | (BTA) | Hjorth et al. Hjorth1999 (1999)) | ||
| 8.87 Jul. | (BTA) | |||
| GRB 990510 | 29 Apr. 2000 | (HST/STIS) | absorbtion host+OT (z=1.61870.0015) | |
| (Vreeswijk et al. 2000b ) | ||||
| GRB 990712 | 29 Aug. 1999 | (HST/STIS) | emission host+OT (z=0.43370.0004) | |
| 29 Aug. 1999 | (HST/STIS) | (Hjorth et al. Hjorth2000 (2000); Vreesvijk et al 2000) | ||
| GRB 991208 | 31.90 March 2000 | (BTA) | emission host+OT | |
| 31.84 March | (BTA) | (z=0.70630.0017) | ||
| 31.96 March | (BTA) | (Dodonov et al. Dodonov (1999), GCN #475) | ||
| 31.87 March | (BTA) | |||
| 04.21 April | (NOT) | |||
| GRB 991216 | 17.6 Apr. 2000 | (HST/STIS) | absorption host+OT (z=1.02) | |
| (Vreeswijk et al. Vreeswijk1999 (1999), GCN #496) | ||||
| GRB 000131 | 5.03 March 2000 | (VLT) | absorption host+OT (z=4.5000.015) | |
| 5.02 March | (VLT) | (Andersen et al. Andersen (2000)) | ||
| GRB 000301C | 19 April 2000 | (HST/STIS) | absorpsion host+OT (z=2.03350.0003) | |
| 19 April | (HST/STIS) | (Smette et al. 2000, GCN #603; | ||
| S. M. Castro et al. 2000, GCN #605) | ||||
| GRB 000418 | 4.17 June 2000 | (HST/STIS) | emission host+OT (z=1.118540.0007) | |
| (Bloom et al. 2000c , GCN #661) | ||||
| GRB 000926 | 27 October 2000 | (NOT/ALFOSC) | absorption host+OT (z=2.066) | |
| (Fynbo et al. 2000a , GCN #807) |
There is a growing suspicion that GRBs are produced during the collapse of massive stars (see Paczynśki Pac1999 (1999) and MacFadyen & Woosley MacFadyen (1999) and references therein). The hosts of long-duration GRBs are quite blue (Fruchter et al. Fruchter2001 (2001)), as one would expect if GRBs were related to star formation, and the positions of the long-duration GRBs on their hosts are far more correlated with the light of the galaxy (Bloom et al. 2000a ) than one would naively expect if GRBs were formed by the merger of neutron-star binaries, another previously favored formation scenario (Lattimer & Schramm Lattimer (1974); Paczynski 1986). Additionally, recent spectroscopic observations of GRB X-ray afterglows have revealed Fe lines in both absorption and emission (Piro et al. Piro (2000)) suggesting that the GRBs may even have occured inside a recently formed supernova remnant.
It is now obvious that the study of host galaxies and their properties helps in our understanding of the nature of the progenitor systems. If GRBs are associated with an active star formation, then we might expect the light of their host galaxies to be affected by internal extinction. Indeed, the Balmer line ratios in the spectra of the host of GRB 980703 (Djorgovski et al. Djorgovski (1998)) and GRB 990712 (Vreeswijk et al. 2000b ) implied significant extinction. We pay attention to the fact that in the case of the host galaxy of GRB 990712 the extinction was mag (Vreeswijk et al. 2000b ). Moreover, the analysis of the GRB optical afterglow colours shows that the internal extinction may be sufficient (Castro-Tirado et al. Alberto1999 (1999); Klose et al. Klose (2000) and references therein). Thus, it is important to take into account the influence of internal extinction in the interpretation of observational data for estimates of star formation rate (SFR).
Our aim in this paper is to estimate the effects of internal extinction on the host galaxy parameters SFR and luminosity. We use our photometric observational data on GRB host galaxies, obtained with the 6-m telescope during the period 1998–2000 and other, already available data (Bloom et al. 1998b ; Djorgovski et al. Djorgovski (1998)). We performed a population synthesis modeling for two host galaxies (GRB 970508 and GRB 980703), using our and published near-infrared data from Pian et al. (Pian (1998)) and Bloom et al. (1998a ), to create a set of theoretical template SEDs for more exact estimation of reddening in the host galaxies.
Sect. 2 describes our observational data. In Sect. 3 we compare our broad-band flux spectra to the spectra of the GRB 970508 (Bloom et al. 1998b ) and GRB 980703 (Djorgovski et al. Djorgovski (1998)) host galaxies. Using the comparison of our data with template SEDs of local star-forming galaxies with different internal reddening, we roughly estimate the extinction in host galaxies (a first approximation). The results are given in Sect. 4. This comparison allows us to estimate the -correction for the hosts. We used the template SEDs from Sect. 4 to calculate the -correction as well as other methods for the estimates of absolute magnitudes of the host galaxies in Sect. 5. We describe and perform a theoretical modeling in Sect. 6. This modeling allows us to make more exact estimates of the internal extinction (in a second approximation) using rough estimates from Sect. 4. The results of the comparison of theoretical templates with our and infrared data of the host galaxies of GRB 970508 and GRB 980703 with essentialy different luminosities are used to estimate the effects of the internal extinction in the host galaxies. In Sect. 7 we make estimates of SFR for the host galaxy of GRB 991208 using different methods. The final discussion and conlusions are given in Sect. 8 and Sect. 9.
2 Observations and data reduction
Observations of the GRB host galaxies were performed during July 1998-March 2000 (see the log of observations in Table 3). The primary focus CCD photometer of the 6-m telescope of SAO RAS with the standard (Johnson-Kron-Cousins) photometric system was used. The photometric calibrations were performed using the Landolt standard stars (Landolt Landolt (1992)). All data were processed in the standard manner: bias and dark corrected, flat-fielded and inspected for cosmic-rays. The photometry of host galaxies was performed with a circular aperture fixed in all bands for each host galaxy. The ESO-MIDAS111MIDAS (Munich Image Data Analysis System) is distributed and supported by European South Observatory. http://www.eso.org/progects/esomidas/ package was used for the data processing and photometry.
| Host | ||||
|---|---|---|---|---|
| GRB 970228 | 0.97 | 0.73 | 0.54 | 0.35 |
| GRB 970508 | 0.12 | 0.09 | 0.07 | 0.04 |
| GRB 971214 | 0.07 | 0.05 | 0.04 | 0.02 |
| GRB 980613 | 0.36 | 0.28 | 0.22 | 0.13 |
| GRB 980703 | 0.25 | 0.19 | 0.14 | 0.09 |
| GRB 990123 | 0.07 | 0.05 | 0.04 | 0.02 |
| GRB 990510 | 0.7 | |||
| GRB 990712 | 0.11 | 0.08 | ||
| GRB 991208 | 0.07 | 0.05 | 0.04 | 0.02 |
| GRB 991216 | 1.48 | |||
| GRB 000131 | 0.13 | 0.08 | ||
| GRB 000301C | 0.16 | 0.12 | ||
| GRB 000418 | 0.09 | |||
| GRB 000926 | 0.06 |
Table 3 shows the results of our photometry for the galaxies with more than two filters. To tranform the magnitudes (see Table 1) into the flux densities we have used zero-points from Fukugita et al. (Fukugita (1995)). All these flux densities are corrected for the Galactic extinction.
In all cases our observations were performed more than 20 days after the GRB occurrence (see Table 3) and the contribution of the OT to the host galaxy continuum flux is expected to be minimal.
| Host | Date UT | Band | Exp. | Seeing | flux density, Jy |
|---|---|---|---|---|---|
| (s) | |||||
| GRB 971214 | 24.85 Jul. 1998 | 600 | |||
| 24.84 Jul. | 600 | ||||
| GRB 970508 | 21.74 Aug. 1998 | 4200 | |||
| 23.95 Jul. 1998 | 2000 | ||||
| 21.74 Aug. | 3000 | ||||
| 23.95 Jul. | 2000 | ||||
| GRB 980613 | 24.80 Jul. 1998 | 700 | |||
| 24.82 Jul. | 600 | ||||
| 23.00 Jul. | 1800 | ||||
| GRB 980703 | 24.05 Jul. 1998 | 480 | |||
| 24.06 Jul. | 320 | ||||
| 24.06 Jul. | 300 | ||||
| 24.07 Jul. | 360 | ||||
| GRB 990123 | 8.85 Jul. 1999 | 600 | |||
| 8.86 Jul. | 600 | ||||
| 8.84 Jul. | 600 | ||||
| 8.87 Jul. | 600 | ||||
| GRB 991208 | 31.90 March 2000 | 1795 | |||
| 31.84 March | 1490 | ||||
| 31.96 March | 1260 | ||||
| 31.87 March | 360 | ||||
| 04.21 April∗ | 3800 |
∗ The observations were obtained with the 2.5-m NOT (Castro-Tirado et al. 2001b )
3 Comparison of with spectra of host galaxies
Usually the spectroscopy of host galaxies is carried out when there is a significant contamination of the OT flux (see the column “spectrum” in Table 1). Here we present photometry of pure host galaxies or with a negligible OT contribution. In some cases (e.g. as for GRB 990123), absorption spectra were obtained. There is a range of redshifts for which no strong emission lines ([O ii] 3727Å, [O iii] 4959,5007Å and Balmer lines) are observed in the optical domain. In that case we can infer a lower limit to the redshift and it adds some uncertainty to the determination of the parameters of host galaxies. In the case of emission spectra, the luminosity (i.e. the equivalent width of the lines) is important. However, in the case of a sufficiently bright OT it is possible that the OT continuum would affect these parameters.
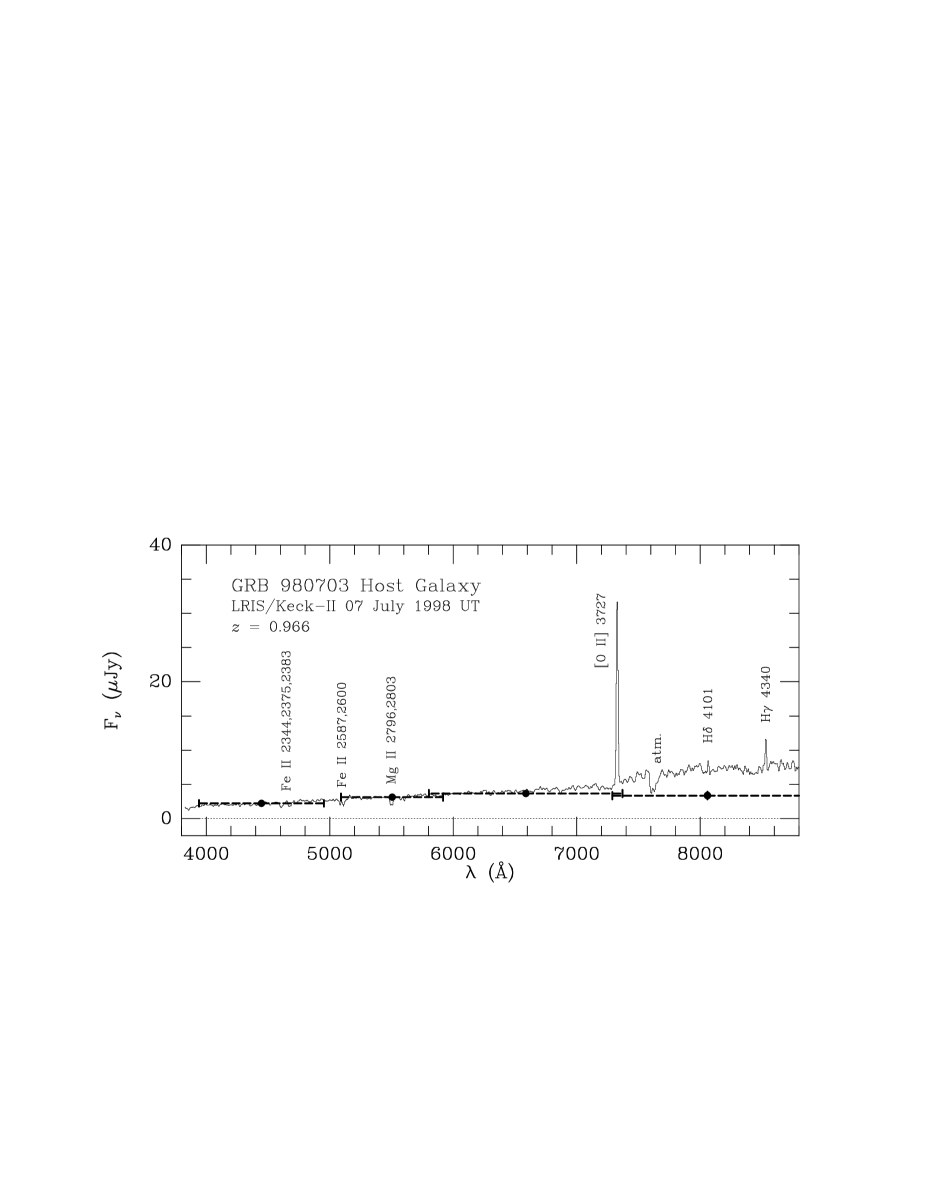
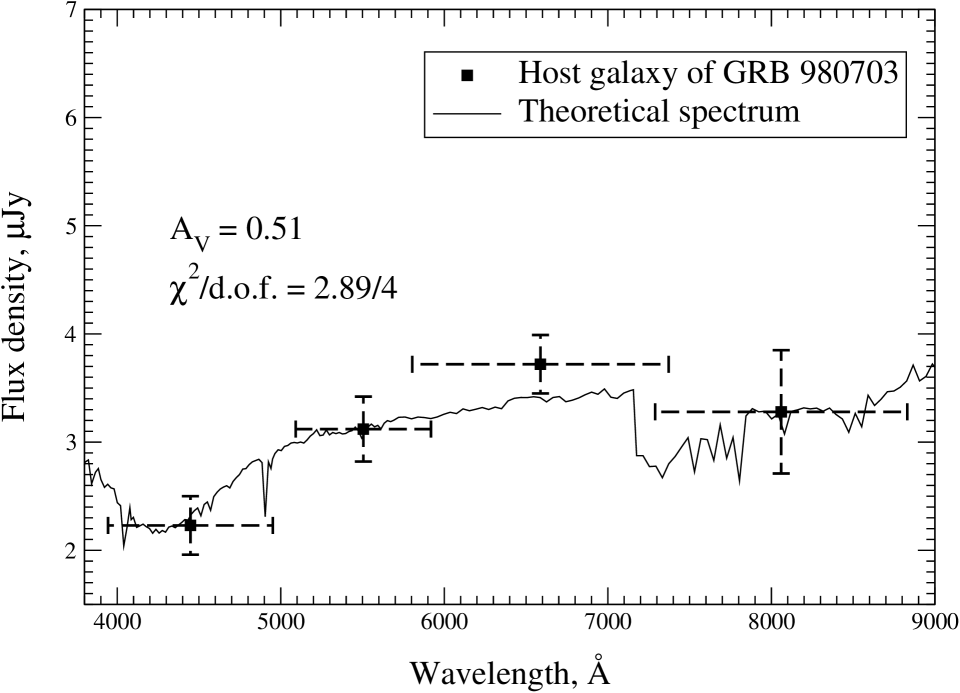
Nevertheless, Table 1 shows two cases of pure host galaxy spectra: GRB 970508 (Bloom et al. 1998b ) and GRB 980703 (Djorgovski et al. Djorgovski (1998)) which allow us to perform further theoretical modeling of the continuum spectral energy distribution of these hosts, making use of these spectra and our photometry (see Sect. 6). Here we show these two examples to demonstrate that photometrical spectral distribution describes well the spectral continua of host galaxies in the absence of any broad spectral features. Furthermore, in the case of absence of the spectra of a host galaxy itself (without OT), the photometry is the only tool to study spectral energy distribution for these faint objects.
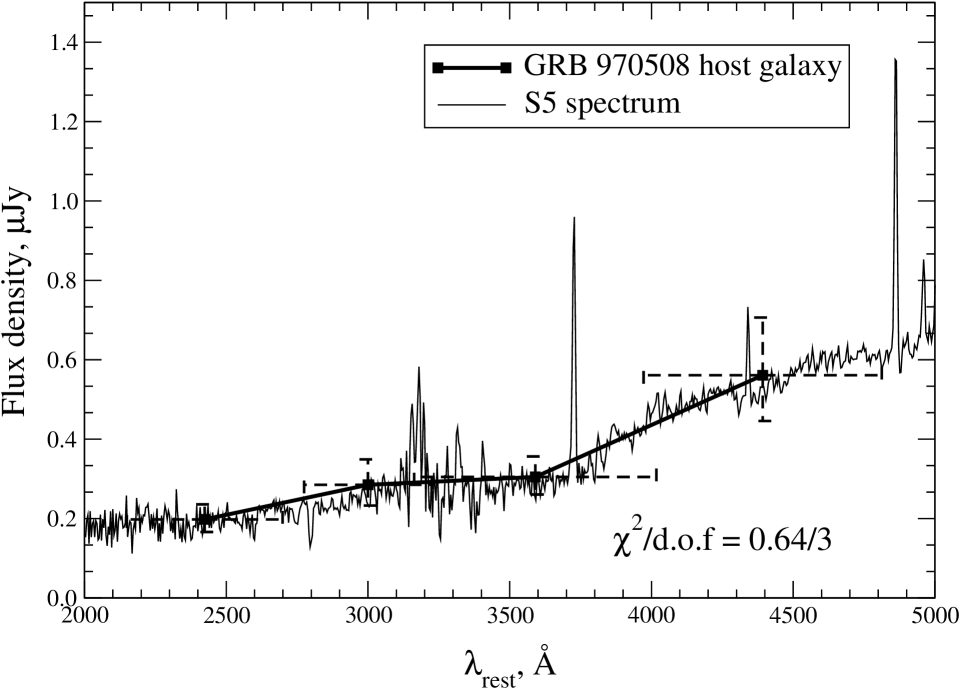
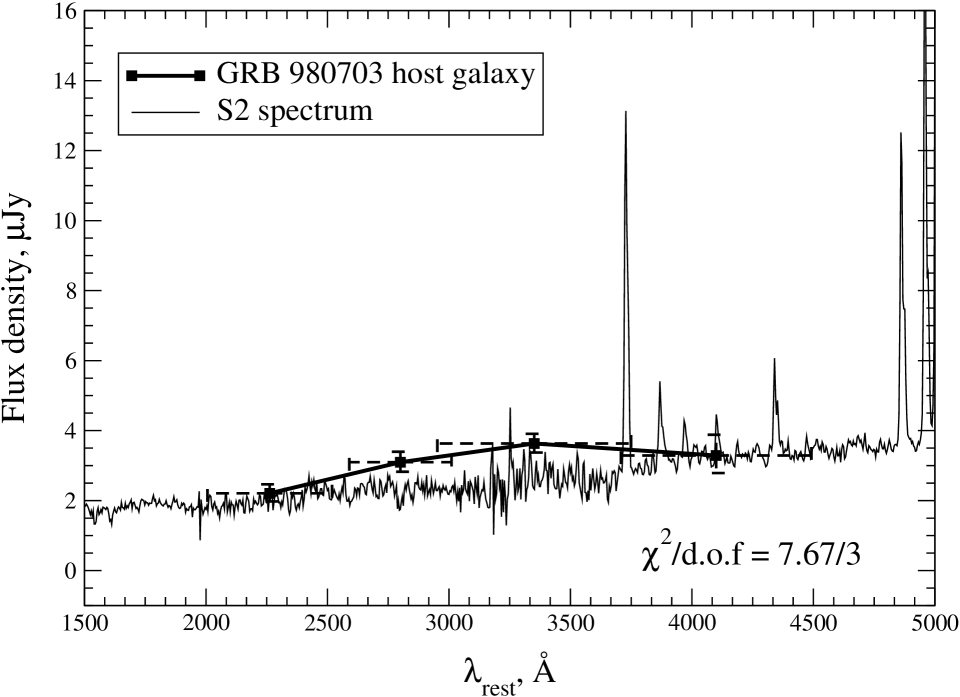
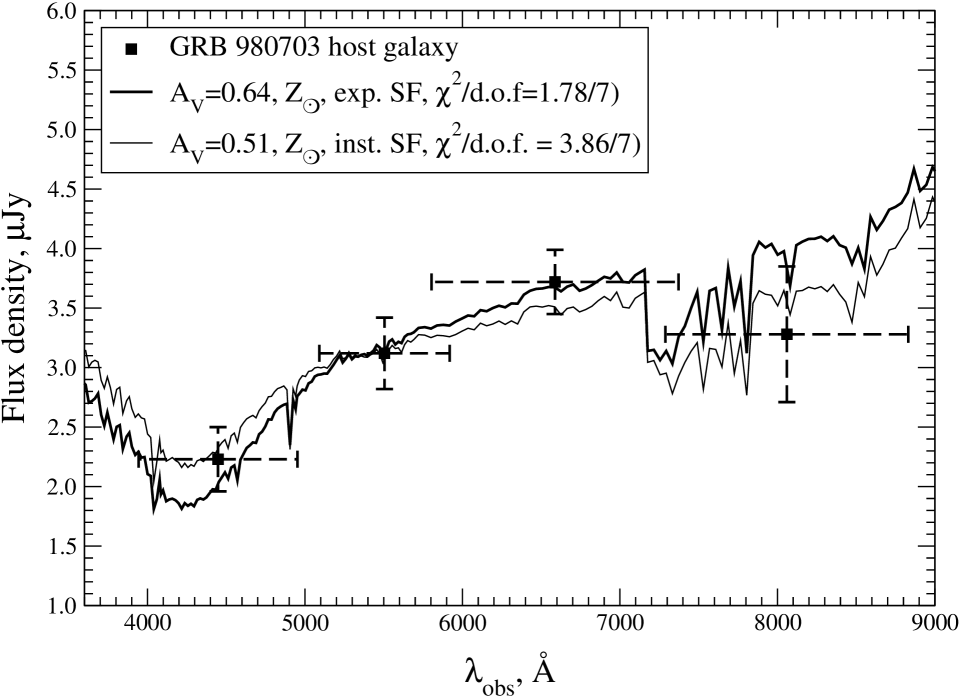
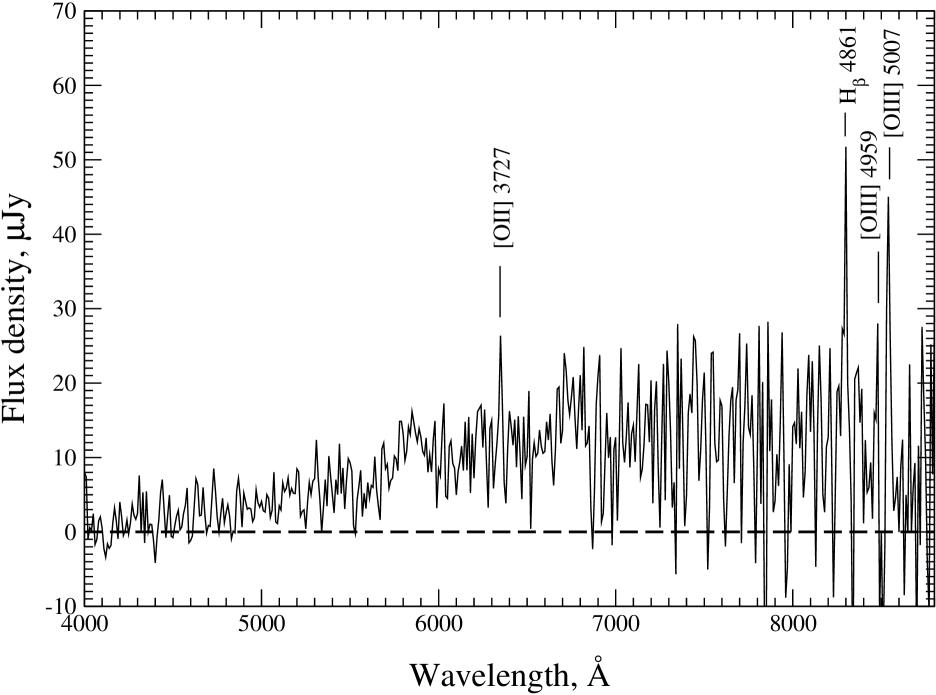
As can be seen from the comparison of our broad-band photometry with the spectra of these host galaxies (see Fig. 2 and 3), our photometric points are in perfect agreement with the continua of the host galaxies. Moreover, the errors in the photometry are significantly smaller than the noise present in the spectra (at least for the host of GRB 970508, which has typical magnitudes of GRB host galaxies). Thus, we can conclude that our broadband flux spectra approximate the spectral energy distributions (SEDs) properly at least in the cases where there are no broad spectral features in the spectra of these galaxies. This is the case of the pure spectra of the GRB 970508 and GRB 980703 hosts.
Additionaly, Fig. 3 shows the time evolution of the OT contribution to the spectrum of the host galaxy of GRB 980703. As we can see from the spectra obtained by Djorgovski et al. (Djorgovski (1998)) in two epochs: 07 July 1998 UT and 19 July 1998 UT, the central intensities of Balmer lines H and H remain close to constant during the observations. To explain this, it can be considered that the OT shone through an H ii region displaying Balmer lines in absorption, which may be evidence for a direct link between GRBs and star-forming regions, where massive O and B stars ionize the interstellar medium. The assosiation with H ii regions implies that long-duration GRBs are closely connected with the massive star formation and, consequently, with some explosions of Type Ib/c core collapse Supernovae (Bartunov et al. Bartunov (1994)).
In fact, we consider that broad-band photometry remains a useful tool for studying host galaxies, mainly due to the fact that it is impossible to obtain a spectrum for each GRB galaxy. Indeed, spectroscopy of extended objects of the integral 25-26th magnitude and fainter is a nontrivial task, even for 8-10 m class ground-based telescopes, because there is a background night-sky light which begins to dominate the target spectrum for the long time exposures needed to achieve a good signal-to-noise ratio.


4 Comparison of the spectra with the SEDs of local starburst galaxies
As we noted in Sect. 1, our aim is to determine the parameters (i.e. the luminosities) of the host galaxies. To estimate the reddening in the hosts (in a first approximation), the SEDs of local starburst galaxies with known colour excess were used. In addition, the comparison with these SEDs allows us to estimate the K-correction and, then, the luminosities of the host galaxies (it will be done in Sect. 5). In addition, we compared our broadband flux spectra to the spectra of different Hubble-type galaxies (from E-SO to Im, see Sokolov et al. Sokolov1999 (1999); Sokolov et al. Sokolov2000 (2000) and found that our data are best fitted by the spectra of starburst galaxies. By definition, we state that starburst galaxies are galaxies with a strong UV continuum, which leads to blue observed colours, and with strong nebular emission lines associated with starburst activity. Starburst galaxies also undergo a stage of massive star-forming.
To compare our broad-band flux spectra we used the S1, S2, S3, S4, S5, S6 averaged spectral energy distrubutions (SEDs) for the local starburst galaxies from Calzetti et al. (Calz1994 (1994)). The spectra of the local starbursts were grouped according to increasing values of the colour excess : from S1, with mag to S6, with mag. Using the relation for (Balmer optical depth) from Calzetti et al. (Calz1994 (1994)), we derived the values of colour excess for an individual group of starburst galaxies. These are: mag for S1, mag for S2, mag for S3, mag for S4, mag for S5 and mag for S6 (see Table 3 in Calzetti et al. Calz1994 (1994)). It should be noted that these SEDs are not observed but are the templates that have been constructed using real observed starburst SEDs up to a redshift of (Connoly et al. Connoly (1995)).
The fluxes of the starburst SEDs were integrated with sensitivity functions of the filters (sensitivity functions have been used from Bessel Bessel (1990)) and the derived values were compared to our observed fluxes. For each SED the was calculated as follows:
Here denotes the filters (), is the flux of GRB host galaxies in the filter , is the flux of the template SED integrated with sentivity function of the filter at effective wavelength of the filter , is the error of the flux of the GRB host galaxy in the filter , and is the normalization coefficient. The results of comparison are given in Table 4. In the last column the label “” means the value of divided by the degree of freedom. Figs. 4, 5 and 6 demonstrate the best fitting (minimum of ) of our broad band spectra by the starburst template galaxies. However, we should note that in the case of the host galaxy of GRB 980703, an S2 template galaxy just roughly fitted the data. But, as will be shown in Sect. 6, the results of this comparison will allow us to derive a more exact fitting of the observational data by modeling.
| Host | template | |||
|---|---|---|---|---|
| GRB 970508 | S5 | 0.51–0.60 | 1.5–1.86 | 0.64/3 |
| GRB 980613 | S6 | 0.61–0.70 | 1.8–2.17 | 1.22/2 |
| GRB 980703 | S2 | 0.11–0.21 | 0.3–0.65 | 7.67/3 |
| GRB 990123 | S1 | 0.10 | 0.31 | 2.29/3 |
| GRB 991208 | S5 | 0.51–0.60 | 1.5–1.86 | 0.99/3 |
∗ The values correspond to the Milky Way extinction law (Cardelli et al. Card (1989)).
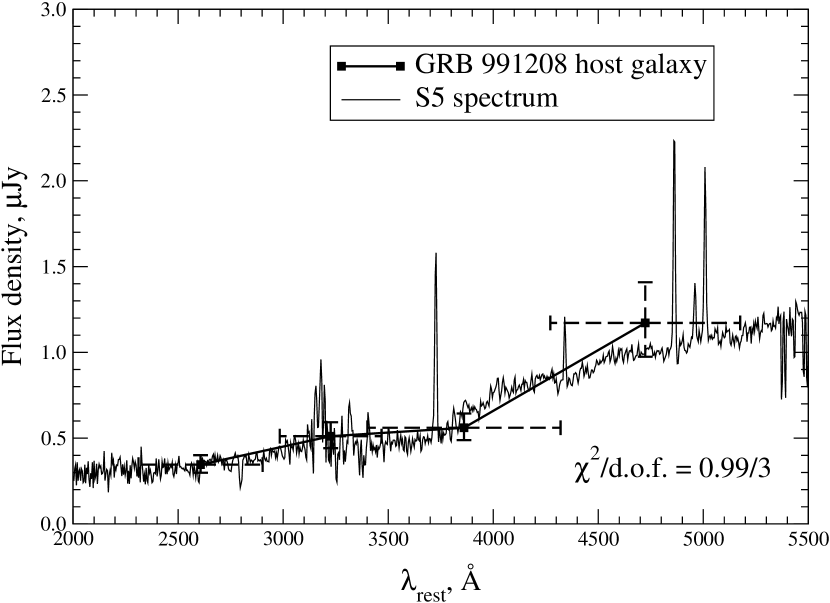
(It should be noted that the spectrum of the host galaxy of GRB 970508 has no feature at 3200Å like the one seen in S5 (Connoly et al. Connoly (1995)). But, we made an estimate of the contribution of this bump for the S5 template to the and bands and concluded that it is negligible).
5 Estimations of the absolute magnitudes
It is of great interest to compare the luminosities of the host galaxies to the luminosities corresponding to the luminosity of a typical galaxy () at the “knee” of the local galaxies luminosity function. Using the best fit SEDs of local starbursts from Sect. 4, we make estimates of observed luminosities of the 5-th GRB hosts. We use here mainly a Friedmann model with and (see e.g. de Bernardis et al. Bernardis (2000)). Recent studies of the Hubble constant put it within the range km s-1 Mpc-1 (see Theureau et al. Theureau (1997)). In this paper we adopt =60 km s-1 Mpc-1. But to estimate the influence of the cosmological parameters, we, in addition, use three models which conveniently limit the possibilities: A (60,1,0), B (60,0,0) and C (60,0,1), with (,,). For the models the relation is valid, where , , and . Here , , , and are the density, cosmological constant, curvature constant, and radius of curvature, respectively, and “0” denotes the present epoch.
According to our definitions of spectral types of the host galaxies (S1, S2 …), we can estimate the K-correction. The definition of the K-correction (see Oke & Sandage, Oke (1968)) is:
| (1) |
where is the rest-frame SED, is the transmission curve for filter and is the redshift. Using the SEDs from Calzetti et al. (Calz1994 (1994)), we estimated the -correction for the band. The results are given in Table 5. These estimates allow us to derive the absolute magnitudes of the host galaxies. Using the magnitudes from Table 3 and the K-correction given above, we derive the absolute magnitudes given in Table 5. We present the above-mentioned absolute magnitudes for the (A), (B) and (C) cosmological models. They reflect the uncertainty in the definition of due to the variation of the cosmological parameters.
| Host | -correction | Absolute magnitudes | |||
|---|---|---|---|---|---|
| (A) | (B) | (C) | |||
| GRB 970508 | |||||
| ( to ) | |||||
| GRB 980613 | |||||
| GRB 980703 | |||||
| GRB 990123 | |||||
| GRB 991208 | |||||
| ( to ) | |||||
For the host galaxies of GRB 970508 () and GRB 991208 (z=0.7063), we give two additional estimates of . As the band roughly corresponds to the band in the rest frame, we can calculate directly from Eq. (1) a second estimate of the K-correction for the -magnitude, assuming . Thus we derived: mag and mag for the host galaxies of GRB 970508 and GRB 991208, respectively. As a third estimate we can assume = mag considering that the observed filter matchs the filter in the rest-frame. This differs from the other two estimates, since going from to the -band we have to take into account the mismatch of zero points and the transmission curves of the colour bands.
Table 5 displays the uncertainties in the luminosities (by about one mag) due to different cosmological models. Therefore, the final values of the absolute magnitudes of the GRB host galaxies are given in Table 11 for a more realistic Friedmann model with =60 km s-1 Mpc-1, =0.3 and =0.7. The derived luminosities allow us to perform the theoretical modeling of continuum SEDs of the host galaxies.
We notice that in Sect. 4 the same best -fits were obtained by the template SEDs for the host galaxies of GRB 970508 and GRB 991208. It means that these two galaxies might have a similar internal extinction (see Table 4 and Sect. 7). Moreover, as can be seen from Table 5, these two galaxies have similar absolute magnitudes.
6 Modeling of the SEDs for GRB hosts
To estimate the effects of the internal extinction, we performed a theoretical modeling of the continuum spectral energy distributions of the host galaxies of GRB 970508 and GRB 980703. Note that for these galaxies the spectra, and near-infrared data are available and, what is most essential before drawing any conclusions, these galaxies have the lowest (GRB 970508) and the highest (GRB 980703) luminosities (see Table 5). Using a population synthesis modeling, we constructed a set of model theoretical templates for these two host galaxies as a second approximation to estimate internal extinction.
6.1 The method
We used the PEGASE code
(Projet d’Étude des GAlaxies
par Synthèse Évolutive)
developed by Fioc & Rocca-Volmerange (PEGASE (1997)),
which is publicly available at
ftp://ftp.iap.fr
/pub/from_users/fioc/PEGASE/PEGASE.2/).
We assumed the Salpeter IMF (Initial Mass Function) with the low and high
mass cut-offs to be 0.1 M☉ and 120 M☉ , respectively.
In the computations the and metallicity were assumed
as well as the simplest instantaneous burst and more complex exponential
decreasing star formation.
Since PEGASE computes SEDs at z=0, i.e. presents data in monochromatic
luminosities, we used
the cosmological parameters =60 km s-1 Mpc-1,
=0.3 and =0.7 for trasforming
monochromatic luminosities into observed fluxes.
The comparison of the broad-band flux spectra of the host galaxies of GRB 970508, GRB 980703, GRB 990123 and GRB 991208 with the local starburst SEDs allows us to consider that there is significant internal extinction in the host galaxies. To estimate the influence of this important fact we used the Cardelli et al. (Card (1989)) and Calzetti et al. (Calz2000 (2000)) extinction laws. These laws differ in the shape of the curve and the parameterization of with for the Calzetti et al. law and for the Cardelli et al. law. Fig. 7 shows both extinction law curves. Notice that the Cardelli et al. extinction law represents the reddening in the Milky Way (MW), while the Calzetti et al. law was derived empirically from a sample of integrated spectra of starburst galaxies (SB).
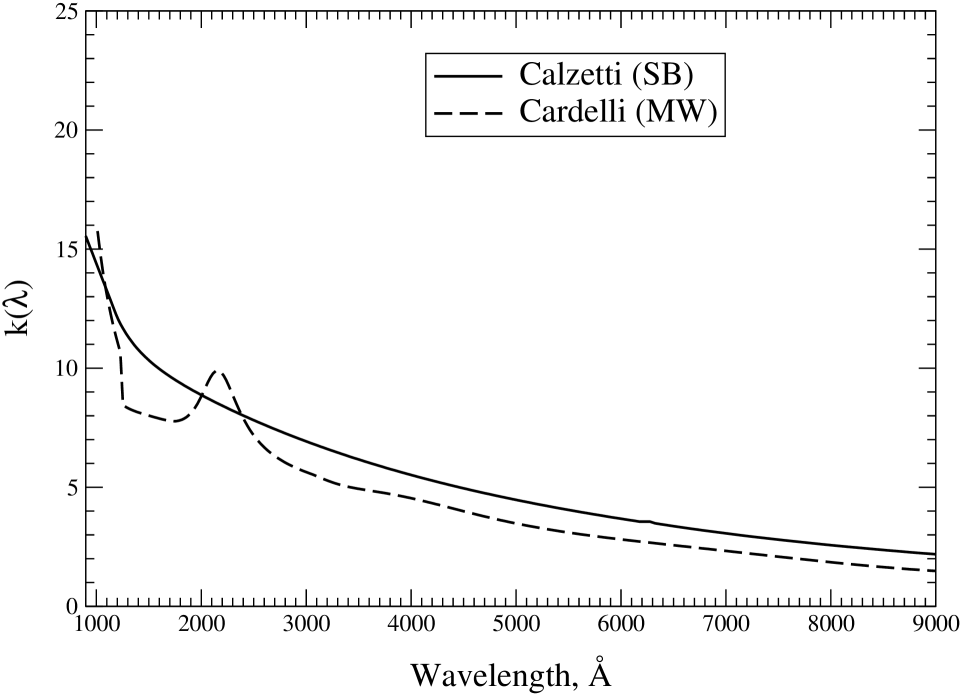
For simplicity we assumed a dust-screen model with the following mathematical relation for the reddening of spectra: , where and are the observed and intrisic fluxes, respectively, and is the extinction at a wavelength .
For calculation of the theoretical template SEDs we applied a two-component model: the first component is just a burst (“burst” component) of star-formation and the second one is an old (“old” component) stellar population. Both give corresponding contributions to a continuous spectrum, which produces on the aggregate the observed energy distribution in the galaxy spectrum. The “burst” component responds to emission lines and a nebular continuum. For this reason, we roughly fixed the “burst” component parameters using the luminosity of O ii forbidden emission lines by fitting to the observed fluxes and taking into account the assumed reddening laws. In the modeling, we used the observed fluxes of the O ii emmision line from Bloom et al. (1998b ) and Djorgovski et al. (Djorgovski (1998)), which are erg s-1 cm-2 and erg s-1 cm-2 for the host galaxy of GRB 970508 and GRB 980703, respectively. In addition, we estimated the contribution of the emission lines (not only [O ii]) of the spectra of the host galaxy of GRB 970508 and GRB 980703 to broad-band magnitudes and found that it is negligible for our errors. The choice of only forbidden lines allows us to avoid effects of contribution of stellar absorption into luminosity of emission lines, for example in the cases of Balmer lines. To see that only the short-duration star-formation burst (or “burst” component) determines the emission spectrum of the galaxy, it would be interesting to trace spectral evolution of a burst of star-formation with time. According to PEGASE, the nebular emission (lines and continuum) of an instantaneous burst, e.g., dominates up to 10 Myr (Fig. 8). The fixed parameters of a star-formation burst allow us to determine the age and mass of the oldest stellar population (“old” component) by fitting to the observed fluxes. Of course, we bear in mind the contributions into of the “burst” component. We reddened the burst light alone (in the “burst” component for the instantaneous burst as well as for the exponential decreasing star formation scenarios), since the extinction in starburst regions is higher than the average extinction and the colour excess is derived from emission of Balmer lines (Calzetti et al. Calz1994 (1994)) associated with H ii regions.

6.2 The host galaxy of GRB 970508
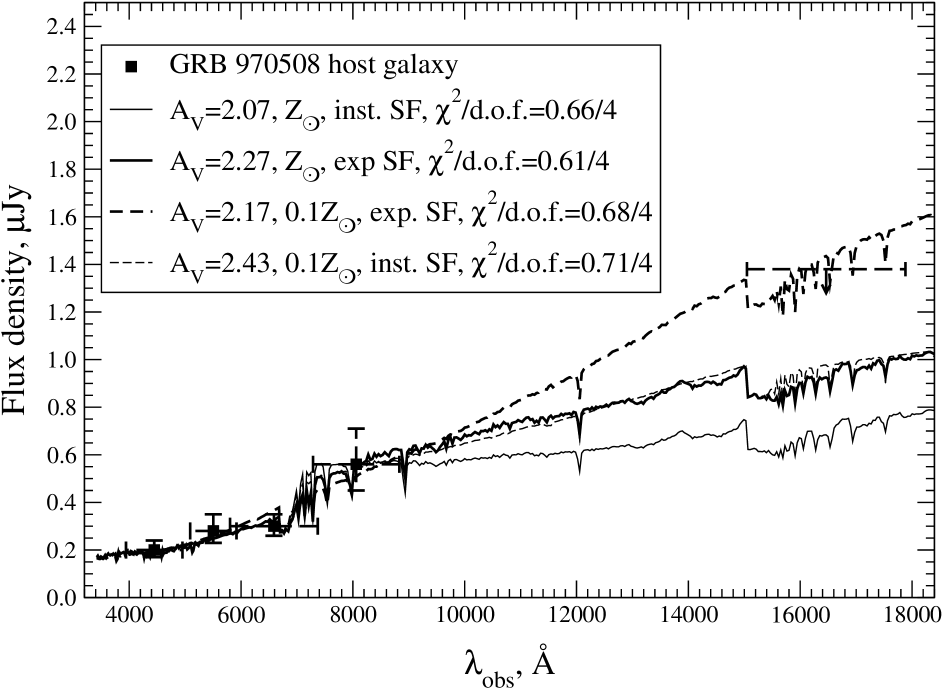
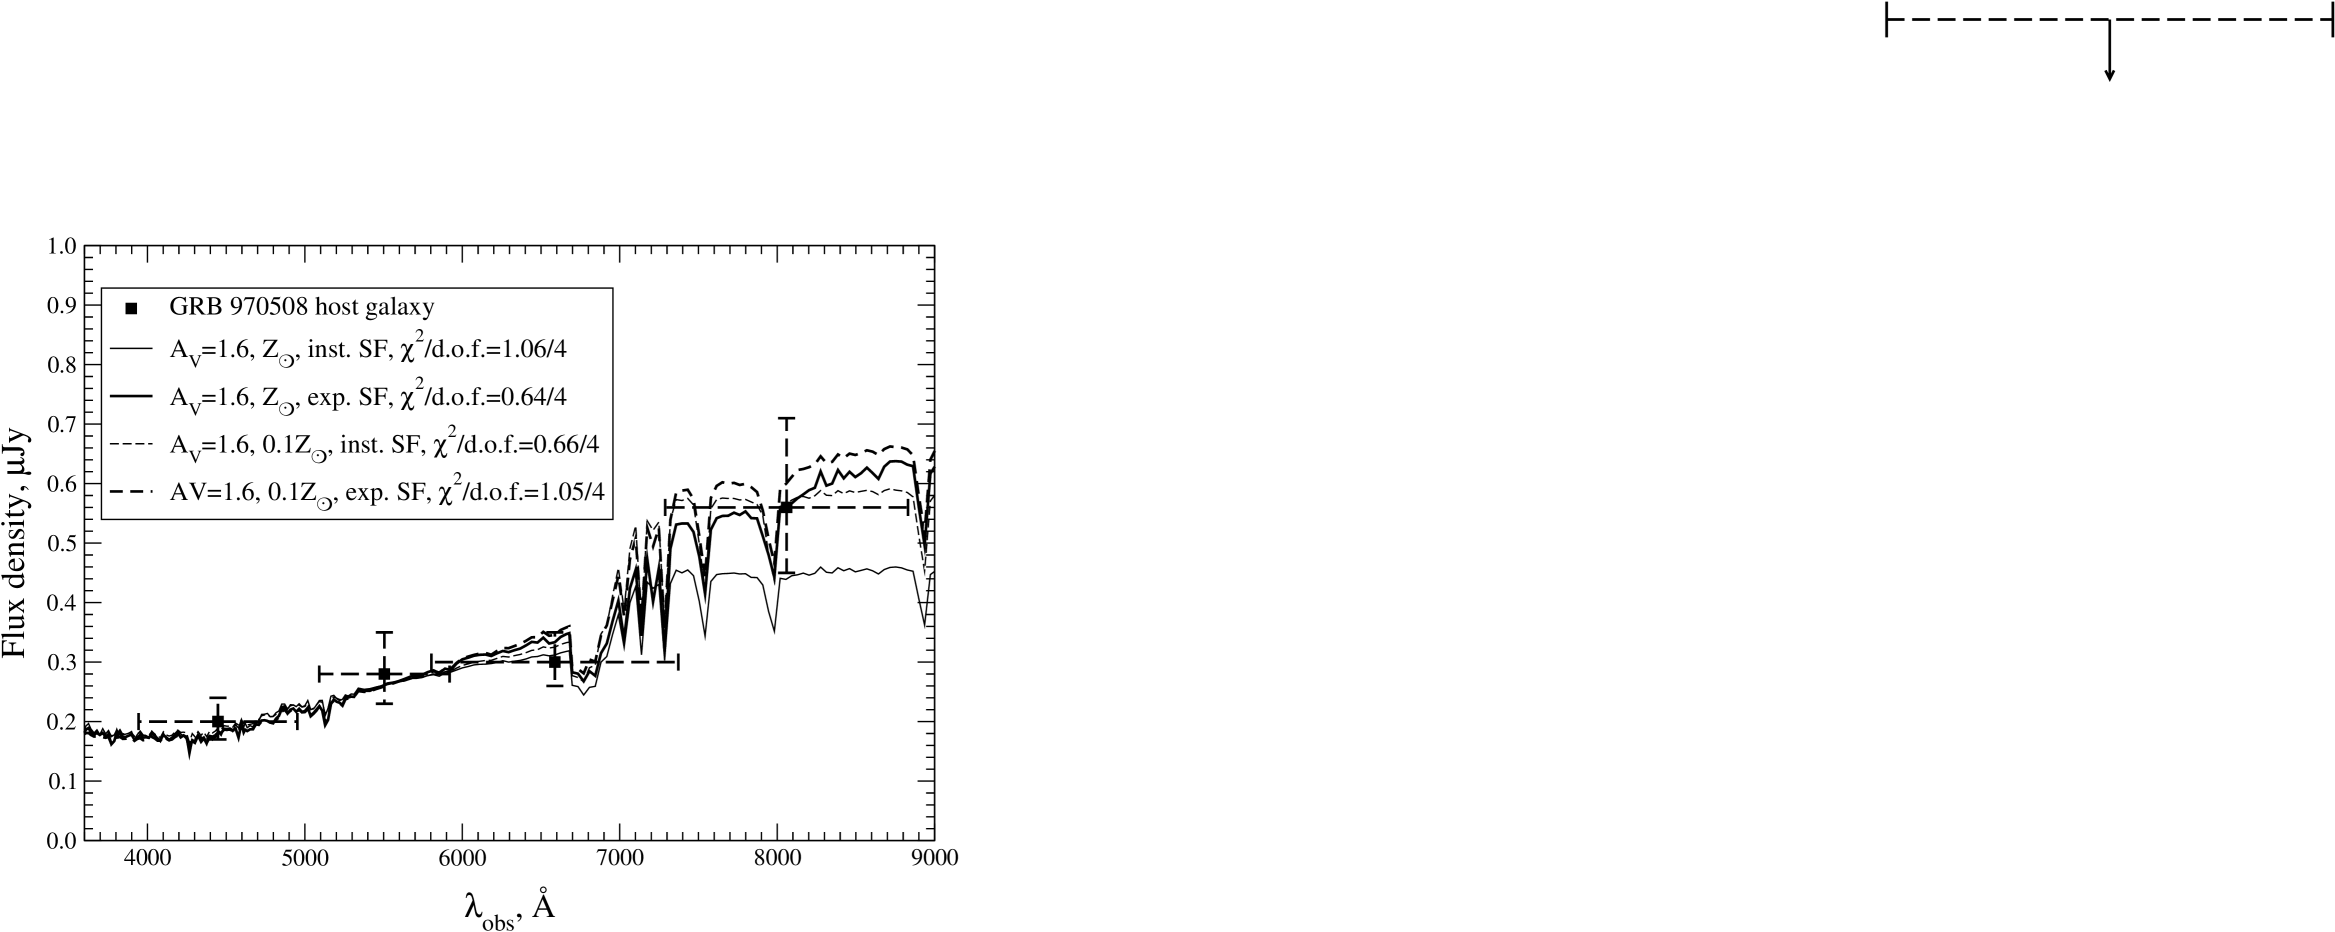
As was shown in Sect. 4, the GRB 970508 broad-band flux spectrum is well approximated by the S5 average SEDs and our photometric points are in good agreement with the continuum of the host galaxy shown in Fig. 2. Thus, we have to determine the colour excess . So, the definition of the host galaxy as an S5 averaged starburst group galaxy allows us to estimate the value of . According to mag we derive mag for Calzetti et al. (Calz2000 (2000)) and mag for Cardelli et al. (Card (1989)) reddening laws, respectively.
First, we performed the theoretical modeling assuming the Calzetti et al. extinction law. We used both the instantaneous burst and the exponential decreasing star formation scenarios as well as both and metallicities. In Figs. 9, 10 the results of modeling for the Calzetti et al. reddening law are presented. To constrain our models, we plot in these Figures, in addition, the upper limit of HST/NICMOS -band flux from Pian et al. (Pian (1998)). The parameters of the resulting theoretical template SEDs corresponding to the minimum of are given in Table 6. In Table 6 the first column indicates the scenario of star formation, in the second and third columns the age and mass of the old component (see text) are given and in the fourth and fifth columns the same parameters of the burst component are presented. For the exponential decreasing star formation scenario we also present the values of , which is the time when the star formation rate decreases by the factor of e. The sixth column denotes the metallicity of the theoretical template, the seventh column contains the model value of the [O ii]3727Å emission line flux. We present the minimal value of in the eighth column and in the last column the best fit values of extinction are given.
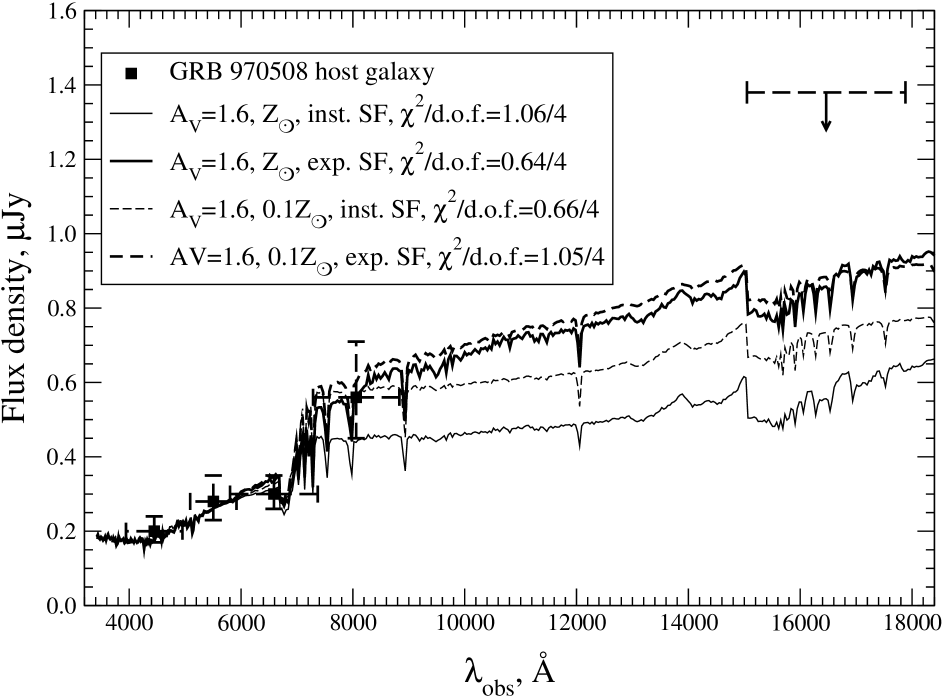
As was described in 6.1, we performed the theoretical modeling making use of Cardelli et al. extinction law. We again assumed both star formation scenarios and and metallicities. The resulting template SEDs with minimal are presented in Fig. 11, 12. The parameters of these SEDs are summarized in Table 7. The organization of the Table is the same as that of Table 6.
It is important to note that we checked the values of out of the range of given by fitting to S5-template and found that the best fit theoretical templates correspod to the values of , which lie in the S5-range. The results of the modeling imply that there is some uncertainty in the choice of the reddening laws. At least, as can be seen from Fig. 9, we may say that only one theoretical template with a metallicity of and exponential decreasing scenario for Calzetti et al. reddening law is not consistent with the upper limit of the -band and, thus, can be ruled out. A more detailed analysis of the results of the modeling is given in Sect. 8.

| Scenario | old component | burst component | metallicity | [O ii] model | /d.o.f. | |||
|---|---|---|---|---|---|---|---|---|
| Age, Gyr | Mass, M☉ | Age, Myr | Mass, M☉ | flux∗∗ | ||||
| Instantaneous | 0.14 | 1 | 0.66/4 | 2.07 | ||||
| burst | 0.08 | 4 | 0.71/4 | 2.43 | ||||
| Exponential | 1.2 (Myr) | 3 (Myr) | 0.61/4 | 2.27 | ||||
| decreasing | 0 (Myr) | 80 (Myr) | 0.68/4 | 2.17 | ||||
∗ The parameters were obtained by fitting to data with observed flux of [O ii] emission line.
∗∗ The flux of the [O ii] emission line derived in modeling (in units of erg s-1 cm-2).
| Scenario | old component | burst component | metallicity | [O ii] model | /d.o.f. | |||
|---|---|---|---|---|---|---|---|---|
| Age, Gyr | Mass, M☉ | Age, Myr | Mass, M☉ | flux∗ | ||||
| Instantaneous | 0.08 | 0 | 1.06/4 | 1.6 | ||||
| burst | 0.16 | 0 | 0.66/4 | 1.6 | ||||
| Exponential | 1.0 (Myr) | 0 (Myr) | 0.64/4 | 1.6 | ||||
| decreasing | 1.2 (Myr) | 0 (Myr) | 1.05/4 | 1.6 | ||||
∗ The flux of the [O ii] emission line derived in modeling (in units of erg s-1 cm-2).
6.3 The host galaxy of GRB 980703
The comparison of our broad-band flux spectrum with the spectra obtained in two epochs (see Fig. 3) has shown that on 7 July the contribution of the OT near the [O ii] emission line was not considerable and we may conclude that the luminosity of the [O ii] line is not affected by the OT. Moreover, from the 19 July data, the spectra of the host galaxy are already not contaminated by light from the OT. Thus, in spite of the fact that our observations were carried out 20 days after the GRB event, we may consider that our broad-band flux spectrum is exactly that of the host galaxy without any contribution from the OT.
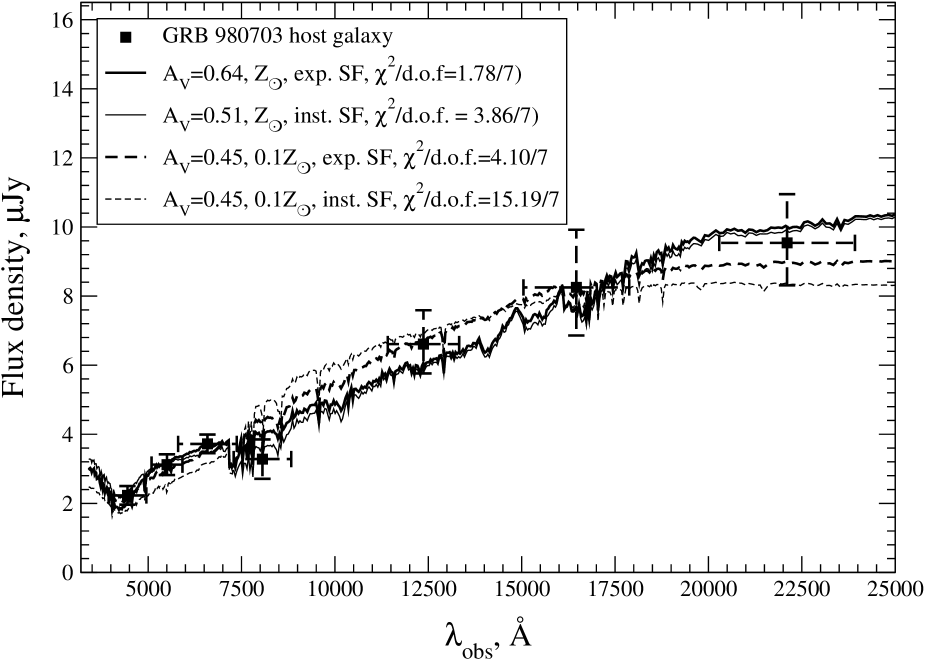
As we determinated above, the host galaxy is an S2 average local starburst with mag. According to the we have computed mag for the Calzetti et al. (Calz2000 (2000)) reddening law and mag for the Cardelli et al. (Card (1989)) one, which is in agreement with the value of 0.30.3 mag. obtained by Djorgovski et al. (Djorgovski (1998)) from the ratios of the H lines.
We performed the theoretical modeling using at first the simplest instantaneous burst of star formation scenario for the Sun metallicity. The best fit parameters (by the fluxes) were derived as follows: for the “burst” component of the model the age is 3.0 Myr and the mass is M☉ , and for the “old” component (for the old stellar population) the age is 2.5 Gyr and the mass is M☉ . Fig. 13 shows the results of the modeling. It should be noticed that our data are better fitted by the theoretical spectrum rather than the S2-template starburst galaxy (see Sect. 4). Calculations have shown that the fluxes are not described by a model using the Calzetti et al. reddening law, but best fitted by the Cardelli et al. extinction. At z=0.966 the effective wavelength of filter (Å) in the rest frame (Å) lies on the bump of Cardelli’s extinction curve (Å, see Fig. 7), which allows us to choose the reddening curve corresponding to the law of Cardelli (MW). In Fig. 16 it corresponds to the deficit of observed flux in the -band.
In addition, we performed theoretical modeling making use of the avalaible infrared data. Bloom et al. (1998a ) reported the photometry of the OT of GRB 980703. The observations were carried out with the NIRC instrument at the Keck 10-m telescope on 7 Aug. 1998, e.g., later than our observations. Thus, we may assume that these magnitudes are magnitudes of the host galaxy with a negligible contribution of the OT. In Fig. 14 we plot the SED model taking into account the infrared observations. Here we used the zero points of the band from Bessel & Brett (Bessel_Brett (1998)). The parameters of the resulting SEDs are presented in Table 8. For comparison in Fig. 13 we present the results of the modeling using only data (the parameters are given above). As can be seen from the comparison of model results for and fitting (see Fig. 14), we should use the infrared where available in the modeling for more exact estimates of mass and age of the “old” component. Indeed, bands (, respectively) correspond to the optical window and near infrared in the rest frame (for , for , respectively) where the old stellar population dominates and the contribution of the “burst” component (or young stellar population) is small. The maximum of the burst contribution lies in the UV part of the spectrum which corresponds to observed bands. In fact, from Figs. 13 and 14 we see that the modeling did not change the UV part of the SED. Consequently, the estimates of SFR are not affected in the case where we take into account the infrared data. In Table 8 the final results of the modeling taking into account the photometry of the host galaxy of GRB 980703 are given.
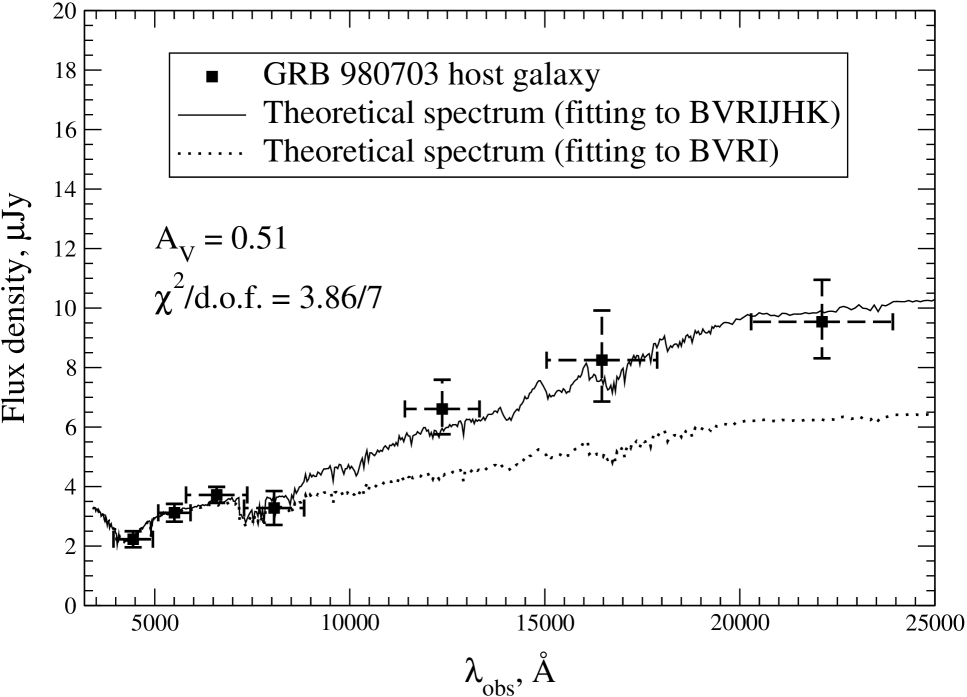
Following our method we performed the theoretical modeling using the simplest instantaneous burst as well as more complex exponential decreasing star formation scenarios, both ( and ) metallicities. The results of modeling are presented in Fig. 15 and the parameters of the template SEDs are given in Table 8. Here we used and data (with the observed flux in the [O ii]3727Å emission line). In Fig. 16 we plot the part of the spectrum of the best fit SEDs.
Table 8 gives all scenario versions of computations of template SEDs corresponding to minimum . The organization of the Table is the same as that of Table 6 and Table 7. Fig. 15 gives these template SEDs. As well as in the case of the modeling of the host galaxy of GRB 970508, we modeled SEDs out of the range of , which corresponds to the S2 template, and again found that the best fit template lies in the S2-range. As is seen from Fig. 15, regardless of the scenario choice, all template SEDs with minimum correspond to similar values of . Nevertheless, the best fits are obtained with SEDs of solar metallicity for the exponential and instantaneous burst scenarios with =0.51 and 0.64 mag. The least deviations from observational fluxes (plus flux in the line [O ii]3727Å) is obtained with SED corresponding to a galaxy of age of several Gyr. Thus, we choose this variant of SED with mag for calculation of SFR.
But it turns out that the choice of a definite law of reddening is more essential for the choice of than the choice of burst scenario, at least for the case of this GRB 980703 host galaxy. As was noted above, in the case of the host galaxy of GRB 980703 we have an opportunity to choose the internal extinction law using the observational data. Indeed, as is seen from Fig. 16, at the -band wavelength the flux deficit is observed. Using the obtained value of absorption (see Table 8) we can estimate the flux deficit in the -band in comparison to the -band as if it was a continuous reddening law like Calzetti (SB). This -band flux deficit is equal to 40% – 50% for mag, which is really observed for our broad-band flux spectrum (see Fig. 16).
The parameters of the GRB hosts with the account of our analysis for these two galaxies are given in Table 9 and will be disscused in more detail in Sect. 8.
| Scenario | old component | burst component | metallicity | [O ii] model | /d.o.f. | |||
|---|---|---|---|---|---|---|---|---|
| Age, Gyr | Mass, M☉ | Age, Myr | Mass, M☉ | flux∗∗ | ||||
| Instantaneous | 3 | 3 | 3.86/7 | 0.51 | ||||
| burst | 1.8 | 4 | 15.19/7 | 0.45 | ||||
| Exponential | 6 (Myr) | 16 (Myr) | 1.78/7 | 0.64 | ||||
| decreasing | 13 (Myr) | 40 (Myr) | 4.10/7 | 0.45 | ||||
∗The parameters were obtained by fitting to data with observed flux of [O ii] emission line, which is
erg s-1 cm-2 (see text).
∗∗ The flux of the [O ii] emission line derived in modeling (in units of erg s-1 cm-2).
| Host | Scenario | metallicity | Total mass | Age | observed SFR∗ | corrected SFR | |
|---|---|---|---|---|---|---|---|
| GRB 970508 | instant. burst | 160 Myr | 1.6 | M☉ yr-1 | 14 M☉ yr-1 | ||
| GRB 980703 | exp. decreasing | 6 Gyr | 0.64 | M☉ yr-1 | 20 M☉ yr-1 |
∗ The SFR was recomputed following cosmology with =60 kmsecMpc-1, =0.3 and =0.7.
7 Estimates of the SFR for the host galaxy of GRB 991208
On 13 and 14 December 1999 the spectrum of the GRB 991208 optical counterpart was obtained with the 6-m telescope of SAO RAS (see Fig. 17). Four emission lines were detected. These were , H and at a redshift of (Dodonov et al. Dodonov (1999)). The line detection allowed us to estimate the SFR (star-forming rate) using fluxes of the emission lines [O ii] and H. Table 10 presents the fluxes of the emission lines and corresponding SFR. Estimators of Kennicutt (Kennicutt (1998)) for [O ii] and Pettini et al. (Pettini (1998)) for H were used for estimating the SFR.
| Line | Flux | observed SFR | corrected SFR, M☉ yr-1 | corrected SFR, M☉ yr-1 |
| M☉ yr-1 | (SB, ) | (MW, ) | ||
| 3727Å | 1.790.22 | 7.62.4 | 118 | 71 |
| H 4861Å | 3.840.33 | 28.71.0 | 249 | 156 |
| UV | continuum | on 31 March 2000 | ||
| 2800Å Salpeter IMF | 0.380.09 Jy | 1.460.34 | 44 | 24 |
| 2800Å Scalo IMF | 0.380.09 Jy | 2.260.54 | 68 | 38 |
The photometry obtained on 31 March 2000 for the pure host galaxy allows us to estimate the SFR in an independent way. By interpolating between the and bands we derived the value of the flux at 2800Å in the rest frame. The flux density is Jy. The use of the Madau et al. (Madau (1998)) estimator yielded the values given in Table 10.
As can be seen from Table 10, there is a difference between the estimates due to the fact that internal extinction should be taken into account. The comparison with local starburst galaxies has shown that the broad-band flux spectrum is best fitted by the S5 average spectral energy distribution (see Sect. 4). For the S5 SED, the colour excess is 0.51–0.60 mag. It corresponds to the rest-frame -band extiction of =2.250.18 mag and =1.720.14 mag for the Calzetti et al. and Cardelli et al. reddening laws, respectively.
There is an independent way to estimate the SFR. The observed upper limit from the OT spectrum on the H/H ratio is 0.39, which corresponds to 1.3 mag (Whitford Whitford (1958)). This lower limit is in agreement with the limit derived from the comparison with the S5 template SED. Here we assumed the theoretical value of H/H to be equal to 0.4690.009 as expected for the case of B recombination.
Table 10 (the last two columns) gives the values of the SFR corrected for the internal extinction, if we assume a lower limit on =2.07 mag and =1.58 mag for the Calzetti et al. and Cardelli et al. reddening laws, respectively. The SFRs have been computed assuming Calzetti et al. (Calz2000 (2000)) and Cardelli et al. (Card (1989)) SB and MW reddening laws, correspondently. These values are higher by a factor of than the SFRs given by Vreeswijk et al. 2000b for the GRB 990712 host galaxy, but in agreement within their errors. As can be seen from Table 10, the SFRs differ again. But in principle, these estimators may give different values of the SFR. First, the estimates from the [O ii] 3727 luminosity are sufficiently sensitive to the density of enviroment where the emission lines form. Second, the intensity of nebular emission lines is sensitive to the most massive stars and these estimates give “current” rate of star formation for a mean time interval of a few million years. On the other hand, the characteristic time of averaging for estimates from the UV continuum is about 108 years. So, comparing the different method estimates we may trace the star formation history. Thus, from our extinction corrected SFRs we can conclude that, most probably, there is a recent vigorous burst of star formation in the GRB 991208 host galaxy.
8 Discussion
We fulfilled the modeling of SEDs for the galaxies from Table 11 with the highest and the lowest luminosity: the host galaxy of GRB 970508 and GRB 980703. Our main aim here was to estimate the extinction in the GRB hosts. As was described in Sect. 6, we achieved this goal using two approximations. First, the range of was derived using comparison of the broad-band flux spectra with local starburst templates. The second approximation is the theoretical modeling (or computing the theoretical templates), which allows us to choose the reddening law and the certain value of . The selected model parameters for these two GRB host galaxies are presented in Table 9. Let us discuss the results of the modeling.
The host galaxy of GRB 970508: As was noted in 6.2, in the case of the host galaxy of GRB 970508 there is some uncertainty in the choice of the reddening law. As the first approximation we derived the range of for both reddening laws, mag and mag for Calzetti et al. and Cardelli et al. extinction law, respectively. The modeling was performed in these ranges and the minimum of actually occurs within both of them. We found that for the Cardelli et al. extinction law the value of does not depend on the star formation scenario and metallicity, while for Calzetti’s law this dependency is clearly seen. As can be seen from Tables 6 and 7, in some cases the minimal value of takes place for models with burst component masses of the same order of old component mass or even higher. This is unlikely to be real. It is clear that a rather large amount of gas in the galaxy is needed to initiate formation of such a massive population. As it follows from the tables this mass of gas is to exceed the total mass of galaxy or to be at least of the same order, which seems to be unbelievable. On the other hand, this situation is likely to happen in the case of primeval galaxies, i.e. the galaxies where the first burst of star formation occurs. Nevertheless, the observations do not confirm the formation of primeval galaxies at z=0.835, in any case. Thus, the model of the instantaneous burst scenario and a metallicity of for the Calzetti et al. extinction law and the same scenario with both metallicities in the case of the Cardelli et al. extinction law seems to be more reasonable. Should one come back to the ages of the old component, it can be noticed that the theoretical template SEDs correspond to young galaxies, which in turn leads to the conclusion about a lower metallicity in comparison with that of the Sun. It follows from these considerations that SED from Table 7 with the following parameters: instantaneous burst of star formation, metallicity of and mag for the Cardelli et al. (MW) extinction law, is the most appropriate model. The selected parameters of the host galaxy are given in Table 9.
It may be noted that the ratio of the emission lines of the host galaxy is [Ne iii/[O ii]=0.440.05 (Bloom et al. 1998b ), which is similar to the Seyfert 2 (Sy2) ratio of about 0.41 from Storchi-Bergmann et al. (Storchi-Bergmann (1995)). For these reasons, it seems that the population synthesis models cannot describe the spectrum of the host due to nonthermal emission from an AGN. But Fruchter et al. (1999b ) noted that for two reasons, i.e. occasional location of OTs against the host galaxy without any trend to its core and unusually blue optical-to-infrared colours of other GRB hosts, a more certain explanation of the high [Ne iii]/[O ii] ratio would be the existence of active star formation in the host rather than the AGN interpretation (see Fruchter et al. 1999b and references therein). Moreover, as was concluded by Vreeswijk et al. (2000b ), in the case of another GRB host galaxy, the host galaxy of GRB 990712, the ratio of emission lines indicates that the host is most likely an H ii galaxy, contrary to the Seyfert 2 explanation of Hjorth et al. (Hjorth2000 (2000)). Finally, as was discussed by Sokolov et al. (Sokolov1999 (1999)), the GRB 970508 host would be a blue compact galaxy with a higher surface brightness. Their Fig. 6 showing the absolute magnitudes vs. the linear diameter revealed that the observed parameters ( and ) of the host galaxy of GRB 970508 lie on the branch of galaxies with surface brightness higher than normal (as it should be for Mrk galaxies), which again implies a starburst activity. Thus, we may conclude that the host galaxy of GRB 970508 is most probably an actively star-forming young galaxy, which is in agreement with the results of the modeling. Our value of the intrisic extinction allows us to derive the corrected SFR. Using the Cardelli et al. (Card (1989)) reddening curve and mag we computed that the SFR should be corrected by a factor of about 10. The lower limit of the SFR from the luminosity of the [O ii] emission line derived by Bloom et al. (1998b ) is about 1 M☉ yr-1 , the extinction corrected SFR will then be about 10 M☉ yr-1 for the cosmological parameters assumed by Bloom et al. (1998b ).
The host galaxy of GRB 980703: As was shown in Sect. 6.3, in the case of the host galaxy of GRB 980703 the observational data make it possible to choose the only extinction law similar to that in the Milky Way (Cardelli et al. Card (1989)). Thus, in the second approximation we investigated only one range of mag, which corresponds to the Cardelli et al. extinction law. As can be seen from Fig. 15 the theoretical templates with a metallicity of systematically deviate from the observed broad-band fluxes, particularly in the and -band domain. The fact that the data are best described by the models with solar metallicity is naturally explained by the age of the old component of the stellar population. Indeed, a period of time of order of 6 Gyr is enough to enrich the medium with heavy elements. The final parameters of the host galaxy are given in Table 9. As in the case of the host galaxy of GRB 970508, if the internal extinction is known, we can estimate the SFR corrected for the latter. As was concluded by Djorgovski et al. (Djorgovski (1998)), the lower limit to the SFR for the GRB 980703 host is about 7 M☉ yr-1 , which was derived from the luminosity. Then, using the Cardelli et al. (Card (1989)) reddening law and mag, we derive the SFR to be 14 M☉ yr-1 for the cosmology assumed in Djorgovski et al. (Djorgovski (1998)).
To summarize the modeling, we emphasize that due to the cosmological redshift, our photometry for the GRB host galaxies covers only the ultraviolet–blue part of the spectral range, which is too short. For a more certain modeling, as was demonstrated in the case of the host of GRB 980703, we need UV and IR observations of hosts, but this is a nontrivial task for objects with such low observed fluxes. But, as was shown, our photometric points are in excellent agreement with the spectra of the host galaxies and it suggests that our modeling is good enough to describe the hosts. In addition, we should note that the spectral range (in the rest frame) is sufficiently sensitive to some features of extinction laws. As we demonstrated in Sect. 6, in principle, it is possible even to distiguish between different reddening laws.
For the eight GRB host galaxies from Table 1 there were enough observational data for the correct estimates of the absolute rest-frame magnitudes in -band (see Table 11). Thus it would be interesting to compare the derived luminosities of the host galaxies (Table 11) with (where corresponds to the luminosity of a typical galaxy at the “knee” of the local galaxy luminosity function). As was discussed in Pian et al. (Pian (1998)) an galaxy has . Using a cosmological model with =60 kmsecMpc-1, =0.3 and =0.7 as in Sect. 5, we estimate the absolute magnitudes presented in Table 11, which have typical errors of from 0.3 to 0.4 mag derived from the calculations of the -correction in Sect. 5.
| Host | observed magn. | absolute magn. | reference |
|---|---|---|---|
| GRB 970228 | 24.60.2 | -18.6 | : Galama et al. (Galama (2000)) |
| : Bloom et al. (2000b ) | |||
| GRB 970508 | 24.990.17 | -18.6 | This paper |
| GRB 971214 | 25.690.3 | -21.1 | : This paper |
| : Kulkarni et al. (Kulkarni (1998)) | |||
| GRB 980613 | 23.580.1 | -20.8 | This paper |
| GRB 980703 | 22.300.08 | -21.3 | This paper |
| GRB 990123 | 24.470.14 | -20.9 | This paper |
| GRB 990712 | 21.800.06 | -19.9 | Hjorth et al. Hjorth2000 (2000) |
| GRB 991208 | 24.360.15 | -18.8 | This paper |
The values of given by other authors were recomputed according to the cosmology assumed by us. However, these magnitudes were computed in a different way. Bloom et al. (2000b ) computed the absolute magnitude from the observed continuum in the rest frame. Kulkarni et al. (Kulkarni (1998)) assumed an intrisic host galaxy spectrum with and extrapolating from the observed -band magnitude. They computed from the continuum of the host galaxy spectrum. In the case of the host galaxy of GRB 990712, was derived by Hjorth et al. (Hjorth2000 (2000)) assuming that for the observed -band is approximately equivalent to the rest-frame -band. Note that our estimates were made by calculating the -correction. Comparing and from Table 11, we can conclude that the luminosities of the host galaxies of GRB 970228, GRB 970508 and GRB 991208 are 0.1 , but the hosts of GRB 980613, GRB 980703 and GRB 990123 have values close to . At least, it seems that the luminosities of the hosts are certainly not above the “knee” of the local luminosity function.
We have shown that there is a significant internal extinction in these GRB host galaxies. The comparison with local star-forming SEDs and our modeling demonstrate the influence of the reddening. Taking into account the results of the modeling, the estimates of rest-frame extinction in the -band for the host galaxies of GRB 970508 and GRB 980703 yield and magnitudes, respectively. Then, the corrected absolute magnitudes for these hosts are and , respectively. These estimates are about or 1 mag higher than . Perhaps, the observational fact that GRB host galaxies are underluminous is due to obscuring of the UV and optical flux by dust and/or dense molecular clouds.
It would be interesting to compare our magnitudes from Table 11 to a recent paper by Fried et al. (Fried (2001)). These authors present results from the CADIS survey which includes a study of the luminosity function of various types of galaxies as a function of redshift (in particular their Table 2). They present the data for an km s-1 Mpc-1, and cosmological model. To transform the magnitudes from Table 2 of Fried et al. (Fried (2001)) to our cosmology (with km s-1 Mpc-1) we used the relation . Then the magnitudes are increased to be mag in the redshift range of , mag in the redshift range of and mag in the redshift range of for starburst galaxies from Table 2 by Fried et al. (Fried (2001)). The comparison with the absolute magnitudes from our Table 11 shows that the of the host galaxies of GRB 990712, GRB 980613 and GRB 980703 corresponds to from Fried et al. (Fried (2001)). The of the hosts of GRB 970228, GRB 970508 and GRB 991208 are much lower than the , but we pay attention to the fact that the observed -band magnitudes of these hosts are fainter by 1 mag than the completeness limit of the CADIS survey (, Fried et al. Fried (2001)). The redshifts of other two hosts from our Table 11 are out of the redshift range of the CADIS survey.
9 Conclusions
To summarize, we can conclude the following.
(i) There is a significant extinction in the host galaxies (up to mag). It is important to take into account effects of the reddening in the estimation of SFR. The GRB host galaxies show a high rate of star-formation if we correct the observed values for internal extinction, from tens to hundreds of solar masses per year.
(ii) Two host galaxies (GRB 970508 and GRB 991208) have equal luminosities and are fitted by the same local starburst template SEDs (S5), which means that these hosts have very similar internal extinction. For both of them the SFRs turn out to be high, and for the host galaxy of GRB 991208 the SFR is the highest (more that 150–200 M☉ yr-1 ) from all known GRB hosts, judging from fluxes in emission lines of this host galaxy.
(iii) In the case of the host galaxy of GRB 980703 the observed deficit in the -band can be explained by the excess of extinction near , which is characteristic of the extinction law similar to that of the Milky Way.
(iv) There is a connection between GRB and H ii regions (see Sect. 4, Ahn Ahn (2000)), and together with the association of the host galaxy of GRB 990712 with H ii galaxies (Vreeswijk et al. 2000b ), again implies strong evidence for massive star formation.
Thus, we conclude that long-duration GRBs seem to be closely related to vigorous massive star-forming in their host galaxies. It should be noted that the SFR in the host galaxies is unlikely to be much higher than in galaxies at the same redshifts (). As was shown by Glazebrook et al. (Glazebrook (1999)) at this redshift the mean star formation rate is about 20-60 M☉ yr-1 (see also Blain & Natarajan Blain (2000)). For these reasons we conclude that GRB host galaxies seem to be similar to field galaxies at the same redshift.
Acknowledgements.
We thank S.G. Djorgovski and J.S. Bloom for kind permission to use two figures (Figure 2 and Figure 3) from their papers. We thank V.I. Korchagin and Yu.V. Baryshev for fruitful discussion of the results. We also thank our referee (S. Klose) for useful comments that improved our manuscript on several important points. The work was supported by the INTAS N96-0315, “Astronomy” Foundation (grant 97/1.2.6.4) and RFBR N98-02-16542, RFBR N00-02-17689.References
- (1) Ahn, S. 2000, ApJ, 530, L9
- (2) Andersen, M.I., Hjorth, J., Pedersen, H., et al. 2000, A&A, 364, L54
- (3) Bartunov, O.S., Tsvetkov, D.Yu., & Filimonova, I.V., 1994 PASP, 106, 1276
- (4) Bessel, M.S. 1990, PASP, 102, 1181
- (5) Bessel, M.S. & Brett, J.M. 1998, PASP, 100, 1134
- (6) Blain, A.W. & Natarajan, P. 2000, MNRAS, 312, L35-L38
- (7) Bloom, J.S., Frail, D.A., Kulkarni, S.R., Djorgovski, S.G., et al. 1998a, ApJ, 508, L21
- (8) Bloom, J.S., Djorgovski, S.G., Kulkarni, S.R., Frail, D.A. 1998b, ApJ, 507, L25
- (9) Bloom, J.S. 1999, GCN #756
- (10) Bloom, J.S., Kulkarni, S.R., Djorgovski, S.G. 2000a, submitted to AJ, astro-ph/0010176, http://xxx.lanl.gov
- (11) Bloom, J.S., Djorgovski, S.G., Kulkarni, S.R. 2000b, submitted to ApJ, astro-ph/0007244, http://xxx.lanl.gov
- (12) Bloom, J.S. 2000c, GCN #661
- (13) Calzetti, D., Kinney, A.L., Storchi-Bergmann, T. 1994, ApJ, 429, 582
- (14) Calzetti, D., Armus, L., Bohlin, R., et al. 2000, ApJ, 533, 682
- (15) Cardelli, J.A., Clayton, G.C. & Mathis, J.S. 1989, ApJ, 345, 245
- (16) Castro-Tirado, A.J., Zapatero-Osorio, M. R., Gorosabel, J., et al. 1999, ApJ, 511, L85
- (17) Castro-Tirado, A.J. 2001a, Invited talk given at the Fourth INTEGRAL Workshop: Exploring the Gamma-ray Universe (Alicante, Spain, 4-8 Sep 2000). ESA-SP Conf. Proceedings, in press, astro-ph/0102122, http://xxx.lanl.gov
- (18) Castro-Tirado, A.J., Sokolov, V.V., Gorosabel, J., et al. 2001b, A&A, in press
- (19) Connoly, A.J., Szalay, A.S., Bershady, M.A., Kinney, A.L., Calzetti, D. 1995, AJ, 110, 1071
- (20) de Bernardis, P., Ade, P.A.R., Bock, J.J., et al. 2000, Nature, 404, 955
- (21) Djorgovski, S.G., Kulkarni, S.R., Bloom, J.S., et al. 1998, ApJ, 508, L17
- (22) Dodonov, S.N., Afanasiev, V.L., Sokolov, V.V., et al. 1999, GCN #475
- (23) Fioc, M. & Rocca-Volmerange, B. 1997, A&A, 326, 950
- (24) Fried, J.W., von Kuhlmann, B., Meisenheimer, K., et al. 2001, A&A, 367, 788
- (25) Fruchter, A.S., Ferguson, H., Pepper, J., et al. 1999a, GCN #386
- (26) Fruchter, A.S., Pian, E., Gibbons, R., et al. 1999b, astro-ph/9903236, http://xxx.lanl.gov
- (27) Fruchter, A.S., Metzger, M., Petro, L., et al. 2000, GCN #701
- (28) Fruchter, A.S. 2001, Proc. of the 2-nd Rome Workshop, Gamma-ray bursts in the afterglow Era, in press.
- (29) Fukugita, M., Shimasaku, K., Ichikawa, T. 1995, PASP, 107, 945
- (30) Fynbo, J. P. U., Moller, P., Dall, T., et al. 2000a, GCN #807
- (31) Fynbo, J.P.U., Moller, P., Burud, I., et al. 2000b, GCN #871
- (32) Galama, T.J., Tanvir, N., Vreeswijk, P.M., et al. 2000, ApJ, 536, 185
- (33) Glazebrook, K., Blake, C., Economou, F., Lilly, S., Colless, M. 1999, MNRAS, 306, 843
- (34) Hjorth, J., Andersen, M.I., Cairos, L.M., et al. 1999, GCN #219
- (35) Hjorth, J., Holland, S., Courbin, F., et al. 2000, ApJ, 539, L75; 534, L147
- (36) Kelson, D.D., Illingworth, G.D., Franx, M., Magee, D., & van Dokkum, P.G. 1999, IAU Circ. 7096
- (37) Kennicutt, R.C. 1998, ARA&A, 36, 189
- (38) Klose, S, Stecklum, B., Masetti, N., et al. 2000, ApJ, 545, 271
- (39) Kulkarni, S.R., Djorgovski, S.G., Ramaprakash, A.N., et al. 1998, Nature, 393, 35
- (40) Landolt, A.U. 1992, AJ, 104, 340
- (41) Lattimer, J.M., & Schramm, D.N. 1974, ApJ., 192, L145
- (42) Madau, P., Pozzetti, L., & Dickinson, M. 1998, ApJ, 498, 106
- (43) MacFadyen, A. & Woosley, S.E. 1999, ApJ, 524, 262
- (44) Metzger, M.R., Djorgovski, S.G., Kulkarni, S.R. et al. 1997, Nature, 387, 878
- (45) Metzger, M.R. 2000, GCN #733
- (46) Oke, J.B. & Sandage, A. 1968, ApJ, 154, 21
- (47) Paczinśki, B. 1999, astro-ph/9909048, http://xxx.lanl.gov
- (48) Pettini, M., Steidel, C.C., Dickinson, M., et al. 1998, ApJ, 508, L1
- (49) Pian, E., Fruchter, A.S., Bergeron, L.E., et al. 1998, ApJ, 492, L103-L106
- (50) Piro, L., Garmire, G., Garcia, G., et al. 2000, Science, 290, 955
- (51) Sokolov, V.V., Zharikov, S.V., Baryshev, Yu.V., et al. 1999, A&A, 344, 43
- (52) Sokolov, V.V., Fatkhullin, T.A., Komarova, V.N. 2000, Bulletin SAO RAS, 49, 11, astro-ph/0001357, http://xxx.lanl.gov
- (53) Storchi-Bergmann, T., Kinney, A., Challis, P. 1995, ApJSS, 98, 103
- (54) Theureau, G., Hanski, M., Ekholm, T., et al. 1997, A&A 322, 730
- (55) Vreeswijk, P.M., Rol, E., Hjorth, J., et al. 1999, GCN #496
- (56) Vreeswijk, P.M., Fruchter, A.S., Fergusson, H, & Kouveliotou, C. 2000a, GCN #751
- (57) Vreeswijk, P.M., Fruchter, A.S., Kaper, L., et al. 2000b, ApJ, 546, 672
- (58) Whitford, A.E. 1958, AJ, 63, 201