The Nature of the Nuclear H2O Masers of NGC 1068: Reverberation and Evidence for a Rotating Disk Geometry
Abstract
We report new (1995) Very Large Array observations and (1984–1999) Effelsberg 100m monitoring observations of the 22 GHz H2O maser spectrum of the Seyfert 2 galaxy NGC 1068. The sensitive VLA observations provide a registration of the 22 GHz continuum emission and the location of the maser spots with an accuracy of mas. Within the monitoring data, we find evidence that the nuclear masers vary coherently on time-scales of months to years, much more rapidly than the dynamical time-scale. We argue that the nuclear masers are responding in reverberation to a central power source, presumably the central engine. Between October and November 1997, we detected a simultaneous flare of the blue-shifted and red-shifted satellite maser lines. Reverberation in a rotating disk naturally explains the simultaneous flaring. There is also evidence that near-infrared emission from dust grains associated with the maser disk also responds to the central engine. We present a model in which an X-ray flare results in both the loss of maser signal in 1990 and the peak of the near-infrared light-curve in 1994. In support of rotating disk geometry for the nuclear masers, we find no evidence for centripetal accelerations of the redshifted nuclear masers; the limits are km s-1 year-1, implying that the masers are located within 2° of the kinematic line-of-nodes. We also searched for high velocity maser emission like that observed in NGC 4258. In both VLA and Effelsberg spectra, we detect no high velocity lines between km s-1– km s-1 relative to systemic, arguing that masers only lie outside a radius of pc (1.9 light-years) from the central engine (assuming a distance of 14.4 Mpc). We also consider possible models for the jet masers near radio continuum component C. We favor a shock-precursor model, in which the molecular gas surrounding the jet is heated by X-ray emission from a shock front between the jet and a molecular cloud.
1 Introduction
NGC 1068 (catalog ) is one of the classical Seyfert galaxies (Seyfert, 1943) and is the prototype for type 2 Seyferts (Khachikian & Weedman 1974). In polarized light, however, the optical spectrum has characteristics of Seyfert type 1 spectra (Antonucci & Miller, 1985). The model is that the broad-line region and central engine are obscured by an edge-on, dusty molecular disk and can be seen only in reflected (and therefore polarized) light. NGC 1068 is one of the original H2O megamaser galaxies (Claussen, Heiligman, & Lo, 1984), and it was proposed early on that these masers may trace warm molecular gas in the obscuring disk (Claussen & Lo, 1986).
NGC 1068 is unusual among megamaser galaxies because there appears to be two distinct sources of H2O maser emission associated with compact features of the radio jet. The inner arcsecond of the radio jet of NGC 1068 resolves into several compact sources connected by fainter, linear radio structure. For reference, Figure 1 provides a new 22 GHz image of the sub-arcsecond jet with the principal compact features NE, C, S1, and S2 labeled. H2O maser emission associates with components S1 and C (Gallimore et al., 1996). Discussed further below, virtually all of the current evidence points to S1 as the location of the hidden nucleus (e.g., Gallimore, Baum, & O’Dea 1997). As much for convenience as interpretation, we therefore refer to the masers associated with S1 as “the nuclear masers” and the masers associated with component C as the “jet masers.” We adopt a distance of 14.4 Mpc (Tully, 1988), corresponding to a scale of pc, or 228 light-years.
1.1 The Nuclear Masers at Component S1
The nuclear masers at S1 span a velocity range of roughly 600 km s-1 (see Figures 2–4). The brightest nuclear masers concentrate near three discrete velocities, nearly symmetric about the systemic velocity of the galaxy ( km s-1; Brinks et al. 1997). In the LSR inertial frame and adopting the optical convention for Doppler velocities, the nuclear masers comprise the “red masers” near km s-1, the “systemic masers” near 1140 km s-1, and the “blue masers” centered near 860 km s-1. The red masers are the brightest and have enjoyed the most detailed study; in contrast, the weaker blue masers have been largely ignored, presumably owing to sensitivity considerations (Nakai et al. 1995; Gallimore et al. 1996). As a result, there are very few monitoring observations of the systemic and blue masers.
Apart from the presence of masers, S1 is peculiar in two respects. Firstly, the radio continuum spectrum is consistent with thermal free-free emission turning opaque below GHz (Gallimore, Baum, & O’Dea 1996; Gallimore, Baum, & O’Dea 1997; Roy et al. 1998). Secondly, VLBA observations resolve S1 into a parsec-long, vaguely linear source aligned at right angles to the local radio jet axis (Gallimore, Baum, & O’Dea, 1997). The brightness temperatures over the 5–8 GHz frequency interval range from – K. These results argue that S1 traces thermal emission from a disk rather than synchrotron emission from a jet. We proposed that S1 might trace free-free emission from ionized gas on the inner surface of the obscuring torus (Gallimore, Baum, & O’Dea 1996; Gallimore, Baum, & O’Dea 1997).
Since the discovery of the blue-shifted masers, VLBA observations have resolved the position-velocity distribution of the nuclear maser spots (Greenhill & Gwinn, 1997). The masers align along position angle , and the high-velocity (red and blue) masers extend out to pc (2.7 light-years) symmetrically about the near-systemic masers. The position-velocity profile of the maser spots is linear out to a separation of pc from the near-systemic masers. The redshifted masers show a falling position-velocity curve beyond pc; Greenhill & Gwinn (1997) claim that the velocities fall more slowly than as would be expected for purely Keplerian motion. Given the similarities to NGC 4258 (catalog ) (Miyoshi et al., 1995), the interpretation has been that the nuclear masers of NGC 1068 also trace a rotating molecular disk surrounding a central black hole (Gallimore et al. 1996; Greenhill & Gwinn 1997).
However, the arguments for NGC 1068 are not as compelling as for NGC 4258, since the masers do not align at right angles to the radio jet axis, nor do they clearly align with the thermal disk. One possibility is that the disk is highly warped between the inner, ionized region and the outer, molecular region (e.g., as discussed in the review of the “NGC 1068 Workshop” by Begelman & Bland-Hawthorn 1997). On the other hand, the nuclear masers might arise from an outflow, such as an AGN-powered wind (e.g., Königl & Kartje 1994). In this case, the maser kinematics are not strictly controlled by gravitation and therefore do not necessarily measure the central mass.
Baan & Haschick (1996) reported a drift in the velocities of the red masers over time, which they interpreted as a centripetal acceleration. This measurement is in conflict with the disk interpretation. In the disk model, the direction of centripetal acceleration at the position of the red masers is in the plane of the sky. There should be no Doppler velocity drifts among the red masers owing to centripetal motion; rather, there should be detectable accelerations among only the near-systemic masers. The apparent accelerations of the red masers therefore argue against the disk model, but an outflow model may better accommodate their observations.
1.2 The Jet Masers at Component C
The jet masers at component C appear to arise near a shock front between the outflowing radio jet and an intervening molecular cloud (Gallimore, Baum, & O’Dea, 1996). Apart from the presence of maser emission, further evidence for this scenario includes the bending of the radio jet axis by , a localized flattening of the radio spectrum, and a local brightening of the radio emission. The continuum behavior suggests either re-acceleration or compression of the synchrotron plasma, or local magnetic field compression, specifically at this site. An additional result is that, adopting our suggested radio-HST image alignment (Gallimore, Baum, & O’Dea, 1996), the brightest scattered optical/UV continuum occurs at the site of this shock. This result has led us to propose that the dominant source of scattered light in NGC 1068 is warm ( K), highly ionized gas occuring at this shock front (Gallimore, 1996). Gallimore et al. (1997) and Roy et al. (1998) have since demonstrated evidence for free-free absorption below 1.6 GHz, supporting this scenario.
1.3 The Present Work
We have re-observed the H2O masers of NGC 1068 with the Very Large Array (VLA), and we have monitored the temporal behavior of the maser emission using the Effelsberg 100m telescope. We present and discuss the results and analysis of these monitoring studies in this work. This paper is organized as follows. Section 2 describes the observations, both new and archival, and data reduction procedures. Sections 3–5 report the results of the radio spectral line experiments apart from considerations of reverberation. More specifically, Section 3 reports on the VLA imaging experiment. Section 4 discusses a VLA search for high velocity maser emission. In section 5, we analyze the monitoring data to look for radial accelerations in the nuclear red masers. The case for reverberation is first discussed in Section 6, which includes a study of the correlations of maser brightnesses and the 1997 flare of the red and blue nuclear masers. The reverberation results favor a disk geometry, and Sections 7–10 discuss the implications of a disk geometry. Section 11 gives a brief discussion describing the jet masers associated with radio component C. Finally, we summarize our main conclusions in Section 12.
2 Observations and Data Reduction
The spectral line observations obtained at each telescope and from archival data employ different conventions for the Doppler velocity reference frame. Where relevant, we describe below the convention used for each observation. For the purposes of clarity and comparison, in the results to follow, we have converted all of the velocities to the LSR reference frame, using the optical convention for the Doppler shift.
2.1 VLA Observations
We observed the H2O masers of NGC 1068 with the VLA111The VLA is operated by the National Radio Astronomy Observatory which is operated by Associated Universities, Inc., under cooperative agreement with the National Science Foundation. in its A-configuration. The receivers were tuned to the 22 GHz (1.35 cm wavelength) maser transition of H2O with appropriate Doppler corrections. The velocity range spanned by the masers of NGC 1068 is too broad to cover completely with a single VLA bandpass, so instead we observed alternating velocities in two 12-hour tracks spanning two days (31 July 1995 and 8 Aug 1995). Specifically, the usable portion of individual scans cover a velocity range of 148.4 km s-1 with channel widths of 10.6 km s-1. Fourteen such cubes were obtained, with three channel overlaps between neighboring cubes. The resulting velocity coverage is 1660 km s-1, centered near km s-1 (heliocentric, optical convention). In addition, we observed NGC 1068 in 22 GHz continuum tuned well away from the H2O maser emission. The continuum scans were interleaved with the spectral line scans to ensure similar coverage.
Phase calibration and astrometry were based on intermittent scans of the nearby calibrator 0237027. We used the 10 mas precision coordinates from Muxlow et al. (1996). Excluding statistical and phase noise, the uncertainty in the absolute astrometric calibration is therefore mas. Amplitude and bandpass calibration were performed based on scans of the calibrator source 3C 138. This source is resolved with the VLA-A at 22 GHz, so we performed the amplitude calibration based on a CLEAN model of a VLA-A observation obtained and provided by C. P. O’Dea. The flux scaling so bootstrapped is based on the convention of Baars et al. (1977). A single iteration of phase-only self-calibration was applied to the spectral line data, selecting as a model channels containing bright maser emission, and to the line-free continuum data set.
The 22 GHz continuum was removed from the spectral line data by subtracting the Fourier-transform of a CLEAN model of the continuum data set from the spectral line visibilities (AIPS task “UVSUB”). Channel maps were then generated using conventional Fourier-transform techniques and a CLEAN deconvolution. Both naturally-weighted and uniformly-weighted channel maps were generated. The rms image noise is mJy beam-1 on uniformly weighted channel maps and mJy beam-1 on naturally weighted channel maps. These values are close to the predicted thermal noise levels and represent a factor of roughly 2.5 improvement in sensitivity over the data presented in Claussen & Lo (1986) and Gallimore et al. (1996).
Residual and systematic errors in the primary phase calibration and self-calibration solutions introduce slight offsets in the relative astrometry between individual spectral line cubes and the continuum data. We made channel maps from data sets with and without self-calibration solutions applied and compared the positions of individual maser features. The positional differences, measured as an appropriately weighted rms, are consistent with those expected given the signal-to-noise, and there is no systematic trend in the offsets between the data sets with and without self-calibration applied. Formally, we estimate a conservative (signal-to-noise limited) uncertainty of mas in the alignment between the spectral line data and the continuum data. The uncertainty in the alignment between overlapping cubes is also mas based on the positions of spectral line features detected in the overlapping channels. Judging from the good alignment of the southern maser features (Figure 5), the cube-cube alignments seem actually to be much better than these uncertainty estimates imply. For comparison, the uncertainty in relative positions in the 1983 spectral line data (Gallimore et al., 1996) is 5 mas between the spectral line cubes and the continuum image.
2.2 Effelsberg 100m Spectra
Using the Max-Planck-Institut für Radioastronomie (MPIfR) 100m radio telescope located near Effelsberg, we monitored the 22 GHz H2O maser spectrum of NGC 1068 over the period 1984–1998. Table 1 summarizes the observing dates, final spectral coverage, and channel spacing. Observations prior to 1995 focus mainly on the brighter, redshifted masers; we have included scans covering the blueshifted part of the spectrum in the later observations.
We observed scans of bright calibrators every 1–2 hours to monitor the pointing of the telescope. Typical pointing errors were between pointing checks. The beam-width (HPBW) of the Effelsberg 100m is roughly 40″, and therefore the pointing errors correspond to a signal attenuation of . We used the 18–26 GHz maser receiver, and spectra were generated in a 1024 channel autocorrelator backend. We usually employed a 50 MHz bandwidth, resulting in a channel spacing of 0.66 km s-1. We commonly experimented with autocorrelation modes during the course of a run, either to explore details of narrow emission line features or improve the signal to noise ratio of a broad emission line feature. We ultimately averaged all of the spectra observed in a given run, irrespective of the variation in channel spacing, to maximize the signal-to-noise ratio. Spectral averaging required Hanning-smoothing to the coarsest channel spacing observed in a run and interpolating the spectra to a common grid using Fast Fourier Transforms. All of the post-observation processing employed the CLASS data reduction package, developed jointly by IRAM and the Laboratoire d’Astrophysique de l’Observatoire de Grenoble (documentation is presently available at http://iram.fr/doc/doc/doc/class/class.html).
To reduce spectral baseline curvature resulting from reflections off of the secondary support structure, for example, we observed in position switching mode with a 10′ throw. This technique typically left third order polynomial residuals, which we fit and subtracted from individual on-off spectral scans, or subscans. Those subscans showing baselines poorer than third order were discarded before averaging. The sensitivity of individual subscans varies over the course of a run, owing mainly to variations in atmospheric opacity and zenith distance. We therefore chose to subtract baselines prior to averaging in order to facilitate variance weighting. Variance weighted averages properly suppress the contribution of noisier subscans and improve the signal-to-noise ratio of the final, integrated spectrum relative to an unweighted average. Because each maser spectrum was covered using two or three separate and overlapping tunings, the sensitivity varies as a function of velocity across each averaged spectrum.
We calibrated the flux scale using the standard, 22 GHz gain curve for the Effelsberg telescope:
| (1) |
where is the telescope elevation and . This formula applies for Doppler velocities km s-1. The frequency dependence of the noise diode used to establish an initial temperature scale dominates the frequency dependence of the gain curve.
We estimated the flux calibration uncertainties using two different techniques. First, we checked the solutions against continuum pointing scans of flux calibrators including NGC 7027, 3C 48, and 3C 286. The calibrator fluxes based on the Effelsberg gain curve agree with the standard values (e.g., Ott et al. 1994) to within . Second, we scaled and subtracted spectra from neighboring runs to eliminate those maser features that did not appear to vary significantly between runs. The scaling weights were always with the range 85% – 115%, corresponding to a relative flux scale uncertainty of . Based on this conservative, on-source estimate, we adopt a formal uncertainty of 15% for the flux scaling errors.
2.3 Spectra Published in the Literature
Going back to 1983, there are several observations of the H2O maser spectrum of NGC 1068 that are relevant to this study. Using the freeware utility Windig 2.5222Windig 2.5 is a Windows compatible graph digitizer written by Dominique Lovy at the University of Geneva. It is widely distributed on the internet; we obtained a copy from http://www.winsite.com., we digitized the published spectra from scanned bitmaps. The resolution of the scanned spectra is degraded slightly relative to the original spectra because of the finite spatial resolution and sampling of the scanned bitmap images. The quality of the scanned spectra suffice, however, for the measurement of spectral peaks or integrated line fluxes. Because of the limited resolution of the printed and scanned spectra, the line centroids are not sufficiently accurate to compute radial accelerations, for example (see §5 for acceleration analysis of the Effelsberg spectra).
We also digitized the velocity monitoring data of Baan & Haschick (1996) and Nakai et al. (1995). Converting their data to our adopted Doppler velocity reference frame (optical – LSR) required some care. Nakai et al. (1995) reported their data using the radio convention for Doppler velocity. Baan & Haschick (1996) reported incorrect heliocentric velocities for NGC 1068. In converting from the LSR frame, they appear to have subtracted the correction factor of 11.6 km s-1, instead of adding. We converted the velocities appropriately to match our reference frame and Doppler convention.
References for the published spectra are listed in Table 2.
2.4 The Integrated Spectrum
We averaged all of the spectra from the 1995–1998 Effelsberg observations to enhance the main spectral features and measure their recessional velocities. Figure 3 shows the averaged spectrum for the redshifted masers, and Figure 2 shows the spectrum covering the blueshifted nuclear masers, the near-systemic nuclear masers, and the jet masers. We measured the velocities of distinguishable maser features by local Gaussian decomposition. The results are summarized in Table 3.
3 VLA Imaging of the H2O Masers
Figure 5 plots the VLA, A-array positions of the nuclear maser spots as a function of channel velocity. Note that these observations poorly isolate maser features because of the coarse spatial (01) and spectral (10 km s-1) resolution of the VLA data. Nevertheless, we are able to discern the orientation of the nuclear masers to an accuracy of a few mas. The errors in the maser positions were estimated as half the beamwidth divided by the signal-to-noise ratio (e.g., Fomalont 1994); this formal error estimate is comparable to the observed spread among neighboring data points. The orientation in position angle agrees with the better-suited VLBA observations of Greenhill & Gwinn (1997), but, since the VLBA H2O maser observations are self-referenced, and the radio continuum is resolved out, absolute astrometry of the maser spots is lost in the VLBA data. The VLA data are phase-referenced against a nearby calibrator source and therefore retain absolute astrometry accurate to the uncertainty of the phase calibrator position. In addition, components NE and C are detected on the VLA channel maps, so we are therefore able to compare the positions of the masers and the continuum sources. We find that the position of the individual, systemic masers agrees with the beam-averaged position of S1 to within 5 mas. Averaging the positions over the systemic masers, the agreement is better than 3 mas. Unfortunately, radio source S1 is not resolved by the VLA beam at 22 GHz, and the relative astrometry uncertainty is the size of S1 ( mas) as it appears on VLBA images at 8.4 GHz (Gallimore, Baum, & O’Dea, 1997). We cannot bootstrap a registration between the VLBA continuum and H2O maser images well enough to discern the projected geometry. These imaging results are compatible with either a disk or outflow model for the H2O maser emission, with the near-systemic masers more nearly centered on the nuclear radio continuum source.
4 VLA Search for High Velocity Masers
We expanded the search for 22 GHz H2O maser emission to velocities km s-1 relative to the systemic velocity. The high-velocity spectrum towards component S1 is included in Figure 4. We measure no high velocity maser emission to a sensitivity level of mJy in 10.6 km s-1 channels. Nakai et al. (1995) have performed an independent search using the Nobeyama 30m and also failed to detect emission at velocities between km s-1 to km s-1 relative to the systemic velocity; based on their figures, we estimate their sensitivity was mJy in 0.3 km s-1 channels.
For comparison, the H2O spectrum of NGC 4258 shows high velocity, or “satellite,” maser features out to km s-1 (Nakai, Inoue, & Miyoshi, 1993). Measured on a linear (non-angular) scale, the maser distribution of NGC 1068 is larger than the maser disk of NGC 4258 (Greenhill & Gwinn, 1997). The lack of high velocity emission beyond km s-1 relative to systemic is consistent with the larger size of the maser distribution if the masers occupy a rotating annulus surrounding a central mass, roughly 1/3 the central mass of NGC 4258 (Miyoshi et al., 1995).
If X-rays power the nuclear masers, the extent of the maser disk is determined by the luminosity of the central engine and pressure in the disk (Neufeld, Maloney, & Conger 1994; Maloney, Hollenbach, & Tielens 1996). Assuming that the temperatures in the two maser disks are about the same, as is required by the model to support a large H2O abundance, the pressures in the maser region scale as . Based on X-ray observations and models for electron scattering mirrors, as summarized in Murayama & Taniguchi (1997), the AGN of NGC 1068 is probably about two orders of magnitude more luminous than that of NGC 4258. Including the result that the maser distribution is four times larger in NGC 1068, the gas pressure in the maser disk of NGC 1068 is estimated to be about 40% greater than the pressure in the maser disk of NGC 4258. We conclude that the X-ray heating model is at least compatible with the scaling of the maser disks in that it implies similar conditions both in NGC 1068 and NGC 4258.
5 Search for Radial Accelerations
Baan & Haschick (1996) found that the redshifted masers appeared to drift towards higher velocities at a rate of km s-1 year-1. In contrast, a rotating disk model would predict no measurable acceleration of the redshifted masers, since the direction of the centripetal acceleration at the kinematic line of nodes is parallel to the plane of the sky. Radial accelerations should be present only among the systemic velocity masers, where the centripetal acceleration vector lies along the line-of-sight. Taking pc and km s-1 (Greenhill & Gwinn, 1997), the maximum centripetal acceleration should be km s-1 year-1, observable only in the near-systemic masers.
Our Effelsberg monitoring spectra span 14 years. If the very high accelerations measured by Baan & Haschick (1996) are correct, we should measure a dramatic 14 km s-1 drift of the redshifted maser features over this time period. To measure the centroid velocities of the red maser features, we decomposed the maser spectra into Gaussians allowing the amplitude, width, and centroid velocity to vary freely. The properties of the integrated spectrum were used for the initial guesses. Figure 6 plots the fitted centroid velocities vs. time. The Gaussian fitting technique breaks down in the spectrally crowded region near 1430 km s-1 where brightness variations of the overlapping lines affects the centroid fit. Gaussian fitting performed well for the bright and relatively isolated 1411 km s-1 line and other isolated lines, and there is no evidence for radial acceleration over the course of these observations.
We have included in Figure 6 the data of Baan & Haschick (1996) and Nakai et al. (1995). These data span the gap in our monitoring: the years 1986 – 1994. Nakai et al. (1995) reported a brief monitoring run in 1992, and the data do not agree with the contemporaneous observations of Baan & Haschick (1996). Instead, their velocities agree very well with ours over the bracketing time periods. The nature of the discrepancy with Baan & Haschick (1996) is not clear. One possibility may be line blending, for example, between the 1411 km s-1 line and the 1425 km s-1 line. This possibility does not seem likely, because their average spectrum appears to resolve that particular blend well. Moreover, line blending cannot account for the apparent acceleration of the 1453 km s-1 line. It is possible that the 36.6m Haystack antenna was not sensitive enough to obtain data with sufficient signal-to-noise ratios. Given the excellent agreement between our data and the data of Nakai et al. (1995), only these results were used to calculate velocity drifts.
To measure or constrain the radial acceleration of the red masers, we performed a least-squares, multi-line fit to the centroid velocity vs. time data. Maser lines were identified with features in the integrated spectrum based on proximity in velocity. Transient maser lines with ambiguous velocity identification were ignored during the fitting procedure. All fitted lines were constrained to have the same acceleration. The best fit is consistent with no acceleration, and the three-sigma upper limit on the magnitude of the acceleration is 0.006 km s-1 year-1. We rule out accelerations as large as 1 km s-1 year-1 as reported by Baan & Haschick (1996).
The low upper limit on the acceleration of the redshifted masers favors the rotating disk model and limits the geometry and kinematics of the masers. The position-velocity curve (Greenhill & Gwinn 1997) also favors a rotating annulus geometry. The question is how closely the high-velocity masers (those on the falling part of the rotation curve) are located to the line-of-nodes. For the sake of simplicity, if we assume circular symmetry and an edge-on viewing angle, the apparent acceleration is related to the true centripetal acceleration by
| (2) |
where is the angle between the kinematic line-of-nodes and the radius vector to the location of the red masers within the annulus. Resolving , and accounting for a projection of the radius vector, the constraint on is then
| (3) | |||||
| (4) |
where is the apparent radial velocity and is the projected radius of the maser features. The normalization of and is based on the disk model described by Greenhill & Gwinn (1997).
Unfortunately, there are insufficient data to search for accelerations of the blue masers; see Figure 7. The prediction remains that the near-systemic masers should show a drift of km s-1 yr-1 if the rotating disk model is correct. We therefore searched for accelerations of the near-systemic masers based on our current monitoring epochs and Effelsberg data taken over 1984–1985. Among these earlier observations, we found one 1985 observation that detected the near-systemic masers. Figure 8 plots the velocity of the near-systemic peak of the 1985 spectrum in reference to the data from the 1995–1998 campaign. From inspection of this diagram, looking particularly at the more recent data, it is clear that the larger velocity changes are not due to centripetal acceleration. We know from the VLBA observations of Greenhill & Gwinn (1997) that the broad systemic maser line decomposes into a number of narrower line features and spatially distinct maser spots. It seems that each of these spots can vary in brightness more or less independently, and, as a result, the peak of the integrated line profile shifts back and forth in velocity. In other words, a given near-systemic maser spot may be brighter than its neighbors for a period of no more than a few months. Otherwise, lacking observations between 1986 and 1984, there is no discernable trend in the near-systemic velocities that would indicate acceleration. On the other hand, we also cannot rule out acceleration of the near-systemic masers with the present data.
6 Evidence for Reverberation
6.1 Motivation
Claussen & Lo (1986) pointed out that the entire maser spectrum of NGC 1068 faded between 1983 and 1984, and they originally argued that the masers were responding to a common maser pump source whose efficiency was also fading during that time. Neufeld et al. (1994) have since argued that X-rays produced by the central AGN might provide the energy for a maser pump (see also Watson & Wallin 1997). X-ray heating produces an extended region of warm dust at a few hundred degrees K. These temperatures favor gas phase H2O production, and the H2O abundance is raised. The H2O molecules receive pump energy from excited H2 molecules by collision. Variations of the maser luminosities might therefore result, in part, from variations of the central X-ray source, akin to the reverberation of broad optical line emission in active galaxies (e.g., Netzer & Peterson 1997). This scenario might be complicated, however, by local effects, such as shock heating or chance cloud alignments (e.g., Watson & Wallin 1994; Maoz & McKee 1998). Such local effects might be unrelated to variations of the central pump source, effectively adding noise to any reverberation signal.
In analyzing VLA observations of the H2O masers of NGC 1068 (Gallimore et al., 1996) and the new VLA observations presented here, we noticed that the trend originally suggested by Claussen & Lo (1986) continued between 1983 and 1995; that is, the blue, near-systemic, and red masers appeared to brighten and dim coherently as measured on time scales of years. The dynamical time between the blue and red masers is years, but the light travel time is only years between the central engine and the maser spots. It is plausible that we are witnessing variations of the maser brightnesses in reverberation to variations of the central, obscured AGN.
This reverberation model makes simple predictions depending on the geometry of the maser sources. If, as is commonly thought and supported here, the geometry is a uniformly rotating disk, the near-systemic masers should trace gas along our sight-line to the AGN, and the red and blue masers should trace warm molecular gas along the forward quadrants of the disk and along the line-of-nodes, or disk “midline;” see Figure 9 for illustration. The reasons for placing the high velocity masers along the disk midline are because (1) the projected velocity profile falls with radius for these masers, (2) the longest velocity-coherent optical paths occur at the disk midline, and (3) we measure no significant (projected) radial acceleration of these masers, implying that the high velocity masers lie within of the kinematic line of nodes (Section 5). The high velocity masers along the line of nodes are roughly 0.6 pc more distant than the near-systemic masers. Variations of the blue and red masers should be nearly simultaneous but should lag behind varations of the near-systemic masers by years.
For a bipolar outflow geometry, the prediction is that the blue and near-systemic masers should vary nearly simultaneously, but the red masers should lag behind. The time lag for the outflow geometry is not predictable since the orientation of the outflow relative to the sight-line is unknown. If the outflow is symmetric about the central source, the time lag would measure the orientation. The absence of any obvious lags on year time scales then argues that the angle between the polar axis and the line-of-sight should be greater than (i.e., more nearly in the plane of the sky).
Evidence for reverberation would support the idea that the AGN powers the H2O masers, perhaps, as suggested above, indirectly via X-ray heating (Neufeld, Maloney, & Conger, 1994). Another conceivable power source might be AGN-driven explosions and subsequent blast waves that heat the molecular medium through shocks (e.g., Elitzur, Hollenbach, & McKee 1989). Reverberation imaging offers a means of measuring the geometry of the nuclear H2O maser source and a geometric estimate of the distance to NGC 1068. Testing the reverberation model is challenging because the nuclear masers spread over a distance of several light-years. Compared with BLR reverberation, therefore, time lags within the H2O maser spectrum may be observationally expensive to track, requiring years of regular monitoring. It may also be difficult to distinguish locally generated maser flares from reverberation events.
6.2 Analysis
One important concern for reverberation analysis is the uniformity of the flux calibrations among the monitoring spectra. For example, it may be that the masers appear to vary coherently because systematic errors in the flux scale artificially brighten or dim all of the maser features simultaneously. Accurate flux calibration is challenging at 22 GHz owing to variations in atmospheric opacity and pointing errors, and, since the original goals of the observations were different from the goals of this study, no additional effort was made to ensure a stable flux scale.
We cannot improve upon the () accuracy of the relative flux scale for which errors. We can instead use the jet masers as a control to check whether errors in the flux scale might give rise to the apparent coherence of the nuclear maser variations. The jet masers are located pc away from the red, blue, and near-systemic masers associated with the nucleus. Even if the jet masers were powered by the same pump as the nuclear masers, the time lag would be on the order of a century. It seems more likely, however, that the jet masers are powered independently by shocks (Gallimore et al., 1996). Since the data span only years, we yet lack sufficient information to address coherence between the jet and nuclear masers. Any apparent coherence between the jet masers and the nuclear masers would therefore result from errors in the flux scale.
Unfortunately there are yet insufficient data to perform a cross-correlation analysis as is traditionally applied to reverberation data. Instead, we explored the temporal coherence of the nuclear masers both by (1) qualitatively comparing the time variations of the nuclear and jet masers and (2) evaluating the correlation of the measured peak fluxes and luminosities of the masers. For each of the correlation tests we chose the red nuclear masers as the reference because they are the brightest masers and because they were always observed throughout the monitoring program.
The reason for distinguishing between the peaks and total luminosities in the correlation tests is because the profiles of the red, systemic, and blue maser emission profiles decompose into many narrow, spatially distinct emission features. We do not know a priori how the timescale for variability of the maser pump source, , compares to the timescale for propagation of the pump signal through the maser clouds, . If , then variations in the maser response will be radially localized, and reverberation will appear more clearly in the variation of the maser line peaks. On the other hand, if , variations of the maser response will be more nearly uniform across the maser clouds, and evidence for reverberation may also appear in the variation of the integrated luminosities.
Looking first at the time variations, Figure 10 compares the variability of the luminosities of the nuclear masers and the jet masers as a function of time. Figure 11 plots the flux densities of the peak maser emission as a function of time. In both figures the luminosities and fluxes were normalized to their mean over the observing period better to compare with the variations of the red masers, which are a factor of ten or so brighter than the other maser groups. In the comparison of the maser line peaks, the maser spectra were smoothed to the lowest common resolution of all of the observations, or 10 km s-1 (the spectral resolution of the VLA data).
The maser luminosities vary by factors of three or so over the monitoring period. It is clear that all of the masers, including the jet masers, vary more widely than would be allowed for systematic errors in the flux calibration. There appear flux variations at least as rapid as the shortest time sampling, or roughly two weeks. Figures 10 and 11 qualitatively demonstrate that the jet masers vary independently of the nuclear masers. Note that the reported luminosities were computed assuming isotropic emission. In particular, the jet masers show jumps in luminosity over the observing period 1992–1996 that are not in proportion to the light curves of the nuclear masers. Looking at the broader trend, the peak of the jet maser emission dims over 1990 – 1998; this trend is not present in the light curves of the nuclear maser peaks. There appears to be no strong bias introduced by errors in the flux calibration.
Next, to assess the coherence of the nuclear maser variability more quantitatively, we measured correlations between the near-systemic, blue, and jet maser fluxes with the red maser fluxes. The reverberation model predicts that the peak fluxes and luminosities of the nuclear masers should correlate (i.e., the blue masers are brighter when the red masers are brighter), but the jet masers should not correlate with the nuclear masers. Figure 12 compares the integrated luminosities, and Figure 13 compares the peak maser flux densities. (Note that the reported luminosities were computed assuming isotropic emission.) To test for correlation, we computed Pearson’s linear correlation coefficient, Spearman’s rank correlation coefficient, Cox’s proportional hazard model, and Kendall’s generalized to measure the correlations between these flux measurements. The latter two statistics properly account for the two upper limits (e.g., Isobe, Feigelson, & Nelson 1986), but these upper limits were ignored in deriving the former two statistics. Table 4 lists the correlation statistics for the peak-peak and luminosity-luminosity comparisons.
Table 4 reports two significance levels. The first is the formal probability that the measured correlations could have occurred by chance (i.e., a low probability argues in favor of a real correlation). As a check, we also performed Monte Carlo simulations to estimate the significance level. The Monte Carlo simulations involved generating artificial observations by randomly varying the fluxes or luminosities assuming a Gaussian distribution of errors. To remove any true correlations in the data, we also scrambled the order of the simulated observations relative to each other. For example, the blue masers would have been randomly reordered relative to the red masers to remove the apparent correlation between their fluxes and luminosities. We then repeated the computation of the statistics for simulated observations and counted the fraction whose correlation coefficients met or exceeded the those measured for the real observations. The large number of Monte Carlo trials was intended mainly to sample the measurement errors. Note that the so-derived probabilities of chance correlation are overestimated because an occasional trial may not have sufficiently removed real correlations in the data. Nevertheless, the Monte Carlo significance levels compare well with the formal significance levels, and therefore the correlation statistics are robust even though the sample numbers are small and the measurement errors are occasionally large.
We measure significant (better than ) correlation only between the blue and red nuclear masers, although the Monte Carlo statistics for the Pearson statistic give a probability of no correlation. The significance of correlation between the near-systemic and red masers is only – . As we would predict based on the qualitative comparison, the jet masers show no correlation with the red nuclear masers in any test, and we conclude that systematic errors in the flux scale have not caused the measured correlations between the nuclear maser groups.
The nuclear masers show coherent variations on timescales shorter than the length of the monitoring period (Figure 11). We also conclude, therefore, that the measured correlations do not result solely from undersampling of long-term trends, i.e., variability trends longer than the monitoring period. That we measure trends both in the peak fluxes and total luminosities of the nuclear masers suggests that , or, that the pump signal propagates through clouds faster than the variation time-scale of the central pump source, as argued above. The light travel time through the maser annulus is years, and so it appears that the time scale for variations of the central pump source is typically longer.
In summary, the measured correlations are in accord with the predictions of the reverberation model. These results cannot, however, distinguish between the disk and outflow models, since the time sampling was usually coarser than 2 years, the predicted light-diameter in the disk model, throughout the monitoring period. We next consider a single, short flare event of the red and blue nuclear masers that favors the disk model.
6.3 The 1997 H2O Maser Flare
Over 3 – 4 Nov. 1997, we detected a flare of mJy in the blue masers at 859 km s-1. For comparison, the average peak flux density of the blue masers in recent measurements has been mJy. Figure 14 plots the history of this flare between Oct. 1997 and Feb. 1998. There also appears a corresponding flare of the 1411 km s-1 maser, although it is more difficult to see because of confusion with neighboring maser emission. We enhanced the flare spectra by taking difference spectra between successive observing epochs. Figure 15 plots the difference spectra between Oct. 1997 and Feb. 1998. The central (mean) velocity of the flares is km s-1 (corresponding to a heliocentric velocity km s-1), consistent with the systemic velocity of the host galaxy based on H i imaging studies (Brinks et al., 1997). Another flare appears at 1376 km s-1 in the 3 Jan. 1998 spectra, but there is no clear connection between this event and the Nov. 1997 flares.
The reverberation model predicts simultaneous red and blue flares if the geometry is a rotating disk, but blue flares should precede red flares in an outflow geometry. Alternatively, the observed red and blue flares may be responses to independent flares of the pump source. For example, the red flare may be responding to an earlier flare of the pump source, and the blue flare may be responding to a later flare of the pump source. An outflow geometry would require that the pump source flares are separated by a time interval that matches the light travel time along the line-of-sight between the red and blue maser sources. Since the pump source should have no knowledge of maser clouds’ orientation relative to our sight-line, the observed simultaneous flares would have to be coincidental, but we cannot rule out this possibility on the strength of a single flare event. The rotating disk model remains, nevertheless, the simpler explanation, because the simultaneity of the flares is explained only by geometry and requires no coincidental timing of the maser pump and light-travel delay. We conclude that the data favor the rotating disk model for the H2O maser disk geometry.
7 The Predicted Behavior of Nuclear Maser Flares: Towards a Geometric Distance Estimate
Based on the evidence and arguments presented above, our favored model for the variations of the nuclear masers is a rotating annulus responding in reverberation to a common, central pump source, probably the central engine. Figure 9 depicts the model geometry for the nuclear masers based on the VLBA observations of Greenhill & Gwinn (1997). We next consider some implications and predictions based on this model and models for the pump source. For brevity and the purpose of the discussion, we assume the disk model to be correct.
Looking first at the VLBA imaging results of Greenhill & Gwinn (1997), the masers are distributed more or less in a straight line on the sky, running blue–systemic–red from southeast–northwest (cf. Figures 5 and 9). There is a gap between the blue and systemic masers, but faint maser emission fills the region between the brighter systemic and red maser emission. In projection, the Doppler velocities rise linearly with angular separation between the systemic and red masers. The velocity curve turns over beyond mas from the systemic maser peak. This region of the velocity curve is compatible with the kinematics of a rotating annulus, in which the linear part of the velocity curve traces masers at a (nearly) common radius. The falling part of the velocity curve traces masers distributed along the disk line-of-nodes, i.e., nearly parallel with the sky plane and spanning increasing radii. We refer to masers on the rising part of the rotation curve as the “edge masers,” and masers on the falling part are called the “midline masers.”
The implication is that the edge masers span nearly a quarter of the rotating annulus (note that Figure 9 plots only the brightest maser features from the integrated spectrum; see Greenhill & Gwinn 1997 for a plot of all of the maser spots). We assume these masers trace the forward (i.e., nearer) quadrant, since free-free absorption may attenuate H2O maser emission on the far side (e.g., Krolik & Lepp 1989; Neufeld et al. 1994; Gallimore et al. 1997). One prediction of the reverberation model, therefore, is that maser flares should appear to accelerate, starting in the systemic masers and proceeding through the peak of the red masers, as we receive the response of the edge masers at increasing distances. This apparent acceleration is due solely to time-lag geometry, and the mean apparent acceleration should be very rapid, km s-1 year-1. Assuming an edge-on disk and carrying out the time-lag geometry, the velocity of flares along the inner edge of the disk as a function of time-delay is given by:
| (5) |
where is the systemic velocity, is the rotation velocity of the annulus, and is the radius of the annulus. A sum is taken for the redshifted masers, and a difference is taken for the blueshifted masers. The lag time is normalized to zero for the response of the near-systemic masers.
After this apparent acceleration event, there should be an apparent deceleration event as the midline masers respond in succession. After the edge masers have flared, the time delay is no longer due to the increasing distance of the masers from us, since the midline masers are assumed all to be at roughly the same distance. Instead, the time delay is due to the increasing distances of the midline masers from the central engine. Again assuming an edge-on disk, and further accounting for the propagation of signal along the line-of-nodes, the response of maser emission along the line-of-nodes should follow:
| (6) |
where all variables are defined above, except , which is the ratio of the propagation speed of the pump signal to the speed of light, and , which is the power law index for the position-velocity curve: ; for a Keplerian disk.
Figure 16 plots the flare velocity as a function of time-delay, or velocity-delays curve, appropriate for NGC 1068 based on the analysis above. In constructing this plot, we assumed and , but these quantities remain to be measured.
7.1 Deriving a Geometric Distance from a Single Flare Event
The velocity-delays curve () is sensitive to the assumed distance to NGC 1068. To illustrate, the dotted lines in Figure 16 trace the velocity-delays curve for distances of 12.7 Mpc and 18 Mpc. The delays curve effectively measures the physical radius of the annulus, and VLBI measurements provide the angular radius. Tracing the full velocity-delays curve for a single flare event may therefore provide a geometric distance measure to NGC 1068. The main uncertainty, as with all such techniques, would be the geometry of the maser sources. For example, the assumption of circular symmetry also factors into the geometric distance estimate to the H2O masers of NGC 4258 (Herrnstein et al., 1999).
Using reverberation to measure the distance to NGC 1068 offers an advantage over the use of centripetal accelerations or proper motions because, firstly, the systemic masers are faint, requiring long integration times to measure velocity drifts or proper motion. Secondly, the maser disk of NGC 1068 is large compared to the disk of NGC 4258, and so the centripetal accelerations and proper motions are predicted to be correspondingly smaller than found in NGC 4258.
Once a flare of the near-systemic masers is discovered, it would suffice to observe the spectrum at month intervals of years to trace out the velocity-delays curve accurately. One caveat is that the difference spectra might be contaminated by flares unrelated to the reverberation mechanism; such flares might result from, e.g., inhomogeneities in the maser clouds, chance cloud alignments, or local excitation effects such as shocks. In addition, a careful measurement would initially require frequent observations to improve estimates of the predicted delays and durations of the reverberating flares. The procedure would be iterative, with initial observations providing an estimate of the distance, from which one could predict more precisely the delay to the next flare, and so on, ultimately to reduce the observational expense of the later observations.
The November 1997 flare occurred among the midline masers at 859 km s-1 and 1411 km s-1, and therefore we may find later reverberations among the midline masers over the following 90 days (assuming a distance of 14.4 Mpc). Specifically, we would have expected flares at 1408 km s-1 around 2 December 1997; 1404 km s-1 around 5 January 1998; and 1395 km s-1 around 27 January 1998. Our only near-overlap is the 3 January 1998 observation that should have detected a flare of the 1404 km s-1 maser. That we did not detect the flare does not rule out the reverberation model; it may be that the flare duration was shorter than a day, or, more likely, that the distance to NGC 1068 is not exactly 14.4 Mpc. Although there appear weaker flares at 1376 km s-1 on 3 Jan 1998 and 1425 km s-1 on 31 Jan 1998 (Figure 15), they fall outside the reverberation time window and are probably unrelated to the simultaneous flare event of 3 Nov 1997.
8 The Symmetry of the Maser Disk
Returning to the 1997 H2O maser flare, it is somewhat surprising that the blue and red flares appeared simultaneously. We would have expected some asymmetry to the disk resulting in a corresponding lag between the maser flares. We can use the simultaneity of the flares and limits on the flare duration to constrain the symmetry of the disk. No flares appeared on the Oct. 12 spectrum, 22 days before the flare detection, and no flares appeared on the Jan. 3 spectrum, 60 days following the the flare detection. The maximum duration for the flare is therefore 82 days. Supposing, without loss of generality, that the red masers were fading just as the blue masers were brightening, and further assuming that the red and blue masers flared for the same duration, the maximum delay between the red and blue flares is 22 days. The fractional deviation in the disk radius to the blue and red masers is the ratio of the lag between the maser flares ( days) to the travel time of the pump signal.
If X-ray heating provides the pump energy, the signal travel time to the 1411 km s-1 maser is years. Between the 1411 and 859 km s-1 masers, the maser disk would deviate no more than . Factoring in the uncertainty in the systemic velocity, we find that the radial deviation is . Note that this is a robust upper limit, because a slower pump signal, such as a blast wave might provide, would require a greater degree of symmetry. For example, a 1000 km s-1 blast wave would require radial deviations (not accounting for the uncertainty in the systemic velocity). It is hard to imagine a parsec-scale disk to be so symmetric; we favor the X-ray heating model mainly because it places the most relaxed limits on the symmetry of the disk.
9 The Case for Dust Reverberation
Optically thick, hot dust at K, probably located near the nuclear maser region (e.g., Neufeld & Maloney 1995), is thought to be a significant source of near-infrared continuum emission from the nucleus of NGC 1068 (e.g., Pier & Krolik 1993). Supporting this picture, the upper limit on the size of the nuclear near-infrared source is pc, based on speckle imaging with the Keck telescope (Weinberger, Neugebauer, & Matthews, 1999). This upper limit is comparable to the size of the H2O maser emission and radio continuum emission thought to arise from the warm region of the obscuring disk (Gallimore et al. 1997). Since the dust and masers appear to be nearly co-spatial, then, if the H2O masers disappeared as the result of a flare of the bolometric luminosity of the central engine, the prediction is that near-infrared emission should show a nearly contemporaneous brightening as the dust temperature rises in response to the same flare (Neufeld, 2000).
9.1 Variability of the Near-Infrared Continuum
Glass (1997) has monitored the variability of NGC 1068 in near-infrared bands over a period spanning the H2O monitoring experiment of Baan & Haschick (1996) and the new Effelsberg observations presented here. Figure 17 compares the variability of the K-band (2.2µm) continuum emission with the variability of the 1411 km s-1 midline maser. Relevant to this line of argument, Glass (1997) originally suggested that the near-infrared light-curve might follow the response of near-nuclear dust to a steady increase in the UV–X-ray luminosity of the central engine. For comparison, evidence for the response, or reverberation, of near-nuclear dust to variations in the UV luminosity of the central engine has been observed in other Seyfert galaxies, such as Fairall 9 (Clavel, Wamsteker, & Glass 1989; Barvainis 1992) and Mrk 744 (Nelson 1996), among others. In contrast, we cannot see the central engine of NGC 1068 directly, and so we cannot directly compare the light-curves of the near-IR emission and maser emission with the light-curve of the central engine. The challenge, then, is to find a model that can reproduce the maser and near-IR variability and make predictions for other observable effects resulting from the variability of the hidden central engine.
Examining Figure 17, the 2.2µm luminosity of NGC 1068 has been increasing steadily since 1976, peaking around 1994–1995, and showing a decline from 1995–1998. Looking at the broader trend, the 1411 km s-1 maser dims until its disappearance in 1990 and brightens after its reappearance in 1991. The only possibility to consider is whether the peak of the infrared light curve corresponds to the loss of maser signal in 1990. The implied time-lag between observed events is years.
The predicted time lag between the response of the masers and the near-IR continuum depends on the orientation of the obscuring disk and optical depth effects. For example, if the obscuring disk is optically thin at near-infrared wavelengths, then an initial peak of the near-infrared continuum should have preceded the loss of midline maser signal by years. There is no evidence for a peak of the 2.2µm light-curve over that time period (around 1987), and so we rule out this possibility. Instead, the interesting case to consider is whether the disk is optically thick to near-IR radiation, so that the near side of the hot dust region is obscured by cooler dust in the foreground; see Figure 18 for illustration. There would be an unattenuated sight-line only to the far edge of the maser disk, and the 2.2µm peak should lag behind the loss of maser signal. In this optically-thick model, the lag time will also depend on the inner radius of the hot dust region, which can itself depend on variations of the central X-ray luminosity.
9.2 A Model for the Near-Infrared Variability
To test the plausibility of this scenario, we constructed a numerical model to calculate the observed near-IR light curve from an inclined, optically thick torus. We assumed that the inner edge (or surface) of the disk was fixed by the sublimation temperature of dust grains (similar to the “reformation” models used by Barvainis 1992 and Nelson 1996). As the X-ray luminosity of the central engine rises, the local dust temperature rises. Grains are heated above the sublimation temperature, rapidly evaporate, and the inner edge of the disk moves outward. Because grains do not exceed the sublimation temperature, the emissivity of the inner edge of the disk remains constant. However, the total near-IR luminosity rises because, as the inner edge of the disk moves outwards, the total exposed surface area of the far side of the disk increases. This model also requires that grain reformation is rapid after the ionizing flux wanes in order to restore the conditions necessary to generate masers. For reference, the conditions of H2O maser clouds ( cm-3 and few hundred K; e.g., Reid & Moran 1988; Neufeld et al. 1994) compares to the conditions under which grains form in classical nova shells (e.g., Ney & Hatfield 1978). The timescale for grain formation in novae is – 3 months (e.g., Bode 1988 and references therein), which is short relative to the slow variability of the near-infrared light curve of NGC 1068.
We computed the time lag of emission from a region of the disk according to
| (7) |
where is the separation between the central engine and the disk region, is the distance of the disk region from us, and is the speed of light. We did not account a delay for grain evaporation, because the evaporation time-scale is much shorter than the observed near-IR variability (Voit, 1991); in other words, the response of the inner edge of the disk to changes in the luminosity of the central engine was taken to be immediate. Based on the observed separation between the masers and the central engine, the disappearance of the red masers over 1990 – 1991 predicts that the peak of the central engine light curve should have occurred around the decimal calendar date 1987.9. The time of the peak of the flare was therefore fixed to that date. We assumed a gaussian profile for the temporal shape of the central flare. We also adopted the nuclear spectrum derived by Pier et al. (1994) and, for simplicity, assumed that the spectral shape was preserved during the flare.
For the purposes of this model, the geometry of the obscuring disk was taken to be a cylindrical annulus with uniform gas density. The gas composition is probably clumpy, and the masers probably reside in particularly dense clouds within the dusty medium. The densities that go into the model are therefore effectively averages weighted by emissivity and opacity. We used the code DUSTY (Nenkova, Ivezic, & Elitzur, 1999) to estimate the dust temperature as a function of opacity into the model disk. To account for different sublimation temperatures, we ran a grid of models varying the dust temperature of the inner edge of the annular disk. The distribution of dust grains was taken to be the standard, galactic distribution (Mathis, Rumpl, & Nordsieck, 1977), which is approximated within DUSTY by single-sized grains with suitably weighted average properties. In principle, the inner edge of the disk should have a stratified composition owing to the dependence of the sublimation temperature on grain composition (Salpeter, 1977), but accounting for the stratification is computationally expensive. Instead, we assumed a uniform composition and, in preliminary models, fit the observed near-IR data for the effective dust temperature at the inner edge. We found that K produced the best fits to the data, and we fixed this value for subsequent runs of the fitting program. This effective sublimation temperature is reasonable given that composition dependent sublimation temperatures are estimated to be in the range 1000 – 2000 K (Salpeter, 1977).
To compute the model infrared light-curve, our code numerically integrated the radiative transfer equation along sight-lines through the inclined model disk, again properly accounting for the light travel-time from the central engine, to the disk region, and then to the observer. The integrated near-IR flux was computed at each observation date of Glass (1997) and compared to the measured near-IR flux. Starlight contributes significantly to the J-band (1.2µm) and H-band (1.6µm) fluxes, and colder dust contributes to the L-band (3.3µm) fluxes. Because the contribution of starlight and cold dust to these bands is not currently known, we chose only to fit the K-band (2.2µm) fluxes.
Based on their speckle observations, Weinberger et al. (1999) decomposed the nuclear K-band emission into three components: starlight, which makes up about 600 mJy within a 12″ aperture; a nuclear point source, presumably the nuclear disk, which at the time of their observations (1995) made up about 275 mJy; and an extended source, oriented roughly in the direction of the radio jet, with a flux density of about 275 mJy. Their 12″ aperture flux agrees well with the measurements of Glass (1997) observed near the same epoch (Fig 17). However, both the infrared light-curve and HST/NICMOS observations may be at odds with this speckle imaging result. Looking first at the light curve, in 1976 the starlight-subtracted K-band flux density was about 180 mJy, and the peak in 1994 was mJy(Glass, 1997). Weinberger et al. (1999) made their measurements near the peak of the near-infrared light curves, and so the nuclear point source can account for no more than mJy of variability. The remaining 245 mJy worth of variability would have to arise from the extended K-band source. The size of the extended source is however LY, and it would be impossible to reconcile such variability over a period of 18 years. To examine further the reality of the extended 2.2µm source, we are currently analyzing archival HST/NICMOS images of the nucleus of NGC 1068. Within the central 3″, the NICMOS data are compatible with a smooth stellar background and a nuclear source smaller than 01. Any additional, extended flux must be weaker than of the point source flux (Gallimore & Matthews, in preparation).
Accepting that the detailed structure of the near-IR source is uncertain, we instead modeled the K-band light-curve as comprising two components: 600 mJy from starlight (or other extended, non-varying background) and the remainder from a parsec-scale nuclear disk. We fit our model light curves to Glass’ data using an iterative simplex algorithm to minimize (e.g., Press et al. 1992). The results are displayed in Figure 19, and the best fit parameters for the model are listed in Table 5. Accepting that the model oversimplifies the geometry of the disk and the shape of the X-ray flare, the fit is good: with 20 degrees of freedom, and the model reasonably reproduces the shape of the light curve.
We estimated the statistical uncertainties of the fit by exploring the values as a function of the parameters taken at intermediate iterations of the simplex algorithm. Because this method only samples the values traced by the converging simplex, the statistical uncertainties reported in Table 5 are biased but probably of the right order of magnitude. The systematic errors are, of course, much greater than the statistical uncertainties. We repeated the fitting procedure, taking into account the following sources of systematic error: (1) choice of integration algorithm for the radiative transfer equation, (2) the response of the simplex to initial guesses for the parameters; (3) the assumed shape of the flare profile; (4) the assumed contribution of starlight; (5) the assumed disk scale height; and (6) the spatial resolution of the integration grid. For variations of the flare profile, we considered three additional profile shapes: tophat, sawtooth, and sawtooth plus step (the latter allowing for an overall change in the luminosity after the flare). The corresponding variations are reported as systematic errors in Table 5. Note that we have by no means exhausted uncertainties owing to model assumptions: other sources of systematic error include, for example, the assumption of constant density and strict cylindrical geometry. Our integration algorithm depends on shortcuts derived from these assumptions, however, and so it was not practical to test these sources of error.
To fit both (1) the four-year lag between the loss of maser signal and the peak of the near-IR light-curve and (2) the change in the infrared luminosity, we find that the central engine flared for years duration (FWHM), peaking at nearly five times the initial luminosity. These parameters result in a plausible and self-consistent model connecting a (hidden) flare of the bolometric luminosity of the central engine, the loss of maser signal in 1990 (based on the model of Neufeld 2000), and the near-IR light curve, which peaks in late 1994. However, the monitoring data span a period of time that is not much greater than the year duration of the flare. Based on the strength of only a single maser – near-IR event, we cannot rule out coincidence. It may take decades of additional monitoring to find another near-IR reverberation event as a test of this model.
10 Other Observable Effects of the Reverberation Model
Looking for other effects of a flare of the X-ray or bolometric luminosity, one might also expect a brightening of the observable cooling lines (e.g., [O iii]) of the narrow line region (NLR). Based on the radio-optical registration of MERLIN and Hubble Space Telescope images (e.g., Gallimore, Baum, & O’Dea 1996; Capetti, Macchetto, & Lattanzi 1997; Kishimoto 1999), the central ten parsecs of the NLR appear to be obscured by foreground dust. As a result, the response of the NLR to the postulated X-ray flare may not yet be apparent, and it will be difficult to disentangle the delays.
Exploring the variations of the obscured central engine will also be difficult. The electron scattering “mirror” is located, in projection, pc away from the location of the nuclear masers. Although the response may be somewhat diluted by the extent of the scattering medium, the prediction is a time-lagged flare in the directly detectable X-ray emission, perhaps some 60 years hence.
11 Comments on the Origin of the Jet Masers
Although the jet masers are not the focus of the present work, we digress to note that they are also variable over the period of this monitoring experiment. The variability is not so remarkable, in the sense that maser emission associated with molecular outflows from young stellar objects (YSOs) may vary by two orders of magnitude, or disappear entirely, on timescales of months (e.g., Claussen et al. 1996). The comparison stops there, because the outflow velocity of the jet of NGC 1068 is probably km s-1 (Gallimore, Baum, & O’Dea, 1996), whereas the outflow velocities of YSOs probably do not exceed a few tens of km s-1 (e.g., Richer et al. 1999). Models for H2O maser generation, whether by X-ray heating or shocks, generally require the survival of catalytic dust grains (e.g., Elitzur, Hollenbach, & McKee 1989; Neufeld, Maloney, & Conger 1994). Gas temperatures may elevate to a few hundred K at which the gas phase production of H2O is enhanced. The concern for jet-induced masers is that dust grains do not survive shocks faster than km s-1 (e.g., Jones et al. 1994).
An alternative explanation for the variability is that the jet masers amplify variable radio continuum emission from component C . This model does not require that the molecular gas is physically associated with the radio jet. One strike against this model is that there is no evidence for variability of the radio continuum emission from component C, based on Gallimore et al. (1996) and our own, unpublished MERLIN, VLA, and VLBA observations. Our limit on the variability of component C is . For comparison, the jet masers vary by roughly a factor of two. Therefore, the jet masers would have to be amplifying the radio continuum by a factor to accomodate the small continuum variations.
We can use this amplification limit to constrain the covering fraction of maser clouds against component C. The typical peak maser flux density is mJy, and these masers amplify a continuum signal mJy. Adopting an amplification of , then . Owing to the low variability of the continuum source, the background amplification model would require compact maser clouds. We cannot rule out this model based on the present data, but we do not favor it on the grounds that it does not explain how the masers are pumped, or why they should occur coincidentally in front of a bright continuum source offset from the nucleus.
We propose an alternative scenario in which the masers occur in a warm, molecular precursor region heated by radiation from the shock. For example, Tarter & Welch (1986) modeled H2O maser emission from molecular precursors in star forming regions. They argued that dust grains might be heated by infrared radiation from the shock, leading to, at least temporarily, conditions of hot dust mixed with cold gas. Infrared emission from the dust grains leads to radiative pumping of H2O, thereby fueling maser emission (Goldreich & Kwan, 1974). The difficulty with this model, however, is that the IR photon budget of NGC 1068 may not be sufficient to power the observed megamasers (Claussen & Lo, 1986). Instead, we suggest that the molecular precursor region is heated by X-radiation emitted by hot post-shock gas. For the jet outflow velocities estimated for NGC 1068 and other Seyfert galaxies, the predicted temperatures of post-shock gas are in the 1–10 keV range (cf. Dopita & Sutherland 1995). The X-ray emission from the shock might power maser emission in the surrounding molecular gas by the process outlined by Neufeld et al. (1994). The critical parameters are the density and velocity of the jet, which determine the X-ray luminosity, and the pressure in the surrounding medium. Unfortunately, the jet properties are poorly constrained, and so it is difficult to assess this scenario quantitatively. Better treatment will require hydrodynamical simulations, and numerical studies might be inverted to constrain the conditions in the jet. Such a simulation is outside the bounds of the present work.
12 Conclusions
We have located the positions of the H2O masers of NGC 1068 relative to the 22 GHz continuum emission with an overall accuracy of mas, comparable to the sizes of the VLBI continuum components, but much smaller than the ( mas) separation between adjacent VLBI components. Most of the maser emission lies within about 10 mas of the nuclear continuum feature S1 (the nuclear masers), and there is also maser emission associated with the jet continuum feature C (the jet masers).
We measure no significant (projected) radial accelerations of the nuclear masers; the upper limit on the magnitude of the observed acceleration is km s-1 year-1. If we assume a rotating disk geometry, this limit places the high velocity masers within 19 of the kinematic line of nodes.
The brightnesses of the nuclear masers are correlated on time-scales of years, and they are uncorrelated with variations of the jet maser brightness. The time-scale for variations of the nuclear masers can be at least as rapid as a few weeks. Coherent variations occur on time-scales shorter than the dynamical time but comparable to the light crossing radius, roughly 2 years, of the source. These results argue in favor of a reverberation model, in which the nuclear masers are responding to a common, central pump source.
We find that there is better correlation between the red and blue maser brightnesses than the red and systemic maser brightnesses. We also detected a single flare event in the red and blue masers, but there is no corresponding flare in the systemic masers. These results are compatible with a rotating annulus geometry for the nuclear masers.
We also find that the correlations between the nuclear masers are noisy. It is clear that local effects must contribute to the maser variability. Such local effects probably include disk structure, shocks resulting from cloud-cloud collisions, and projected cloud-cloud alignments. Nevertheless, that there are measurable correlations in the peak fluxes and luminosities of the nuclear masers argues that a central pump source plays a dominant role. In addition, since the spatially-integrated luminosities are correlated, the time-scale for propagation of the pump signal through the maser annulus, years, should be shorter than the variation time-scale of the pump, .
We have constructed a model explaining the four-year lag between the loss of maser signal in 1990–1991 and the peak of the near-IR K-band light-curve in 1994–1995. The model requires that the disk is highly inclined and opaque to near-IR radiation, so that we can only see emission from hot ( K) dust grains on the far side of the inner surface of the disk. In this model, the central engine brightens over the course of about ten years, peaking in late 1987. The signal reaches the red masers about three years later, raising the dust temperature of the maser region, which should reduce the luminosity of the H2O masers (Neufeld, 2000). The signal also causes the inner radius of the disk to expand as dust grains evaporate. It takes another four years for the far side of the disk’s inner edge to swell to its maximum size, at which point we see observe the peak of the near-IR light curve. This model cannot account for the extended, non-stellar flux in the observations of Weinberger et al. (1999), which anyway may be at odds with the observed K-band light curve and HST/NICMOS observation. Although this model provides a plausible connection between the H2O and near-IR variability, we cannot rule out coincidence given the observation of a single candidate event.
For future work, a primary test of the reverberation model would be to detect lags between the near-systemic masers and the blueshifted and redshifted masers. Detections of time lags between the nuclear masers would also measure the geometry of the disk perpendicular to the sky-plane, but as argued above, this may be observationally challenging owing to the size of the disk. On the other hand, tracing the velocity-delays curve for one such flare may provide a geometric measure of the distance to NGC 1068.
Determining the nature of the pump source may also prove challenging. To test the X-ray pumping model of Neufeld et al. (1994), for example, would require nearly simultaneous monitoring of the nuclear X-ray emission and the H2O masers. However, it appears that the circumnuclear disk of NGC 1068 is completely Compton-opaque even to hard X-rays. Nuclear X-ray emission is instead observed in scattered light (e.g., Pier et al. 1994 and references therein). Because the size of the scattering region extends several hundred parsecs (e.g., Miller, Goodrich, & Mathews 1991; Capetti et al. 1995), any flares in the X-ray spectrum may be diluted by the the range of time-lags spanned by the scattering medium. Monitoring radio continuum flares is similarly difficult, because the circumnuclear disk is opaque by free-free absorption longward of cm wavelength. In fact, based on our own, unpublished VLA and MERLIN observations monitoring 6 and 1.3 cm wavelengths, there appears to be no variability of the nuclear radio continuum components over the past two decades. Any further tests of the reverberation model will probably depend mainly on time-lags in the H2O maser spectrum and corresponding echos in the near-infrared variability.
We also considered possible origins for the jet masers. It seems likely that they are related to a shock front between the radio jet and molecular gas. However, since dust would probably not survive the shock, H2 does not easily reform in the cooling, postshock gas, and it is not clear how H2O masers would be pumped. We suggest that the masers might instead arise in an X-ray heated precursor region. Further tests of this model will probably rely on numerical simulations of jet shocks in molecular gas.
References
- Antonucci & Miller (1985) Antonucci, R. R. J. & Miller, J. S. 1985, ApJ, 297, 621
- Baan & Haschick (1996) Baan, W. A. & Haschick, A. 1996, ApJ, 473, 269
- Baars et al. (1977) Baars, J. W. M., Genzel, R., Pauliny-Toth, I. I. K., & Witzel, A. 1977, A&A, 619, 99
- Barvainis (1992) Barvainis, R. 1992, ApJ, 400, 502
- Begelman & Bland-Hawthorn (1997) Begelman, M. C. & Bland-Hawthorn, J. 1997, Nature, 385, 22
- Bode (1988) Bode, M. F., in Dust in the Universe, eds. M. E. Baily & D. A. Williams (Cambridge: Cambridge University Press), 73
- Bragg et al. (2000) Bragg, A. E., Greenhill, L. J., Moran, J. M., & Henkel, C. 2000, ApJ, 535, 73
- Brinks et al. (1997) Brinks, E., Skillman, E. D., Terlevich, R. J., & Terlevich, E. 1997, Ap&SS, 248, 23
- Capetti et al. (1995) Capetti, A., Macchetto, F., Axon, D. J., Sparks, W. B., & Boksenberg, A. 1995, ApJ, 452, L87
- Capetti, Macchetto, & Lattanzi (1997) Capetti, A., Macchetto, F. D., & Lattanzi, M. G. 1997, ApJ, 476, L67
- Claussen, Heiligman, & Lo (1984) Claussen, M. J., Heiligman, G. M., & Lo, K. -Y. 1984, Nature, 310, 298
- Claussen & Lo (1986) Claussen, M. J. & Lo, K. -Y. 1986, ApJ, 308, 592
- Claussen et al. (1996) Claussen, M. J., Wilking, B. A., Benson, P. J., Wootten, A., Myers, P. C., & Terebey, S. 1996, ApJS, 106, 111
- Clavel, Wamsteker, & Glass (1989) Clavel, J., Wamsteker, W., & Glass, I. S. 1989, ApJ, 337, 236
- Dopita & Sutherland (1995) Dopita, M. A. & Sutherland, R. S. 1995, ApJ, 455, 468
- Draine & Lee (1984) Draine, B. T., & Lee, H. M. 1984, ApJ, 285, 89
- Elitzur, Hollenbach, & McKee (1989) Elitzur, M., Hollenbach, D. J., & McKee, C. F. 1989, ApJ, 346, 983
- Evans et al. (1991) Evans, I. N., Ford, H. C., Kinney, A. L., Antonucci, R. R. J., Armus, L., & Caganoff, S. 1991, ApJ, 369, L27
- Fomalont (1994) Fomalont, E. B. 1994, Synthesis Imaging in Radio Astronomy, ed. R. A. Perley, F. R. Schwab, & A. Bridle, (San Francisco: A. S. P.), 219
- Gallimore (1996) Gallimore, J. F. 1996, Ph. D. Dissertation (College Park: University of Maryland)
- Gallimore, Baum, & O’Dea (1997) Gallimore, J. F., Baum, S. A., & O’Dea, C. P. 1997, Nature, 388, 852
- Gallimore et al. (1996) Gallimore, J. F., Baum, S. A., O’Dea, C. P., Brinks, E., & Pedlar, A. 1996, ApJ, 462, 740
- Gallimore et al. (1997) Gallimore, J. F., Baum, S. A., O’Dea, C. P., & Claussen, M. 1997, The AGN-Megamaser Connection, IAU Joint Discussion 21, 26 (Kyoto: 23rd IAU General Assembly)
- Gallimore, Baum, & O’Dea (1996) Gallimore, J. F., Baum, S. A., & O’Dea, C. P. 1996, ApJ, 464, 198
- Gallimore et al. (1996) Gallimore, J. F., Baum, S. A., O’Dea, C. P., & Pedlar, A. 1996, ApJ, 458, 136
- Glass (1997) Glass, I. S. 1997, Ap&SS, 248, 191
- Goldreich & Kwan (1974) Goldreich, P. & Kwan, J. 1974, ApJ, 191, 93
- Greenhill & Gwinn (1997) Greenhill, L. J. & Gwinn, C. R. 1997, Ap&SS, 248, 261
- Greenhill et al. (1996) Greenhill, L. J., Gwinn, C. R., Antonucci, R., & Barvainis, R. 1996, ApJ, 472, L21
- Henkel et al. (1984) Henkel, C., Guesten, R., Wilson, T. L., Biermann, P., Downes, D., & Thum, C. 1984, A&A, 141, L1
- Herrnstein et al. (1999) Herrnstein, J. R., et al. 1999, Nature, 400, 539
- Isobe, Feigelson, & Nelson (1986) Isobe, T., Feigelson, E. D., & Nelson, P. I. 1986, ApJ, 306, 490
- Jones et al. (1994) Jones, A. P., Tielens, A. G. G. M., Hollenbach, D. J., & McKee, C. F. 1994, ApJ, 433, 797
- Khachikian & Weedman (1974) Khachikian, E. Y. & Weedman, D. W. 1974, ApJ, 192, 581
- Kishimoto (1999) Kishimoto, M. 1999, ApJ, 518, 676
- Königl & Kartje (1994) Königl, A. & Kartje, J. F. 1994, ApJ, 434, 446
- Krolik & Lepp (1989) Krolik, J. H. & Lepp, S. 1989, ApJ, 347, 179
- Lawrence (1991) Lawrence, A. 1991, MNRAS, 252, 586
- Maloney, Hollenbach, & Tielens (1996) Maloney, P. R., Hollenbach, D. J., & Tielens, A. G. G. M. 1996, ApJ, 466, 561
- Maoz & McKee (1998) Maoz, E. & McKee, C. F. 1998, ApJ, 494, 218
- Mathis, Rumpl, & Nordsieck (1977) Mathis, J. S., Rumpl, W., & Nordsieck, K. H. 1977, ApJ, 217, 425 ApJ, 494, 218
- Matt et al. (1997) Matt, G. et al. 1997, A&A, 325, L13
- Miller, Goodrich, & Mathews (1991) Miller, J. S., Goodrich, R. W., & Mathews, W. G. 1991, ApJ, 378, 47
- Miyoshi et al. (1995) Miyoshi, M., Moran, J., Herrnstein, J., Greenhill, L., Nakai, N., Diamond, P., & Inoue, M. 1995, Nature, 373, 127
- Murayama & Taniguchi (1997) Murayama, T. & Taniguchi, Y. 1997, PASJ, 49, L13
- Muxlow et al. (1996) Muxlow, T. W. B., Pedlar, A., Holloway, A., Gallimore, J. F., & Antonucci, R. R. J. 1996, MNRAS, 278, 854
- Nakai et al. (1995) Nakai, N., Inoue, M., Miyazawa, K., Miyoshi, M., & Hall, P. 1995, PASJ, 47, 771
- Nakai, Inoue, & Miyoshi (1993) Nakai, N., Inoue, M., & Miyoshi, M. 1993, Nature, 361, 45
- Nelson (1996) Nelson, B. O. 1996, ApJ, 465, L87
- Nenkova, Ivezic, & Elitzur (1999) Nenkova, M., Ivezic, Z., & Elitzur, M. 1999, Workshop on Thermal Emission Spectroscopy and Analysis of Dust, Disks, and Regoliths, Houston, Texas, abstract no. 3020
- Netzer & Peterson (1997) Netzer, H., & Peterson, B. M. 1997, Astronomical Time Series, ed. D. Maoz, A. Sternberg, & E. M. Leibowitz (Cambridge: Cambridge University Press), 85
- Neufeld (2000) Neufeld, D. A. 2000, ApJ, 542, L99
- Neufeld & Kaufman (1993) Neufeld, D. A., & Kaufman, M. J. 1993, ApJ, 263, 272
- Neufeld & Maloney (1995) Neufeld, D. A. & Maloney, P. R. 1995, ApJ, 447, L17
- Neufeld, Maloney, & Conger (1994) Neufeld, D. A., Maloney, P. R., & Conger, S. 1994, ApJ, 436, L127
- Ney & Hatfield (1978) Ney, E. P. & Hatfield, B. F. 1978, ApJ, 219, l111
- Ott et al. (1994) Ott, M., Witzel, A., Quirrenbach, A., Krichbaum, T. P., Standke, K. J., Schalinski, C. J., & Hummel, C. A. 1994, A&A, 284, 331
- Pier et al. (1994) Pier, E. A., Antonucci, R., Hurt, T., Kriss, G., & Krolik, J. H. 1994, ApJ, 428, 124
- Pier & Krolik (1993) Pier, E. A. & Krolik, J. 1993, ApJ, 418, 99
- Press et al. (1992) Press, W. H., Teukolsky, S. A., Vetterling, W. T., & Flannery, B. P. 1992, Numerical Recipes in C, Second Edition (Cambridge: Cambridge University Press) Catalog (Cambridge: Cambridge University Press)
- Reid & Moran (1988) Reid, M. J., & Moran, J. M. 1988, in Galactic and Extragalactic Radio Astronomy, eds. G. L. Verschuur & K. I. Kellermann (Berlin: Springer-Verlag), 255
- Richer et al. (1999) Richer, J., Shepherd, D., Bachiller, R., & Churchwell, E. 1999, Protostars & Planets IV, ed. V. Mannings, A. Boss, & S. Russell (Tucson: The University of Arizona Press)
- Roy et al. (1998) Roy, A. L., Colbert, E. J. M., Wilson, A. S., & Ulvestad, J. S. 1998, ApJ, 504, 147
- Salpeter (1977) Salpeter, E. E. 1977, ARA&A, 15, 267
- Seyfert (1943) Seyfert, C. K. 1943, ApJ, 97, 28
- Tarter & Welch (1986) Tarter, J. C. & Welch, W. J. 1986, ApJ, 305, 467
- Tully (1988) Tully, R.B. 1988, Nearby Galaxies Catalog (Cambridge: Cambridge University Press)
- Voit (1991) Voit, G. M. 1991, ApJ, 379, 122
- Watson & Wallin (1994) Watson, W. D. & Wallin, B. K. 1994, ApJ, 432, L35
- Watson & Wallin (1997) Watson, W. D. & Wallin, B. K. 1997, ApJ, 476, 685
- Weinberger, Neugebauer, & Matthews (1999) Weinberger, A. J., Neugebauer, G., & Matthews, K. 1999, AJ, 117, 2748


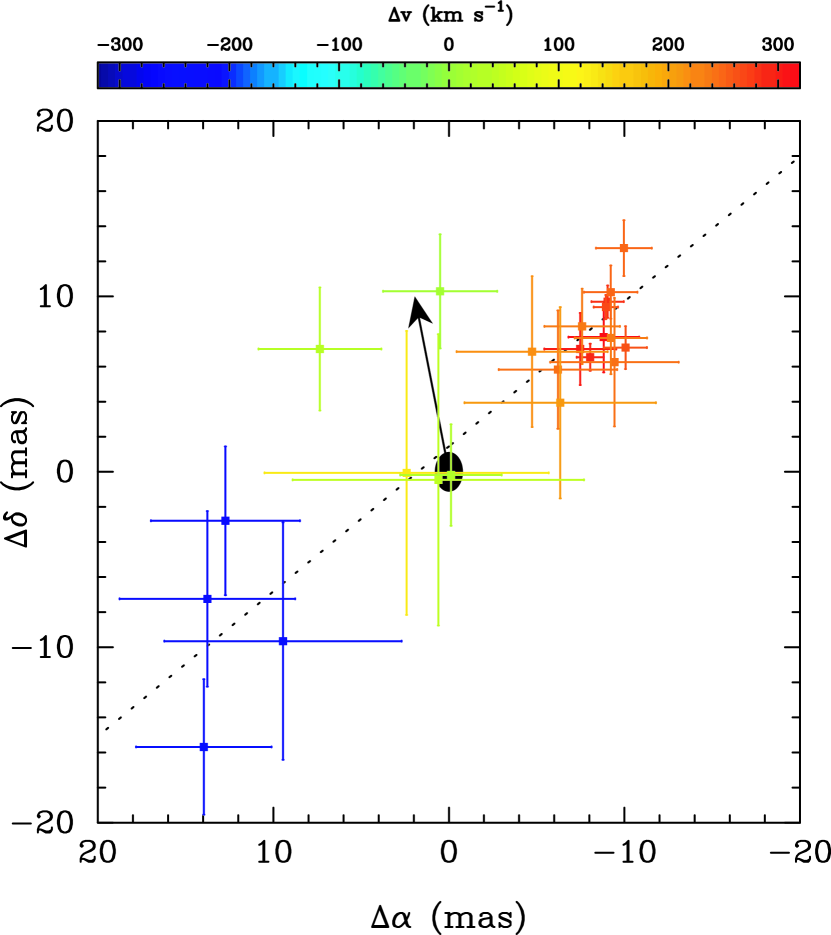


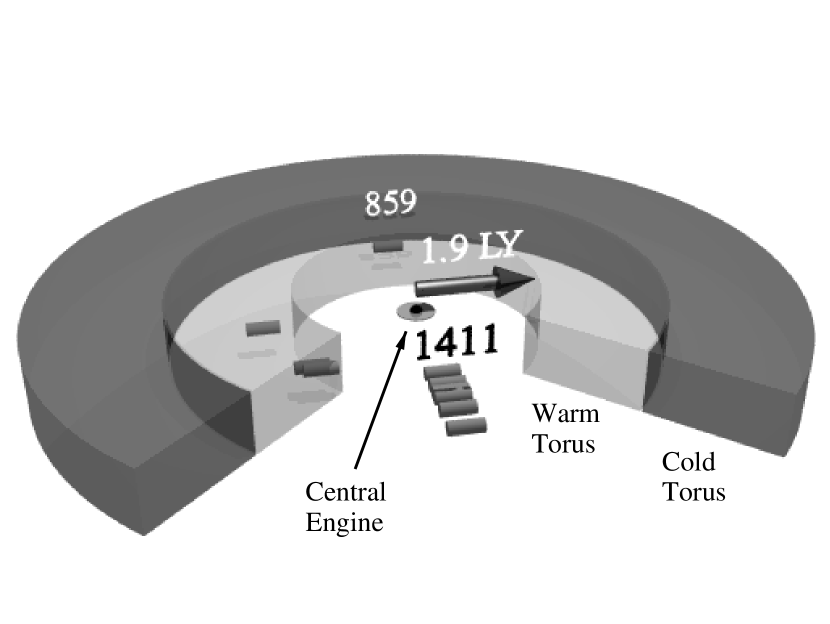

| Date | Velocity Range | ||||
|---|---|---|---|---|---|
| (km s-1) | (LSR, km s-1) | ||||
| (1) | (2) | (3) | |||
| 1984 | Sep | 5-6 | 1.33 | 1000– | 1600 |
| 1985 | Jul | 13 | 0.66 | 1280– | 1520 |
| 1985 | Aug | 4 | 0.66 | 1280– | 1520 |
| 1985 | Sep | 14 | 0.66 | 1000– | 1600 |
| 1995 | Jan | 15 | 1.33 | 860– | 1588 |
| 1995 | May | 10 | 0.66 | 860– | 1759 |
| 1995 | Jun | 26 | 0.33 | 1230– | 1590 |
| 1995 | Sep | 16 | 0.33 | 1230– | 1570 |
| 1996 | Jul | 30 | 0.33 | 1315– | 1484 |
| 1997 | Apr | 6 | 0.66 | 860– | 1540 |
| 1997 | Oct | 12 | 0.66 | 660– | 1620 |
| 1997 | Nov | 3–4 | 0.66 | 610– | 1540 |
| 1998 | Jan | 3 | 0.66 | 460– | 1540 |
| 1998 | Jan | 31 | 1.33 | 560– | 1540 |
| 1998 | Feb | 10 | 1.33 | 860– | 1540 |
| 1998 | May | 8 | 0.33 | 1314– | 1484 |
Note. — Columns are (1) observing date, (2) channel width, and (3) velocity range covered by the observations. Note that we usually employed several overlapping tunings to cover the reported velocity ranges, and, as a result, the noise levels are not uniform across these velocity ranges.
| Obs. Date | Telescope | Reference | |
|---|---|---|---|
| (1) | (2) | (3) | |
| 1983 | Jan | OVRO 40m | Claussen & Lo 1986 |
| 1983 | Sep | OVRO 40m | Claussen & Lo 1986 |
| 1984 | May | OVRO 40m | Claussen & Lo 1986 |
| 1984 | Sep | Effelsberg 100m | Henkel et al. 1984 |
| 1992 | Jan–Jun | Nobeyama 45m | Nakai et al. 1995 |
| 1993 | Feb | Effelsberg 100m | Greenhill et al. 1996 |
Note. — Columns are (1) observing date, (2) telescope used for observations, and (3) reference for the published spectrum.
| Radio | ||
|---|---|---|
| ID | (km s-1) | |
| S1 | 856.6 | 0.3 |
| C | 984.1 | 1.2 |
| S1 | 1143.9 | 1.1 |
| S1 | 1368.5 | 0.2 |
| S1 | 1376.1 | 0.1 |
| S1 | 1394.8 | 0.7 |
| S1 | 1403.8 | 0.1 |
| S1 | 1407.5 | 0.3 |
| S1 | 1411.6 | 0.7 |
| S1 | 1424.6 | 0.3 |
| S1 | 1429.3 | 0.1 |
| S1 | 1434.0 | 0.3 |
| S1 | 1452.9 | 0.2 |
Note. — The LSR velocities of the H2O masers of NGC 1068. The first columns lists the nearest radio continuum component to the maser feature as identified by VLA imaging. Only those features that are easily distinguishable at 0.66 km s-1 channel spacing are listed. The velocities were measured from local Gaussian fits to the line profile in the integrated maser spectrum derived from 1995–1998 Effelsberg 100m observations.
| Experiment | Test on Peaks | Prob | ProbMC | Test on Lums. | Prob | ProbMC | |||
|---|---|---|---|---|---|---|---|---|---|
| (1) | (2) | (3) | (4) | (5) | (6) | (7) | (8) | (9) | |
| Blue on Red | Pearson | 0.728 | 0.016 | 0.040 | 10 | 0.729 | 0.017 | 0.042 | 10 |
| Spearman | 0.806 | 0.005 | 0.006 | 10 | 0.806 | 0.005 | 0.006 | 10 | |
| Cox | 10.264 | 0.001 | 0.003 | 11 | 10.176 | 0.001 | 0.010 | 11 | |
| Kendall | 2.569 | 0.010 | 0.008 | 11 | 2.569 | 0.010 | 0.007 | 11 | |
| Systemic | Pearson | 0.603 | 0.013 | 0.012 | 16 | 0.704 | 0.005 | 0.010 | 14 |
| on Red | Spearman | 0.515 | 0.041 | 0.040 | 16 | 0.526 | 0.053 | 0.056 | 14 |
| Cox | 3.589 | 0.058 | 0.068 | 16 | 7.772 | 0.005 | 0.014 | 14 | |
| Kendall | 2.208 | 0.027 | 0.023 | 16 | 1.806 | 0.071 | 0.066 | 14 | |
| Jet on Red | Pearson | 0.150 | 0.593 | 0.602 | 15 | 0.031 | 0.919 | 0.944 | 13 |
| Spearman | 0.205 | 0.464 | 0.462 | 15 | 0.016 | 0.957 | 0.964 | 13 | |
| Cox | 2.212 | 0.137 | 0.157 | 16 | 0.135 | 0.712 | 0.690 | 14 | |
| Kendall | 0.769 | 0.441 | 0.453 | 16 | 0.164 | 0.869 | 0.828 | 14 | |
Note. — Column 1 lists the maser groups under consideration (e.g., “Blue on Red” means correlation statistics between the nuclear blue and red masers). The next four columns (2–5) list the correlation statistics comparing the peak flux of the maser spectrum for those groups of masers, the formal probability for no correlation, the same probability estimated using Monte Carlo statistics (ProbMC), and the number of data points used in the test. A low probability means there is evidence for significant correlation. Columns 6–8 list the corresponding statistics comparing the integrated luminosities of the maser groups. Note that the data do not always completely cover the maser emission spectrum, and, as a result, there are usually fewer luminosity measurements than peak measurements.
| Parameter | Value | Error |
|---|---|---|
| Minimum Luminosity | ||
| Maximum Luminosity | ||
| Flare Duration | 9.8 years | 2.4 years |
| Hydrogen Density | cm-3 | cm-3 |
| Disk Inclination | 87° | 4° |
| Inner Edge Temperature | 1300 K | (Fixed) |
Note. — The reported errors were estimated based on the variance of the fitted parameters with changes of the model systematics. To this end we adjusted (1) initial guesses of the model parameters; (2) the shape of the flare profile (Gaussian, sawtooth, sawtooth plus slope, and tophat); (3) the fraction of starlight in the 12″ aperture; and (4) the assumed disk scale height. The reported flare duration is the FWHM of the model flare. The hydrogen density was computed assuming a standard gas-to-dust ratio and extinction curve (Draine & Lee, 1984).