The Phase-Space Density Profiles of Cold Dark Matter Halos
Abstract
We examine the coarse-grained phase-space density profiles of a set of recent, high-resolution simulations of galaxy-sized Cold Dark Matter (CDM) halos. Over two and a half decades in radius the phase-space density closely follows a power-law, , with . This behaviour closely matches the self-similar solution obtained by Bertschinger for secondary infall of gas onto a point-mass perturber in a uniformly expanding universe. On the other hand, the density profile corresponding to Bertschinger’s solution (a power-law of slope ) differs significantly from the density profiles of CDM halos. CDM halo density profiles are clearly not power laws, and have logarithmic slopes that gradually steepen with radius, roughly as described by Navarro, Frenk & White (NFW). We show that isotropic, spherically-symmetric equilibrium mass distributions with power-law phase-space density profiles form a one-parameter family of structures controlled by the ratio of the local velocity dispersion to the “natural” velocity dispersion at some fiducial radius, ; . For one recovers the power-law solution . As increases, the density profiles become quite complex but still diverge like near the center. For larger than some critical value, , solutions become non-physical, leading to negative densities near the center. The critical solution, , corresponds to the case where the phase-space density distribution is the narrowest compatible with the power-law phase-space density stratification constraint. Over three decades in radius the critical solution is indistinguishable from an NFW profile, although its logarithmic slope asymptotically approaches (rather than ) at very small radii. Our results thus suggest that the NFW profile is the result of a hierarchical assembly process that preserves the phase-space stratification of Bertschinger’s spherical infall model but which “mixes” the system maximally, perhaps as a result of repeated merging, leading to a relatively uniform phase-space density distribution across the system. This finding offers intriguing clues as to the origin of the similarity in the structure of dark matter halos formed in hierarchically clustering universes.
1 Introduction
In the currently favored paradigm for the formation of structure in the Universe, luminous objects such as galaxies and galaxy clusters are embedded within extended halos of cold dark matter (CDM). The non-linear equilibrium structure of these halos has long been thought to contain clues as to the astrophysical nature of dark matter, a fact that has fueled strong interest in detailed theoretical predictions for the structure of dark matter halos, as well as in constraints placed by observations of disk galaxy rotation curves (Frenk et al. 1988; Flores et al. 1993; Flores & Primack 1994; Moore 1994; Moore et al. 1999b, McGaugh & de Blok 1998, van den Bosch et al. 2000; Swaters, Madore & Trewhella 2000; van den Bosch & Swaters 2000), by gravitational lensing of galaxies and clusters (see, e.g., Tyson, Kochanski & dell’Antonio 1998, Williams, Navarro & Bartelmann 1999), and by detailed studies of the stellar dynamics of spheroidal galaxies (Carollo et al. 1995; Rix et al. 1997; Gerhard et al. 1998; Cretton et al. 2000; Kronawitter et al. 2000).
Unfortunately, observational constraints tend to be strongest near the center of dark matter halos – where most of the luminous material in galaxies resides – but also where theoretical predictions are least robust. This is because of the difficulties inherent to simulating accurately through N-body methods regions where overdensities exceed and where particles may have completed thousands of orbits during a Hubble time. In spite of these difficulties, there has been steady progress in our theoretical understanding of the non-linear structure of virialized dark matter halos, driven largely by direct numerical simulation. Following on pioneering numerical studies by Quinn, Salmon & Zurek (1986), Frenk et al. (1988), Dubinski & Carlberg (1991), and Crone, Evrard & Richstone (1994), Navarro, Frenk & White (1996, 1997, hereafter NFW) found that, regardless of mass and of the value of the cosmological parameters, the density profiles of dark matter halos formed in various hierarchical clustering cosmogonies were strikingly similar. This “universal” structure can be characterized by a spherically-averaged density profile which differs substantially from the simple power-laws, , predicted by early theoretical studies (Gunn & Gott 1972, Fillmore & Goldreich 1984, Hoffmann & Shaham 1985, White & Zaritsky 1992). The profile steepens monotonically with radius, with logarithmic slopes shallower than isothermal (i.e. ) near the center, but steeper than isothermal () near the virial radius of the system.
The NFW result has been confirmed by a number of subsequent studies (Cole & Lacey 1996, Huss, Jain & Steinmetz 1999, Fukushige & Makino 1997, Moore et al. 1998, Jing & Suto 2000), although there is some disagreement amongst authors regarding the innermost value of the logarithmic slope. NFW argued that a fitting formula where (where is the radius in units of a suitably defined “scale radius” ) provides a very good fit to the density profiles of simulated halos over two decades in radius. Moore et al. (1998), Ghigna et al. (2000), and Fukushige & Makino (2000) have argued that converges to a value of near the center, rather than the expected from the NFW fit. Kravtsov et al. (1998) initially obtained much shallower inner slopes () in their numerical simulations, but have now revised their conclusions; these authors now argue that CDM halos have steeply divergent density profiles but, depending on evolutionary details, the slope of a galaxy-sized halo at the innermost resolved radius may very between and (Klypin et al. 2000).
Steep inner slopes have been traditionally disfavored by rotation curve data, a fact that has often been used to “rule out” CDM as a viable cosmogony (Flores & Primack 1994, Moore 1994, McGaugh & de Blok 1998, Blais-Ouellette et al. 2001, Côté et al. 2000, de Blok et al. 2001). However, recent reanalysis of the available data suggests that most rotation curves are broadly consistent with “cuspy” dark matter cores, provided that the innermost slope is shallower than and that the “concentration” of the halos is low (Navarro 1998, van den Bosch et al. 2000, van den Bosch & Swaters 2000).
Although there may not be at present broad consensus regarding how steep the innermost slope is, or even whether there should be a well-defined asymptotic innermost slope, there is agreement that it will take extraordinary computational effort to reach a robust resolution of the controversy. What is required is a statistically significant sample of galaxy-sized halos with sub-kpc resolution, an extremely onerous computational task that will stretch the capabilities of the most powerful massively parallel computers. Steps in this direction are currently being taken (e.g., Power et al., in preparation), but it will take some time until these efforts yield conclusive results.
From the theoretical point of view, a number of plausible arguments have been advanced in order to try and explain the innermost behaviour of dark matter density profiles from stellar dynamical principles. These efforts, however, tend to give non-unique results and have so far been unable to explain the remarkable similarity in the structure of dark matter halos of widely different mass formed in a variety of cosmogonies (Evans & Collett 1997, Syer & White 1998, Nusser & Sheth 1999, Łokas & Hoffman 2000). In this paper we investigate an empirical alternative to analytic efforts addressed at estimating the innermost slope of the density profile. Our proposal exploits the similarity between the phase-space density profiles of CDM halos and that of the self-similar solution for spherical collapse in an expanding universe found by Bertschinger (1985). In addition, this offers an attractive scenario for understanding the shape of halo density profiles as well as a powerful tool for estimating their slope near the center.
The outline of this paper is as follows. In Section 2, we present the phase-space density profiles for galaxy-sized CDM halos in several recent simulations, and show that they are well approximated, for over two decades in radius, by a power law. In Section 3, we investigate equilibrium density profiles consistent with this constraint by solving the Jeans equation for spherically symmetric systems with isotropic velocity dispersion tensors. Section 4 compares these results with the results of numerical simulations. We discuss and summarize our findings in Section 5.
2 The Phase-Space Density Profile of CDM Halos
We have chosen for our analysis three high-resolution simulations of galaxy-sized CDM halos identified at . Each of these simulations has of order particles within the virial radius of the halo, and was run with PKDGRAV, a massively-parallel N-body code developed by Joachim Stadel and Thomas Quinn at the University of Washington. These simulations are amongst the largest carried out so far for galaxy-sized objects, and represent a major investment in computational resources.
Two of the halos were run in the former “standard” CDM cosmology (SCDM, ) and have circular velocities of and km s-1, respectively. These circular velocities are measured at the “virial” radius, , where the mean inner density of the system is times the critical value for closure. These two halos are part of the “Local Group” simulation reported in Moore et al. (1999a). The third halo has a circular velocity of km s-1 and was run in the currently popular LCDM cosmogony (). Gravitational softenings were chosen to be and , for the SCDM and LCDM runs, respectively. PKDGRAV uses a multi-stepping algorithm to integrate the equations of motion; particles with the smallest time bins may take up to timesteps to evolve from the initial redshift ( for SCDM and for LCDM) to the present. The initial conditions for the SCDM runs were setup using the algorithms devised by the N-body shop at the University of Washington. Those for the LCDM run were set up in a completely independent way using the algorithms described by Navarro, Frenk & White (1996, 1997; see also Efstathiou et al. 1985). As we describe below, the results of these two independent runs are consistent with each other, which suggests that our conclusions are independent of both the cosmological model adopted and of the particular choice of initial conditions setup algorithms.
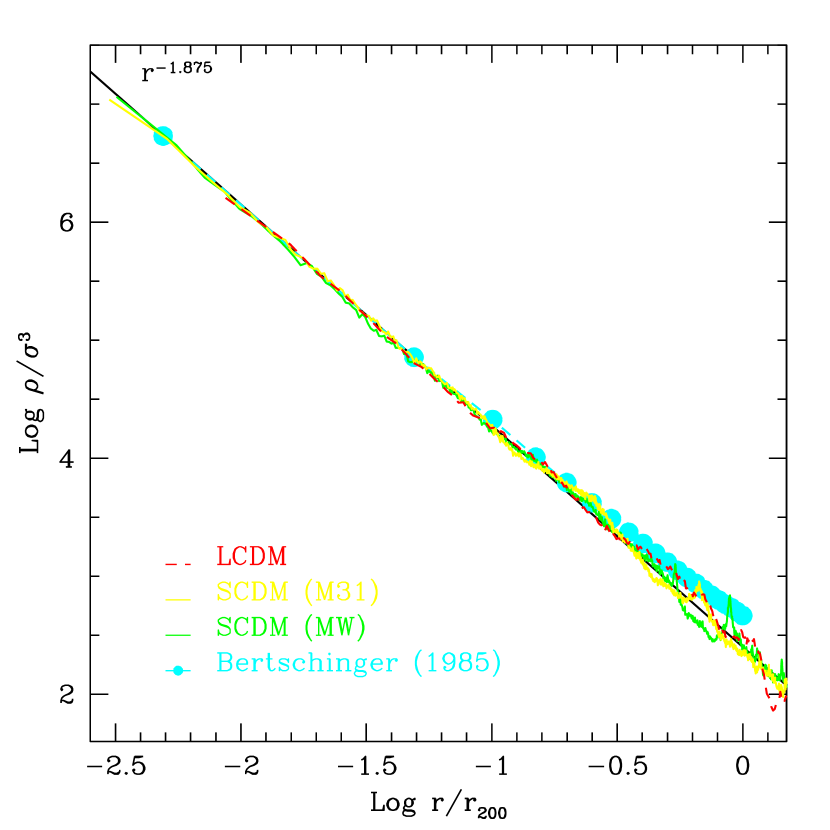
Figure 1 shows the spherically-averaged phase-space density profile of the three CDM halos. Solid (dashed) lines are used for the SCDM (LCDM) halos. The phase-space density is computed in spherical bins containing particles each and is defined as , where is the mass density and is the 1-D velocity dispersion in the bin.111The velocity dispersion tensor is roughly isotropic near the center and only mildly radially biased in the outer regions. For ease of comparison, we have chosen to normalize so that all three curves coincide at . The important point illustrated by this figure is that, over more than two decades in radius, the phase-space density profile is very well approximated by a power law of slope (thin straight line). This is quite remarkable, given that both the density profiles (shown in Figure 2) and the velocity dispersion profiles of these halos deviate quite strongly from simple power laws, as described by NFW.
Also remarkable is that the slope of this power-law coincides with the self-similar solution derived by Bertschinger (1985) for secondary infall onto a spherical perturbation in an unperturbed Einstein-de Sitter universe: Bertschinger’s solution is plotted with solid circles in Figure 1. This solution corresponds to the self-similar equilibrium configuration of a gas formed by spherical accretion onto a point-mass perturber in an otherwise uniform Einstein-de Sitter universe. The quantity shown by the solid circles is the quantity “equivalent” to the phase-space density, , where is the local (isotropic) pressure. As discussed by Bertschinger, this solution is the most appropriate to compare with our numerical results for CDM halos, given that the velocity dispersion tensor in this case is only mildly anisotropic. Radii are normalized assuming that equals the shock radius of the self-similar solution, which corresponds to roughly one-third of the turnaround radius. The vertical normalization is arbitrary and has been chosen to match the N-body results at 0.01 . Taking to be a measure of the local “entropy” of the system, Figure 1 shows that CDM halos have the same radial entropy stratification as the simple spherical collapse solution. It is possible that this power-law stratification is a fundamental property which underlies the similarity of structure of cold dark matter halos.
3 Density Profiles
Density profiles consistent with the power-law phase-space density profile shown in Figure 1 can be obtained by assuming hydrostatic equilibrium. For an isotropic, spherically-symmetric system of collisionless particles, the Jeans equation may be written as
| (1) |
where is the gravitational potential, and is the mass interior to (Binney and Tremaine, 1987, p. 198). Equation (1) is equivalent to the equation of hydrostatic equilibrium for a gas of pressure . Dividing both sides of the equation by , and taking derivatives with respect to , we can rewrite this equation as,
| (2) |
where the last equivalence applies to a self-gravitating system. Assuming that the phase-space density is a power-law of radius, i.e. that
| (3) |
where is an (arbitrary) reference radius and and , and defining the dimensionless variables, and , (2) can then be written as,
| (4) |
where
| (5) |
is a dimensionless measure of the velocity dispersion at . A simple interpretation of the parameter can be found by choosing to be , the radius where the circular velocity of the system peaks. In this case, and since , we can rewrite as,
| (6) |
In other words, measures the local velocity dispersion of the system in units of its circular velocity at the radius where the circular velocity peaks.
Equation (4) has the form,
| (7) |
(where ) so given initial conditions and at , we can solve it numerically for or by integrating inwards or outwards. The resulting solutions are parameterized by , and , so for , we obtain a two-parameter family of solutions. Clearly, integrating (7) with respect to some different variable , where is a constant, will produce an identical solution, provided that we scale by and by , so in fact the solutions are degenerate and there is effectively a single free parameter (which we can take to be ) that characterizes the full solution set.222This assumption breaks down if we choose to be positive, or negative but too small. In this case increases with and the solutions are unstable and lack direct physical interpretation.
Equation (7) admits power-law solutions. Solving for gives the following conditions. For we have,
| (8) |
while for the conditions are,
| (9) |
For example, the singular isothermal sphere is recovered for .
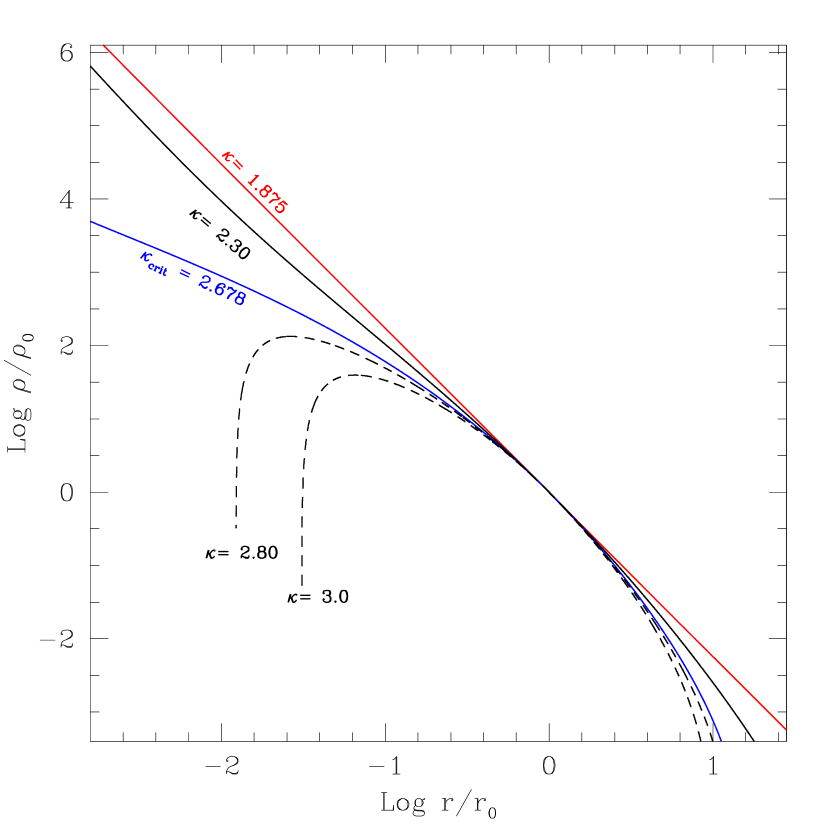
Thus assuming , that is, a finite velocity dispersion at , there is a single power-law solution to (7) with slope for .333Curiously, besides the singular isothermal sphere this is the only other case where the power-law solution has . It is convenient to set and to generate the family of solutions simply by varying . Figure 2 shows a few of these solutions (for ), labeled by the particular value of beside each curve. With the exception of the power law, the shape of the equilibrium density profiles is complex, with an outer cutoff, one or more inflection points, and an inner cusp. For larger than some critical value, , the solutions become non-monotonic, and the density vanishes at a finite radius. All solutions with appear to have a steep inner cusp with asymptotic slope close to , but the critical solution approaches asymptotically as tends to .
4 Comparison with Numerical Density Profiles
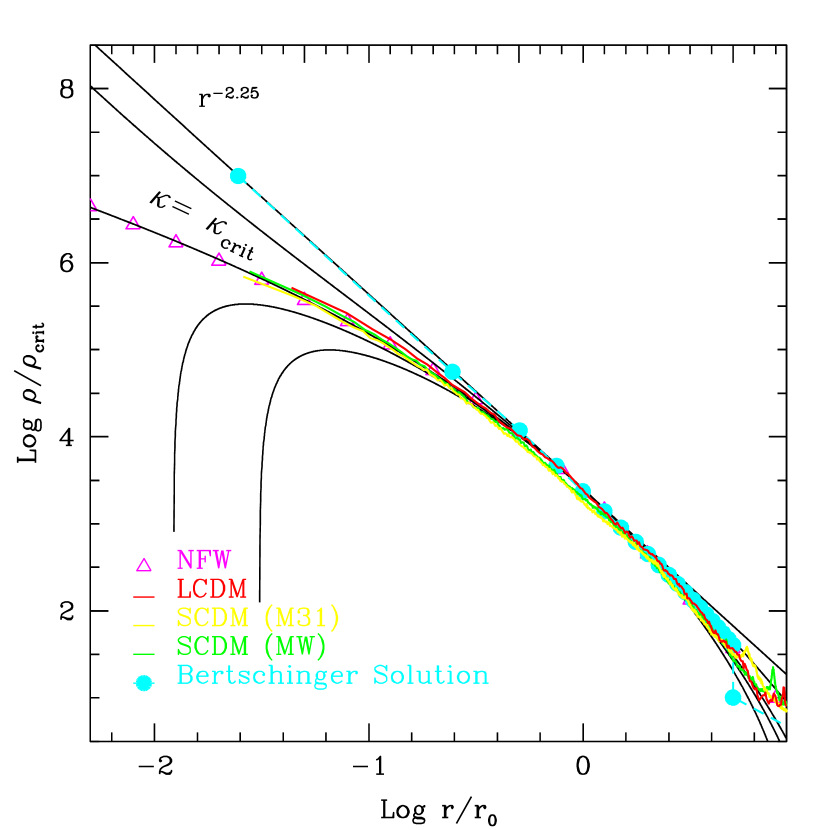
As discussed in the previous section, the isotropic Jeans equation admits a family of solutions for the density profile under the constraint . The family includes a power-law, , with (for ), which corresponds to Bertschinger’s spherical infall solution. This is shown with filled circles in Figure 3, where we also show the density profiles corresponding to the CDM halos in the N-body simulations. Radii have been scaled here, as in Figure 2, to the radius where the slope of the density profile is , and densities to the critical density. Clearly, the power-law solution is a poor fit to the result of the N-body simulations, which become noticeably shallower than near the center.
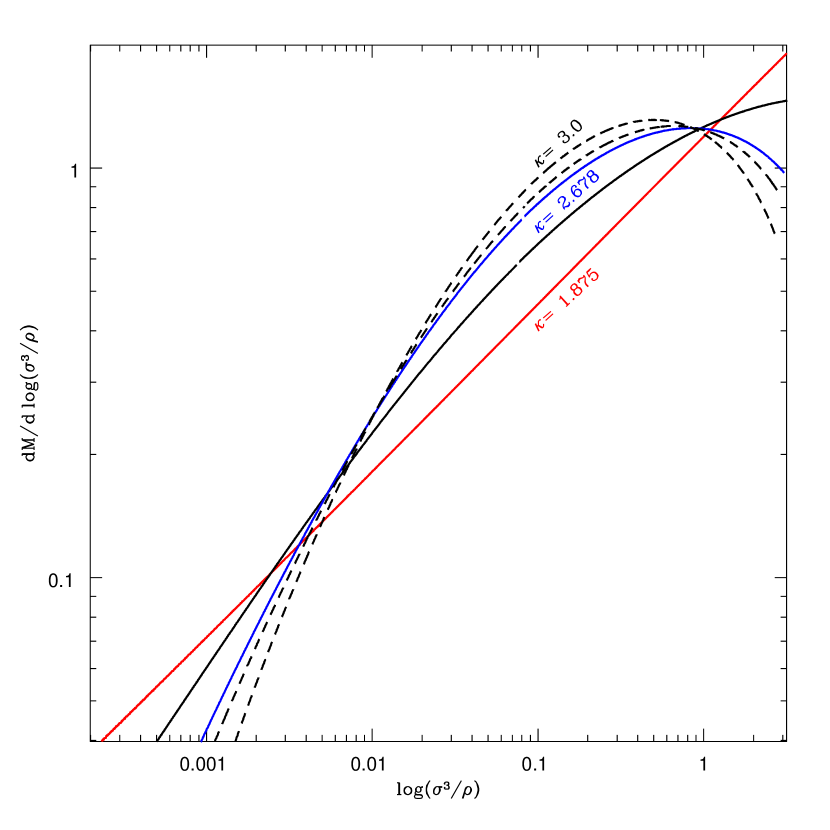
The N-body results can be well fitted by the profile proposed by NFW, which is shown by the open triangles in Figure 3. Interestingly, over approximately three decades in radius, the shape of the NFW profile is essentially indistinguishable from the “critical” solution alluded to above. Discrepancies occur only at large radii, where substructure leads to systematic deviations from the power-law behaviour for the phase-space density. The meaning of the critical solution may be illustrated by considering the phase-space density distribution corresponding to the different solutions. This is shown in Figure 4 for the solutions illustrated in Figure 2, for systems normalized to have the same total mass, energy, and mean density inside some fiducial radius. Clearly, the phase-space distribution function is broadest for the power-law solution () and gets increasingly narrower as increases; the critical solution () corresponds then to the most sharply peaked phase space distribution compatible with a monotonically decreasing (non-hollow) density profile and with the entropy stratification constraint. The critical solution may thus be interpreted as a “maximally mixed” configuration where the phase-space density is as uniform as possible across the system.
This leads to the following interpretation for the origin of the NFW profile. Gravitational assembly of CDM halos leads to a simple power-law radial stratification of the phase-space density. If spherical symmetry is imposed, as in the case treated by Bertschinger (1985), the collapsing radial mass shells generate progressively larger “entropies” (lower phase-space densities) as they pass through the shock and settle into hydrostatic equilibrium, leading to steeply cusped power-law profiles with slope . On the other hand, when the assumption of spherical symmetry is released and the collapse proceeds through many stages of hierarchical merging, mass shells are continuously “mixed” and the profiles tend to the critical solution: that corresponding to the most uniform entropy distribution compatible with a non-hollow density profile and with the power-law entropy stratification constraint. This density profile closely resembles the NFW profile over a large dynamic range in radius.
Finally, it is important to note that, despite the similarity shown in Figure 3, there are important differences between the NFW profile and the critical solution, the most notable being that the latter tends to an asymptotic central slope of rather than to as in NFW’s fitting formula. A simple approximation to the radial dependence of the slope of the “critical” density profile is given by
| (10) |
which is accurate to for . Here is the radius where the logarithmic slope of the density profile equals and , in terms of the NFW scale radius .
5 Discussion
The power-law phase-space density profile thus offers a natural way to describe the structure of dark matter halos at radii where simulations become increasingly difficult and expensive, but also where observational constraints are strongest. Provided that the velocity dispersion tensor remains nearly isotropic, the “critical” solution provides a clear prediction as to the behaviour of the logarithmic slope of the density profile: it should become progressively shallower towards the center, converging asymptotically to a value of . This is interesting since, as mentioned in §1, slopes shallower than appear to be consistent with the recent reanalysis of the rotation curve dataset by van den Bosch et al. (2000) and by van den Bosch & Swaters (2000). It is important to stress, however, that a shallow central slope does not guarantee consistency with observations, which constrain the detailed radial dependence of the density profile slope as well. Our results do, however, offer a clear prediction for extrapolating the mass profiles to regions that are very difficult to probe numerically. Is the extrapolation of the power-law behaviour to very small radii warranted? This question ultimately will have to be answered by direct numerical simulation, although there is no obvious a priori reason why a power law scaling that is valid for over two decades in radii should break down nearer the center.
One important point to note is that the critical solution is clearly at odds with the proposal of Moore et al. (1998) and Ghigna et al. (2000) that the innermost slopes of CDM halos converge to a value not shallower than about . However, it should be emphasized that their conclusion was based on the simulation of a single halo simulated in a standard CDM universe (SCDM) and on a significantly different mass regime (galaxy clusters) than probed here. Thus the possibility remains that this particular system may not be representative of the general population or that the density profiles of clusters are steeper than those of galaxy-sized halos. Since these authors use the same N-body code as in the present work and, indeed, we use their own results for galaxy-sized halos in this manuscript, it is unlikely that the discrepancy is due to subtle errors associated with the numerical setup of the simulations. Confirming which of these possibilities holds will require a statistically significant sample of halos simulated with resolution comparable to the systems used here. Finally, it is also possible that the cluster simulated by Moore et al. (1998) and Ghigna et al. (2000) differs from the galaxy-sized halos we present here in other, more subtle ways. For example, it may be significantly more triaxial than the systems analyzed here, or perhaps its velocity dispersion tensor is very anisotropic, in conflict with the assumptions of this work. Again, a detailed reanalysis of the discrepant system, extended to a statistically meaningful sample, appears necessary in order to explain this discrepancy conclusively. We are currently working on this issue and plan to report our findings soon (Stadel et al., in preparation).
6 Summary
We examine the spherically averaged phase-space density profiles of N-body simulations of CDM halos in the SCDM and LCDM cosmologies and find that they are very well approximated by a power-law () over more than two decades in radius. The slope of this power law is consistent with that of the self-similar solution for spherical secondary infall derived by Bertschinger (1985). Assuming that the phase-space density profile is a power law, and assuming isotropy, hydrostatic equilibrium is satisfied by a family of density profiles controlled by a single-parameter. This parameter is determined by the ratio of the velocity dispersion to the “natural” velocity dispersion of the system at some fiducial radius, , . The parameter can also be expressed in terms of the ratio of the circular velocity to the 1-D velocity dispersion at , the radius where the circular velocity peaks (). For , the density profile is a power-law, which agrees with Bertschinger’s solution. As increases the density profiles become increasingly curved, although they still approach the steep power-law divergent behaviour near the center. For greater than some critical value the density profiles become unphysical, vanishing at some finite radius near the center.
The “critical” density profile () corresponds to the maximum value of consistent with a non-vanishing density profile at the center and is essentially indistinguishable from the profile proposed by Navarro, Frenk & White (1996, 1997) for over two decades in radius. This solution corresponds to the most uniform (more sharply peaked) phase-space distribution compatible with a monotonically decreasing density profile and with the entropy stratification constraint. This suggests that the structure of CDM halos is determined by a radial phase-space density stratification process similar to that established through collapse onto a point mass perturbation in an unperturbed expanding universe, and by the uniformization of phase-space density that occurs presumably as a result of the many merger and satellite accretion events that characterize the assembly of a CDM halo. This identification leaves a couple of important questions unanswered, however: (i) why should the phase-space density be a power law of radius?, and (ii) why is the exponent the same as in Bertschinger’s self-similar solution?. Although we have no clear answer to these questions at this point, our results suggest that explaining the origin of the structural similarity of CDM halos pointed out by Navarro, Frenk & White may entail unraveling why the radial stratification of phase-space density in CDM halos is the same power-law generated by the simple spherical collapse model. Discovering a mechanism that achieves this may provide a simple explanation for the universal structure of cold dark matter halos.
References
- Bertschinger (1985) Bertschinger, E. 1985, ApJS, 58, 39
- Binney & Tremaine (1987) Binney, J. & Tremaine, S. 1987, Galactic Dynamics (Princeton: Princeton University Press)
- Blais-Ouellette et al. (2000) Blais-Ouellette, S., Amram, P. & Carignan, C. 2001, AJ, in press (astro-ph/0006449)
- Carollo et al. (1995) Carollo, C. M., de Zeeuw, P. T., van der Marel, R. P., Danziger, I. J. & Qian, E. E. 1995, ApJ, 441, L25
- Cole & Lacey (1996) Cole, S. & Lacey, C. 1996, MNRAS, 281, 716
- Côté, Carignan, & Freeman (2000) Côté, S., Carignan, C. & Freeman, K. C. 2000, AJ, 120, 3027
- (7) Cretton N., Rix H.-W. & de Zeeuw P.T., 2000, ApJ, 536, 319
- Crone, Evrard, & Richstone (1994) Crone, M. M., Evrard, A. E. & Richstone, D. O. 1994, ApJ, 434, 402
- de Blok et al. (2001) de Blok, W. J. G., McGaugh, S. S., Bosma, A. & Rubin, V. C. 2001, ApJ, in press (astro-ph/0103102)
- Dubinski & Carlberg (1991) Dubinski, J. & Carlberg, R. G. 1991, ApJ, 378, 496
- Efstathiou, Davis, White, & Frenk (1985) Efstathiou, G., Davis, M., White, S. D. M. & Frenk, C. S. 1985, ApJS, 57, 241
- Evans & Collett (1997) Evans, N. W. & Collett, J. L. 1997, ApJ, 480, L103
- Fillmore & Goldreich (1984) Fillmore, J. A. & Goldreich, P. 1984, ApJ, 281, 1
- Flores & Primack (1994) Flores, R. A. & Primack, J. R. 1994, ApJ, 427, L1
- Flores, Primack, Blumenthal, & Faber (1993) Flores, R., Primack, J. R., Blumenthal, G. R. & Faber, S. M. 1993, ApJ, 412, 443
- Frenk, White, Davis, & Efstathiou (1988) Frenk, C. S., White, S. D. M., Davis, M., & Efstathiou, G. 1988, ApJ, 327, 507
- Fukushige & Makino (2000) Fukushige, T. & Makino, J. 2000, ApJ, submitted (astro-ph/0008104)
- Fukushige & Makino (1997) Fukushige, T. & Makino, J. 1997, ApJ, 477, L9
- Gerhard, Jeske, Saglia, & Bender (1998) Gerhard, O., Jeske, G., Saglia, R. P. & Bender, R. 1998, MNRAS, 295, 197
- Ghigna et al. (2000) Ghigna, S., Moore, B., Governato, F., Lake, G., Quinn, T. & Stadel, J. 2000, ApJ, 544, 616
- Gunn & Gott (1972) Gunn, J. E. & Gott, J. R. I. 1972, ApJ, 176, 1
- Hoffman & Shaham (1985) Hoffman, Y. & Shaham, J. 1985, ApJ, 297, 16
- (23) Huss A., Jain B. & Steinmetz M., 1999, MNRAS, 308, 1011
- Jing & Suto (2000) Jing, Y. P. & Suto, Y. 2000, ApJ, 529, L69
- (25) Klypin A.A., Kravtsov A.V., Bullock J.S. & Primack J.R., 2000, ApJ, submitted (astro-ph/0006343)
- (26) Kravtsov A.V., Klypin A.A., Bullock J.S. & Primack J.R., 1998, ApJ, 502, 48
- (27) Kronawitter A., Saglia R.P., Gerhard O. & Bender R., 2000, A&AS, 144, 53
- Łokas & Hoffman (2000) Łokas, E. L. & Hoffman, Y. 2000, ApJ, 542, L139
- McGaugh & de Blok (1998) McGaugh, S. S. & de Blok, W. J. G. 1998, ApJ, 499, 41
- Moore (1994) Moore, B. 1994, Nature, 370, 629
- (31) Moore B., Governato F., Quinn T., Stadel J. & Lake G., 1998, ApJ, 499, L5
- (32) Moore B., Ghigna S., Governato F., Lake G., Quinn T., Stadel J. & Tozzi P., 1999a, ApJ, 524, L19
- (33) Moore B., Quinn T., Governato F., Stadel J. & Lake G., 1999b, MNRAS, 310, 1147
- (34) Navarro, J.F. 1998, (astro-ph/9807084)
- (35) Navarro J.F., Frenk C.S. & White S.D.M., 1996, ApJ, 462, 563
- (36) Navarro J.F., Frenk C.S. & White S.D.M., 1997, ApJ, 490, 493
- Nusser & Sheth (1999) Nusser, A. & Sheth, R. K. 1999, MNRAS, 303, 685
- Rix et al. (1997) Rix, H., de Zeeuw, P. T., Cretton, N., van der Marel, R. P. & Carollo, C. M. 1997, ApJ, 488, 702
- Quinn, Salmon, & Zurek (1986) Quinn, P. J., Salmon, J. K. & Zurek, W. H. 1986, Nature, 322, 329
- (40) Swaters R.A., Madore B.F. & Trewhella M., 2000, ApJ, 531, L107
- Syer & White (1998) Syer, D. & White, S. D. M. 1998, MNRAS, 293, 337
- Tyson, Kochanski, & dell’Antonio (1998) Tyson, J. A., Kochanski, G. P. & dell’Antonio, I. P. 1998, ApJ, 498, L107
- (43) van den Bosch F.C. & Swaters R.A., 2000, AJ, submitted, (astro-ph/0006048)
- (44) van den Bosch F.C., Robertson B.E., Dalcanton J.J. & de Blok W.J.G., 2000, AJ, 119, 1579
- Williams, Navarro & Bartelmann (1999) Williams, L. L. R., Navarro, J. F., & Bartelmann, M. 1999, ApJ, 527, 535
- White & Zaritsky (1992) White, S. D. M. & Zaritsky, D. 1992, ApJ, 394, 1