Low Frequency VLA Observations of Abell 754: Evidence for a
Cluster Radio Halo and Possible Radio Relics
Abstract
We present 74 MHz and 330 MHz VLA observations of Abell 754. Diffuse, halo-like emission is detected from the center of the cluster at both frequencies. At 330 MHz the resolution of 90′′ distinguishes this extended emission from previously known point sources. In addition to the halo and at a much lower level, outlying steep-spectrum emission regions straddle the cluster center and are seen only at 74 MHz. The location, morphology and spectrum of this emission are all highly suggestive of at least one, and possibly two cluster radio relics. Easily obtained higher resolution, higher sensitivity VLA observations at both frequencies are required to confirm the extended nature of the halo-like emission and the 74 MHz relic detections. However, since there is prior evidence that this cluster is or has recently been in the process of a major merger event, the possible discovery of relics in this system is of great interest in light of recent observational and theoretical evidence in favor of a merger-relic connection. We discuss the possible role the merger shock waves, which are seen in the X-ray emission, may have played in the formation of the halo and radio relics in A754.
1 INTRODUCTION
Clusters of galaxies are the most massive gravitationally bound objects in the universe which are in a state of quasi-equilibrium. Our current understanding of structure formation suggests that clusters form via merging of smaller entities, such as galaxy groups and small clusters. During a merging process clusters are able to release considerable energy into particle acceleration via shock waves and turbulence (De Young, 1992). The accelerated relativistic particles have a short radiative lifetime but can be reaccelerated by recurrent merger events. For several galaxy clusters, radio observations of the relativistic plasma reveal the presence of extended ( 500 kpc) diffuse emission which has a steep spectral index and no observable optical counterpart (Feretti & Giovannini, 1996, and references therein). The synchrotron nature of the emission allows us to trace large regions of relativistic charged electrons and magnetic fields within the X-ray emitting intracluster medium (ICM). In general, this diffuse emission appears to fall within two categories: halos which are centrally located, regular in shape and unpolarized, and relics which are located in the peripheral regions of the cluster, irregular in shape and generally highly polarized (Feretti & Giovannini, 1996).
The origin of these regions of diffuse emission is still a matter of great debate. The large physical scales involved combined with the relatively short radiative lifetimes suggest that the electrons must be re-accelerated within the ICM (Jaffe, 1977). Theoretical models propose that this particle acceleration may occur in the turbulence and shocks associated with major cluster merger events (De Young, 1992; Tribble, 1993; Feretti, 1999; Brunetti et al., 2001), although alternative models include secondary particle production from proton-proton interactions (Dennison, 1980), and particle diffusion from nearby head-tail galaxies (Giovannini et al., 1993). Recent work suggests that there is a positive correlation between the presence of radio halos and relics, and current (or recent) merger activity associated with clusters (Feretti & Giovannini, 1996; Feretti, 1999).
Clusters of galaxies contain a considerable fraction of hot plasma, the ICM, which is heated up to several K due to virialization. This hot thermal plasma traces the gravitational potential of clusters and is thus an ideal tool to determine the dynamical state of a cluster. Because of its high temperature, which corresponds to several keV in energy, the ICM plasma is only directly observable with X-ray telescopes. The X-ray emission allows us not only to trace the potential but also to trace the presence of non-uniform heating, which is caused by adiabatic compression or shock waves from merger events. This kind of heating, which was difficult to detect with past X-ray telescopes is now observable in detail with the latest X-ray satellites, such as Chandra (Vikhlinin, Markevitch, & Murray, 2000a, b) or XMM-Newton (Arnaud et al., 2000).
In this paper we present new radio observations of the galaxy cluster Abell 754 (Abell, Corwin & Olowin, 1989), which was observed at 74 and 330 MHz with the NRAO VLA observatory111The National Radio Astronomy Observatory is a facility of the National Science Foundation operated under cooperative agreement by Associated Universities, Inc.. X-ray observations of this cluster (Henry & Briel, 1995; Henriksen & Markevitch, 1996), which trace the thermal ICM, indicate that it is undergoing a violent merger event. Recent 3D MHD/N-body simulations of Roettiger et al. (1999a, b) indicate that shocks and turbulence associated with the cluster merger could provide the magnetic field amplification and particle re-acceleration necessary to generate diffuse radio relic emission from regions of the ICM. Further, the energy input from the merger may accelerate relativistic particles in the cluster center to produce a radio halo. Therefore A754 seems to be the ideal host for diffuse radio emission. However, up to now radio observations have not been able to provide an unambiguous detection of such emission. Its detection is very important since it strongly supports the hypothesis of a connection between radio halos/relics and merger activity.
1.1 Past Observations of A754
At a redshift of z = 0.054 (Bird, 1994), A754 is a rich galaxy cluster, = 900 km (Zabludoff & Zaritsky, 1995), which has been extensively studied in the optical, radio and X-ray bands. Observations in the 0.5-10 keV ASCA band (Henriksen & Markevitch, 1996) find an X-ray luminosity of and an emission-weighted temperature of 8.50.5 keV for this cluster. Maps of the X-ray surface brightness and X-ray temperature from ROSAT (Henry & Briel, 1995), as well as X-ray temperature maps from ASCA (Henriksen & Markevitch, 1996) show temperature variations that indicate that this cluster is going through or has recently gone through a violent merger event.
A754 has been the object of low frequency radio observations for over 20 years. In no reported observation has a relic been detected and evidence for a radio halo has been inconclusive. Extended emission was reported at 2.7 GHz (Wielebinski et al., 1977) and at 408 MHz (Mills, Hunstead & Skellern, 1978). In both cases the resolution of 3′ to 4′ made it difficult to distinguish apparent extended flux from the blended images of point sources associated with galaxies in or behind the cluster. A higher resolution observation at 610 MHz (Harris et al., 1980) showed no extended emission, yet the authors conclude that a halo likely exists because, with just the point sources they detected, they were unable to account for all emission previously reported at lower frequencies. This issue was later re-investigated with the VLA in a B and C array observation (40 minutes combined) at 330 MHz (Giovannini, Tordi & Feretti, 1999; Giovannini & Feretti, 2000). This observation detected no extended flux in the central regions of this cluster. We note however that the short integration times obtained at 330 MHz would provide very poor -coverage which could easily lead to missing large scale structure in the maps.
2 Results
2.1 The Data and Reduction Methods
VLA C-array observations of A754 were conducted on March 21, 2000 simultaneously at 330 MHz and 74 MHz. The observational parameters are summarized in Table 1. At both frequencies, observations were conducted in spectral line mode to reduce the effects of bandwidth smearing and allow for more accurate and less costly radio frequency interference (RFI) excision. Ultimately 8% and 23% of the data were flagged at 330 MHz and 74 MHz, respectively. Cygnus A was used as a flux density, bandpass, and initial phase calibrator, and we estimate flux densities we quote as accurate to . Successive loops of self-calibration (AIPS task CALIB) and non-coplanar, wide-field image deconvolution (AIPS task IMAGR) were used to mitigate confusion and achieve maximum sensitivity in our images (Perley, 1999). The realized rms sensitivities of mJy/beam and mJy/beam at 330 and 74 MHz, respectively, are both approximately ten times higher than the expected thermal noise levels. We attribute the difference to a combination of confusion and poorly understood, broad-band, mainly VLA-generated RFI which especially affects low-frequency observations in the compact C and D configurations.
| Frequency (MHz) | 330 | 74 |
|---|---|---|
| Bandwidth (MHz) | 3 | 1.5 |
| Data Type | 128 chan. | 64 chan. |
| 1 IF | 1 IF | |
| RR&LL | RR&LL | |
| Time on Source (hours) | 3 | 3 |
| Restoring Beam | ||
| RMS Sensitivity (mJy/beam) | 6.5 | 200 |
2.2 The Radio Halo at 74 MHz and 330 MHz.
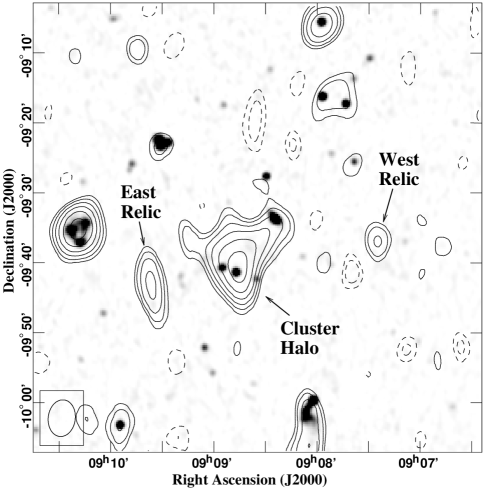
Our 74 MHz and 330 MHz images are presented as contours in Figures 1 and 2, respectively, while a 1.4 GHz image from the NRAO VLA sky survey (NVSS:Condon et al. (1998)) is superimposed on Figure 1 as grey-scale. At both frequencies we detect extended emission in the central region of the cluster which is consistent with a radio halo, although the 5’ resolution at 74 MHz is clearly too poor on its own to distinguish between genuine halo-emission and a blend of point source emission. However, analysis of the 74 MHz image in conjunction with information from the 330 MHz and 1.4 GHz data indicates that there is clearly excess 74 MHz emission beyond just a blending of the four main NVSS point sources in the halo region. To estimate their 74 MHz contribution we determined their spectral indices between 330 MHz and 1.4 GHz and extrapolated these to 74 MHz. The prediction for the combined flux density of these four point sources at 74 MHz is 2.9 Jy, while we detect 7 Jy of emission at the cluster center. Therefore we detect an excess of about 4 Jy of 74 MHz flux in addition to the point sources.
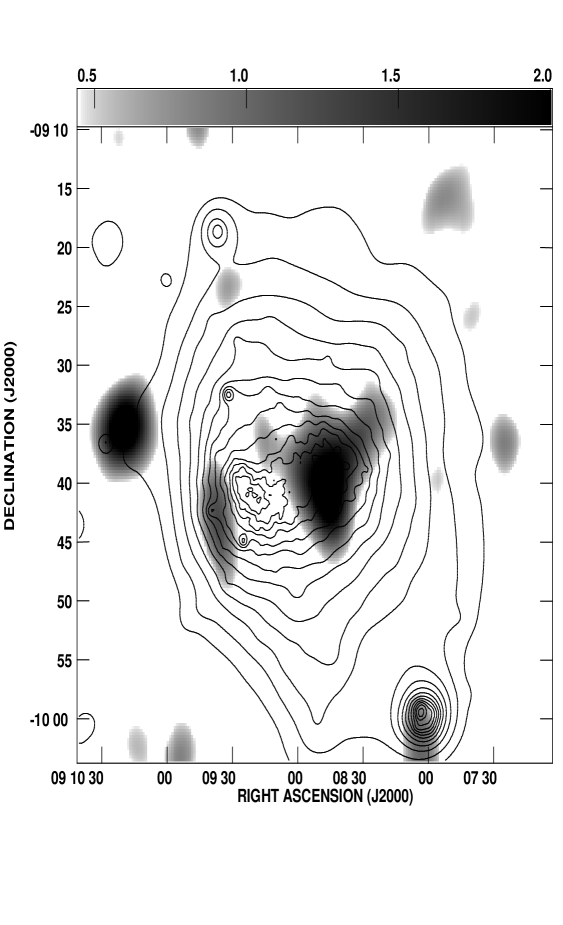
The case for extended emission is even stronger at 330 MHz (Figure 2) where the resolution is sufficient to clearly separate the brightest point sources from the diffuse emission in the region. Apart from the four main point sources, we measure a total of 750 mJy of flux density in the region. Of course it is possible that even this emission is made up of a blending of even more faint point sources in the center of the cluster which are undetected at 1.4 GHz, and close inspection of the NVSS image does suggest more faint point sources in the region (Figure 3). However, there are regions of the halo which appear strongly at 330 MHz but not at all at 1.4 GHz. If we examine region A which we define in Figure 2, the fact that it has a peak flux density of 49 mJy/beam yet contains no observable flux at 1.4 GHz requires a spectral index of at least 1.5, . Taking the halo as a whole, our estimates of 4 Jy at 74 MHz and 750 mJy at 330 MHz indicate a spectral index of . This is unusual for point sources associated with radio galaxies. The four brighter point sources all have spectral indices ranging from 0.5 to 1.0. We therefore assert that while some of this emission could be due to point sources, a significant fraction corresponds to a diffuse cluster radio halo with 3 major and minor axes of , respectively. At the redshift of the cluster this corresponds to a scale of kpc, a factor of 2-3 smaller than the largest known giant Mpc halos but still not the smallest halo known (Feretti, 1999). From our 330 MHz image we estimate the halo center at ,, indicating it is shifted westward of the X-ray maximum and also of the cluster center, which we place at , with reference to an elliptical beta-model fit. We note that the =1.1 spectrum of the diffuse emission we infer is consistent with previous estimates (Harris et al., 1980) though the total flux levels are still somewhat () lower than predicted.
Initially puzzling, 330 MHz observations by Giovannini & Feretti (2000) at comparable rms noise failed to detect the halo emission. However, a plausible explanation emerges in light of the fundamentally different spatial characteristics of the two data sets. Our observations were 3 hours in the VLA C array, while theirs was a combination of B and C array snapshots (40 min total) with consequently less thorough coverage. A possible explanation is therefore that their superior resolution provided by B-array baselines sets a lower basic confusion level and thus provided a nominal sensitivity comparable to our longer, lower resolution integration. However, their snapshot C array coverage would at the same time have been much less sensitive to the large-scale extended emission we detect. Indeed imaging of a snapshot sub-section of our own C array data failed to detect the halo.
2.3 Discovery of Radio Relics at 74 MHz.
Our 74 MHz image (Figure 1) reveals two, newly detected objects without counterparts at either 330 MHz or 1.4 GHz which we label as the “East Relic” and “West Relic” (see Table 2). While the (integrated flux Jy) and ( mJy, unresolved) detections are weak, it is nevertheless highly unusual to detect sources at 74 MHz which are not also seen by the VLA at either 330 MHz or 1.4 GHz. In fact all other objects in a 4 74 MHz image that appear at the brightness of the fainter West Relic or higher have clear counterparts in the 1.4 GHz NVSS images, and 330 MHz counterparts within the radius region in which the 74 and 330 MHz fields of view overlap. This suggests an unusually high spectral index for these objects. In order to explain the lack of a detection at above three times the rms sensitivity in the 330 MHz or 1.4 GHz images, the “East Relic” would need a spectral index of at least 1.8 or 1.4 respectively. Such high spectral indices are typical of cluster radio relics.
| Object | Peak | Position (J2000) | |
|---|---|---|---|
| ID | Jy/beam | RA | DEC |
| East Relic | 1.25 | ||
| West Relic | 0.85 | ||
There is further evidence that these objects detected at 74 MHz are indeed radio relics. First the morphology of the “East Relic”, with an elongation perpendicular to its separation from the cluster X-ray maximum is highly suggestive of a relic. Its major and minor axes are , respectively, which corresponds to scale sizes of kpc at the redshift of the cluster. The reality of the mainly unresolved “West Relic” is clearly much more speculative, though it is noteworthy that its location with respect to the cluster X-ray maximum is opposite to that of the “East Relic”. An overlay of the positions of these relics with ROSAT hard X-ray data (Figure 4) reveals that the East relic falls exactly at the location of flattened, compressed X-ray contours. Such a rapid gradient in X-ray surface brightness is expected at the location of merger shock waves. Further, Roettiger, Stone & Mushotzky (1998) have predicted locations of shock waves based on their model of the cluster merger in A754, and it is especially noteworthy that the location of the East relic coincides with a jump in the X-ray temperature predicted for the shock waves in this cluster. We note however that the signal-to-noise ratio on both of these new objects is still very low and thus the objects (the West relic in particular) should be regarded with caution. We plan to undertake deep follow-up observations of these sources with the VLA at higher resolution to confirm these detections and provide tighter constraints on their spectra. Additional follow-up observations will be undertaken to identify the compact X-ray source located at the position of the East relic and determine if the two objects are connected.
3 Discussion
In the numerical model of Roettiger, Stone & Mushotzky (1998) a large subcluster (cluster to subcluster mass ratio 2.5:1) has passed from East to West slightly off-axis from the core of the A754 system. This merger event results in the formation of two shock waves which are visible as temperature jumps in Fig. 2a of their work. The Eastern shock heats the infalling, stripped subcluster gas in a relatively small area. The location of this shock at the ram pressure flattened edge of the X-ray peak is coincident with the observed location of the East relic source. The western shock heats the outer regions of the main cluster ICM and is much more extended. In principle, this shock could have caused the West relic, but we note that the West relic is further away from A754’s X-ray peak () than the shock wave in the numerical model (). The measured (Henry & Briel, 1995; Henriksen & Markevitch, 1996) and simulated (Roettiger, Stone & Mushotzky, 1998) temperature maps show that mainly the outer western region is heated by this shock wave, but not the innermost cluster core region.
The temperature variation suggests that the impact of the infalling gas combined with the change in the gravitational potential of the primary cluster due to the core passage of the dark matter subcluster was not violent enough to produce a shock wave in the dense main cluster core. The core was only compressed adiabatically, and relaxed nearly to its original temperature in a later merger stage. When the impact moved into outer, less dense regions, a shock wave was created and heated the gas non-adiabatically. Such emergence of outgoing shock waves is observed in numerical simulations of cluster merger events (Schindler, private communication).
A fraction of the energy dissipated in shock waves is often transfered into relativistic particle populations. Accelerated relativistic electrons have short radiative lifetimes ( Gyr) and should therefore produce the radio relic emission close to the current location of the shock waves. The electron acceleration required to produce the relic emission could result from Fermi-I diffusive shock acceleration of ICM electrons (Enßlin et al., 1998; Roettiger et al., 1999b), or adiabatic energization of relativistic electrons confined in fossil radio plasma, released by a former active radio galaxy (Enßlin & Gopal-Krishna, 2001).
Observationally, the radio halo of A754 appears to be displaced from the main cluster core in the direction of the West relic. This suggests that the halo emission results only from regions which were heated by the re-emerging western shock wave after core passage. Since the radiative cooling time of the radio halo electrons observed at 330 MHz is smaller than 0.3 Gyr, but the shock passage was more than 0.3 Gyrs ago (at least in the numerical model), the radio electrons must have been re-populated after shock passage. In situ Fermi II re-acceleration (powered by some residual plasma turbulence after the shock passage) of shock accelerated electrons could be able to re-accelerate the electrons (Brunetti et al., 2001), if the turbulence is able to remain for a few 100 Myr. Alternatively, relativistic protons might be efficiently accelerated at shock waves and would have lifetimes comparable to the cluster age. Since these protons can seed relativistic electrons and positrons into the ICM by hadronic collisions with the ICM ions, they might be responsible for the radio halo emission which glows for a long time after the shock passage (Dennison, 1980; Vestrand, 1982; Blasi & Colafrancesco, 1999; Dolag & Enßlin, 2000). This process would only be efficient in the dense cluster core regions and thus is likely not important to the formation of peripheral radio relics.
The above scenarios are speculative but make clear predictions which further observations can confirm. First, further observations can reveal that either or both of the relic structures are real. Second, we expect a high degree of source-intrinsic radio polarization in the East relic, due to the nearly perpendicular line of sight to the shock compression direction. The compressed magnetic fields should be roughly aligned with the shock plane and relic major axis, thus the synchrotron emission should be highly polarized. For the West relic, the geometry is less constrained, but polarization is also very likely.
Further, the steep spectral index of the East relic can be understood, but would likely have different spectral curvature, in the two relic formation models. In the Fermi I shock acceleration model a low Mach number shock would produce a steep power-law radio spectrum (Mach number for a spectral index steeper than 1.8). In the revived fossil radio plasma model the steep spectrum would be a synchrotron/inverse Compton cooling cut off, which was shifted by the shock compression close to the observed frequency. Additional information on the spectral curvature of the relics might therefore help to discriminate these two scenarios.
Finally, if radio halos occur only in the shocked ICM – as A754 seems to indicate –, then one would expect a spatial correlation of shock-heated gas and diffuse synchrotron emission in other clusters which are in the early stages of major merger events. Such a correlation could be observable with high-resolution observations from X-ray satellites such as Chandra. At later merger stages, the turbulent gas motion, which is stirred by the violently relaxing dark matter cores, should have erased many of the temperature and radio halo substructures.
The hypothesis that radio halos occur only in shocked ICM could explain why the post merger cluster A3667 has no radio halo, despite the fact that two giant cluster radio relics (Röttgering et al., 1997) indicate the presence of peripheral merger shock waves (Enßlin et al., 1998). In this case the main cluster core seems to be unshocked (Roettiger et al., 1999b, see temperature map in their Fig. 3) because the merger was likely less violent. There only a mass ratio of the merging clusters of 5:1 is needed in order to reproduce its X-ray morphology, compared to 2.5:1 for A754 (Roettiger, Stone & Mushotzky, 1998). In the re-acceleration scenario (Brunetti et al., 2001), the shock waves would have either injected energetic electrons only in peripheral, low magnetic field regions, so that no radio halo occurs, or the necessary re-acceleration turbulence has decayed in the late merger state of A3667 (1 Gyr after core passage). The re-acceleration model can be tested due to the high energy cutoff expected in the radio electron spectrum at energies where the cooling time-scale is shorter than the acceleration time-scale. A stronger halo suppression can be expected in the scenario of radio halo electrons being produced by shock accelerated protons. In this scenario the shock waves in A3367 would have emerged at radii which were too peripheral to host a sufficiently dense thermal proton population required as targets for the hadronic secondary electron production to operate efficiently – in addition to the weaker radio emissivities there due to weaker magnetic fields . The hadronic halo scenario will be tested with the next generation Gamma ray telescopes for the unavoidable Gamma radiation from neutral pion decays following hadronic proton proton collisions (Vestrand, 1982; Enßlin et al., 1997; Colafrancesco & Blasi, 1998; Blasi, 1999; Dolag & Enßlin, 2000).
4 Conclusions
A754 has been successfully imaged at both 330 MHz and 74 MHz. We conclude these images strongly suggest the existence of both a radio halo and at least one and possibly two radio relics in this galaxy cluster. This finding is especially relevant in light of recent observational and theoretical evidence in favor of a merger-relic connection. Deeper 74 and 330 MHz imaging at higher resolution are clearly warranted to confirm the extended nature of the radio halo and the relic detections. These observations suggest that further study of this system and similar ones at low frequencies will open a new window of understanding on cluster dynamics and cluster formation.
5 Acknowledgments
The authors would like to thank Kurt Roettiger for extensive help with the observations and at early stages of the project. We also thank Rick Perley and Frazer Owen for useful discussions, as well as our anonymous referee whose comments and suggestions improved our paper. NEK also thanks D. Harris and L. Feretti for the Ringberg Castle invitation which inspired the project. We have made use of the ROSAT Data Archive of the Max-Planck-Institut für extraterrestrische Physik (MPE) at Garching, Germany. Basic research in radio astronomy at the Naval Research Laboratory is funded by the Office of Naval Research.
References
- Abell, Corwin & Olowin (1989) Abell, G.O., Corwin, H.G., & Olowin, R.P. 1989, ApJS, 70, 1
- Arnaud et al. (2000) Arnaud, M., Aghanim, N., Gastaud, R., Neumann, D.M., Lumb, D., Briel, U., Altieri,B., Ghizzardi, S., Mittaz, J., Sasseen, T.P., & Vestrand, W.T. 2000, astrp-ph/0011086
- Bird (1994) Bird, C.M. 1994, AJ, 107, 1637
- Blasi (1999) Blasi, P. 1999, ApJ, 525, 603
- Blasi & Colafrancesco (1999) Blasi, P., & Colafrancesco, S. 1999, Astroparticle Physics, 12, 169
- Brunetti et al. (2001) Brunetti, G., Setti, G., Feretti, L., & Giovannini, G. 2001, MNRAS, 320, 365
- Colafrancesco & Blasi (1998) Colafrancesco, S., & Blasi, P. 1998, Astroparticle Physics, 9, 227
- Condon et al. (1998) Condon, J.J., Cotton, W.D., Greisen, E.W., Yin, Q.F., Perley, R.A., Taylor, G.B., & Broderick, J.J. 1998, AJ, 115, 1693
- Dennison (1980) Dennison, B. 1980, ApJ, 239, L93
- De Young (1992) De Young, D.S. 1992, ApJ, 386, 464
- Dolag & Enßlin (2000) Dolag, K. & Enßlin, T.A. 2000, A&A, 362, 151
- Enßlin & Gopal-Krishna (2001) Enßlin, T.A., Gopal-Krishna 2001, A&A, 366, 26
- Enßlin et al. (1998) Enßlin, T.A., Biermann, P.L., Klein, U., & Kohle, S. 1998, A&A, 332, 395
- Enßlin et al. (1997) Enßlin, T.A., Biermann, P.L., Kronberg, P.P., & Wu, X.-P. 1997, ApJ, 477, 560
- Feretti (1999) Feretti, L. 1999, in “Diffuse Thermal and Relativistic Plasma in Galaxy Clusters”, eds. H. Böhringer, L. Feretti, and P. Schuecker, MPE Report 271, 3
- Feretti & Giovannini (1996) Feretti, L. & Giovannini, G. 1996, IAU Symp. 175: Extragalactic Radio Sources, 175, 333
- Giovannini & Feretti (2000) Giovannini, G. & Feretti, L. 2000, New Astronomy, 5, 335
- Giovannini et al. (1993) Giovannini, G., Feretti, L., Venturi, T., Kim, K.-T., & Kronberg, P.P. 1993, ApJ, 406, 399
- Giovannini, Tordi & Feretti (1999) Giovannini, G., Tordi, M., & Feretti, L. 1999, New Astronomy, 4, 141
- Harris et al. (1980) Harris, D.E., Pineda, F.J., Delvaille, J.P., Schnopper, H.W., Costain, C.H., & Strom, R.G. 1980, A&A, 90, 283
- Henriksen & Markevitch (1996) Henriksen, M.J., & Markevitch, M.L. 1996, ApJ, 466, L79
- Henry & Briel (1995) Henry, J. P. & Briel, U. G. 1995, ApJ, 443, L9
- Mills, Hunstead & Skellern (1978) Mills, B. Y., Hunstead, R. W. & Skellern, D. J. 1978, MNRAS, 185, 51P
- Jaffe (1977) Jaffe, W. J. 1977, ApJ, 212, 1
- Perley (1999) Perley, R.A. 1999, in Synthesis Imaging in Radio Astronomy II, eds. G.B. Taylor, C.L. Carilli, and R.A. Perley (San Francisco: PASP), 383-400
- Roettiger, Stone & Mushotzky (1998) Roettiger, K., Stone, J. M. & Mushotzky, R. F. 1998, ApJ, 493, 62
- Roettiger et al. (1999a) Roettiger, K., Stone, J. M. and K., Burns, J. O. 1999a, ApJ, 518, 594
- Roettiger et al. (1999b) Roettiger, K., Burns, J. O. and Stone, J. M. 1999b, ApJ, 518, 603
- Röttgering et al. (1997) Röttgering, H. J. A., Wieringa, M. H., Hunstead, R. W. & Ekers, R. D. 1997, MNRAS, 290, 577
- Tribble (1993) Tribble, P.C. 1993, MNRAS, 263, 31
- Vestrand (1982) Vestrand, W.T. 1982, AJ, 87, 1266
- Vikhlinin, Markevitch, & Murray (2000a) Vikhlinin, A., Markevitch, M., & Murray, S.S. 2000, astro-ph/0008496
- Vikhlinin, Markevitch, & Murray (2000b) Vikhlinin, A., Markevitch, M., & Murray, S.S. 2000, astro-ph/0008499
- Wielebinski et al. (1977) Wielebinski, R., Waldthausen, H., Kronberg, P. P. & Haslam, C. G. T. 1977, Nature, 266, 239
- Zabludoff & Zaritsky (1995) Zabludoff, A.I., and Zaritsky, D. 1995, ApJ, 447, L21