ROSAT X-ray sources in the field of the LMC
We analyzed a sample of 26 background X-ray sources in a 60 square degree field of the Large Magellanic Cloud observed with the ROSAT PSPC. The sample has been selected from previously classified and optically identified X-ray sources. In addition pointlike and spectrally hard sources with at least 100 to 200 observed counts have been used for the analysis. We performed X-ray spectral fitting and derived total hydrogen absorbing column densities due to LMC gas in the range . We compared these columns with the H i columns derived from a 21-cm Parkes survey of the LMC. For 7 optically identified sources we find, within the uncertainties derived from the X-ray spectral fit, agreement for both columns. For further 19 sources we constrain the LMC columns from the X-ray spectral fit assuming that the powerlaw photon index is that of AGN type spectra. We derive for 20 sources gas columns which are within the uncertainties in agreement with the H i columns. We derive for two background sources (RX J0536.9-6913 and RX J0547.0-7040) hydrogen absorbing column densities due to LMC gas, which are in excess to the H i columns. These sources - located in regions of large () LMC H i column densities - could be seen through additional gas which may be warm and diffuse, cold or molecular. For 10 sources we derive upper limits for the gas columns additional to H i and constrain the molecular mass fraction to %.
Key Words.:
galaxies: individual: LMC – galaxies: active – galaxies: ISM – radio continuum: galaxies – X-rays: galaxies1 Introduction
The study of the interstellar medium (ISM) in the Large Magellanic Cloud (LMC) is of prime interest for the understanding of star formation and stellar evolution under different chemical conditions. A lower metal content of the interstellar medium results most likely in a smaller amount of molecules in the ISM, thus reducing or at least affecting the star formation efficiency. Studies of the properties of the ISM of the LMC have been made through observational work by Cohen et al. (1988) in CO with a spatial resolution of 12′ . A 12CO survey of the LMC with a resolution of 2.′6 has been performed with NANTEN (Fukui et al. 1999; Mizuno et al. 1999). Luks & Rohlfs (1992) and Luks (1994) made 21-cm surveys of the LMC with the Parkes radio telescope with an angular resolution of 15′. Dickey et al. (1994) made a 21-cm absorption survey of the Magellanic system with the Australia Telescope Compact Array (ATCA) towards a sample of 30 lines of sight and detected 21-cm absorption in 19 cases. Kim et al. (1998, 1999) obtained H i aperture synthesis mosaics of the LMC with a resolution of 1′ using the ATCA telescope. The cool gas phase of the LMC gas in the 30 Dor, LMC 4 and the eastern H i boundary of the LMC has been studied by Marx-Zimmer et al. (2000).
X-ray background point sources like active galactic nuclei (AGN) and quasars (QSO) can be used to probe the gas columns of a “foreground” galaxy like the LMC by measuring the X-ray absorption or the hydrogen column density in the line of sight between the AGN or QSO and the observer. From X-ray observations the total absorbing column density in the line of sight of the AGN is derived. It is required that the contribution to the X-ray absorption due to the Milky Way (the galactic component) is inferred from other information (e.g. 21-cm H i surveys covering the Magellanic Clouds). Also it has to be assumed that there is no intrinsic absorption due to the AGN and also no absorbing gas between the LMC and the AGN.
Recent studies of the X-ray spectra of AGN and QSO have shown that most of these spectra can be well described by a single powerlaw model with a powerlaw index which is confined to a narrow range of values. Using a large number of observations from different missions like EXOSAT, ROSAT and ASCA it has been found that AGN and QSO may all have the same powerlaw photon indices (cf. Brinkmann & Siebert 1994; Schartel et al. 1996a,b; Brinkmann et al. 1997; Laor et al. 1997; Sambruna et al. 1999; George et al. 2000; Brinkmann et al. 2000). However in several works a dependence of the powerlaw photon index on the energy band has been found. The detectors (LE and ME used with EXOSAT, PSPC with ROSAT, and SIS and GIS used with ASCA) cover different energy ranges of 0.1 – 20 keV, 0.1 – 2.4 keV, and 2 – 10 keV respectively. The ROSAT PSPC covers the softest spectral band and especially in this band somewhat steeper powerlaw photon indices have been derived.
In a related article (Kahabka et al. 2001, hereafter Paper II) the sample of classified spectrally hard X-ray sources in the field of the LMC was extended by making use of a theoretical color – color diagram (the – plane) derived from simulations. A tentative classification for a large fraction of the spectrally hard X-ray sources was made in the central 20′ of the ROSAT PSPC detector which have been detected by Haberl & Pietsch (1999, hereafter HP99) in a 10∘ 10∘ field of the LMC.
Here we investigate the spectral energy distribution of the X-ray point sources toward the LMC to derive the total gas column density of the LMC for different lines of sight. We compare the X-ray derived LMC gas columns with the gas columns derived from 21-cm radio observations performed with the Parkes and ATCA radio telescopes. From comparison of the X-ray derived total hydrogen column and the 21-cm (atomic) hydrogen we deduce constraints on the content of molecular hydrogen.
2 The AGN sample
Several background AGN in the field of the LMC have been identified in the sample of X-ray sources detected in Einstein and ROSAT observations during optical follow-up observations (Cowley et al. 1984; Schmidtke et al. 1994; Crampton et al. 1997; Cowley et al. 1997; Schmidtke et al. 1999; Tinney 1999). One ROSAT PSPC source, RX J0515.1-6511, has been identified by HP99 with an optical galaxy from the sample of 96 galaxies behind the LMC which are brighter than V=16.5 (Gurwell & Hodge 1990).
In addition during recent radio surveys of the Magellanic Clouds (and in particular of the LMC) discrete radio sources have been detected and in part classified as background sources by Dickey et al. (1994), Marx et al. (1997, hereafter MDM97) and Filipović et al. (1998a,b).
The sample of X-ray selected background AGN has been extended by HP99 by correlating the catalog of ROSAT PSPC X-ray sources in the field of the LMC with optical and radio catalogs. Additional candidate AGN in the field of the LMC have been found by Sasaki et al. (2000, hereafter SHP00) by comparing ROSAT PSPC X-ray sources with ROSAT HRI X-ray sources which are contained in their ROSAT HRI LMC catalog. We note that we could detect one of the unclassified LMC HRI sources (RX J0536.9-6913) in one of our merged PSPC observations. The source correlates with a radio source of Dickey et al. (1994) and MDM97. It has recently been studied in detail with the Epic-PN detector of XMM-Newton and is a strong candidate for a background AGN (Haberl et al. 2001).
In addition we investigated the 35 sources classified as [hard] by HP99. We find that 10 of these sources are consistent with pointlike and spectrally hard sources which we classify as AGN. They have 200 to 800 observed counts and have been used in this work for X-ray spectral fitting. Two further sources (RX J0530.1-6551 and RX J0524.2-6620) are consistent with X-ray binaries. This classification is confirmed by making use of simulated powerlaw tracks in a color – color diagram (the – plane, cf. Paper II). Further 8 sources have 150 observed counts and have not been used for X-ray spectral fitting. The remaining sources have been found to be either extended or too faint for a spectral analysis.
The AGN sample used is given in Table 1.
| ROSAT name | Other name | Type | References | ||||||
|---|---|---|---|---|---|---|---|---|---|
| RX J | Ein | HP | SHP | MDM | () | and notes | |||
| (1) | (2) | (3) | (4) | (5) | (6) | (7) | (8) | (9) | (10) |
| 0436.2-6822 | 653 | galaxy? | 4.3 | 1; a | |||||
| 0454.1-6643 | 411 | 10 | 18.2 | 0.228 | AGN | 3.9 | 1–4 | ||
| 0503.1-6634 | CAL F | 380 | 20 | 16.8 | 0.064 | AGN Sy1 | 3.9 | 1–3,5,6,16 | |
| 0509.2-6954 | CAL 16 | 1040 | 18.5 | 0.175 | AGN Sy1 | 6.2 | 1,7 | ||
| 0510.4-6737 | 559 | 49 | AGN | 4.5 | 1,3,b | ||||
| 0515.1-6511 | 100 | galaxy | 4.2 | 1,21; c | |||||
| 0516.6-7237 | 1367 | radio, AGN? | 6.7 | 1,8,14; d | |||||
| 0517.3-7044 | CAL 21 | 86 | 18.2 | 0.169 | AGN | 5.8 | 2,3; e | ||
| 0522.7-6928 | 931 | 112 | [hard] | 6.2 | 1,3; f | ||||
| 0523.2-7015 | 1109 | 116 | [hard] | 6.8 | 1,3; f | ||||
| 0524.0-7011 | CAL 32 | 1094 | 124 | 17.7 | 0.151 | AGN Sy | 5.1 | 1–3,6,7,9 | |
| 0528.8-6539 | 147 | 181 | [hard] | 4.6 | 1,3; f | ||||
| 0529.0-6603 | 233 | AGN? | 4.6 | 1; f | |||||
| 0530.1-6551 | 183 | 205 | XRB ? | 4.6 | 1,3; b,f | ||||
| 0531.5-7130 | CAL 46 | 1279 | 220 | 19.2 | 0.221 | AGN Sy | 5.2 | 1–4,6,7,9 | |
| 0532.0-6919 | 876 | 224 | 18.8 | 0.149 | AGN Sy1 | 4.8 | 1–3,6 | ||
| 0532.4-6406 | 44 | Galaxy group | 4.7 | 1; g | |||||
| 0532.9-7040 | CAL 51 | 1178 | 53 | radio | 4.8 | 1,5,7; f | |||
| 0534.0-7145 | 13.8 | 0.024 | S0 galaxy | 5.6 | 2,4; e | ||||
| 0534.1-7018 | 1124 | 250 | [hard] | 5.7 | 1,3,f | ||||
| 0534.1-7037 | 1169 | 57 | radio | 4.8 | 1,5 | ||||
| 0534.6-6738 | 561 | 17.8 | 0.072 | AGN | 4.6 | 1,2,7,10; h | |||
| 0536.0-7041 | 1181 | 272 | [hard] | 4.8 | 1,3,7; f | ||||
| 0536.9-6913 | 280 | 65 | radio | 5.0 | 3,5 | ||||
| 0540.3-6241 | 1 | AGN | 4.4 | 1 | |||||
| 0541.6-6511 | 101 | [hard], galaxy? | 4.5 | 1 | |||||
| 0546.0-6415 | 54 | 0.323 | QSO | 3.7 | 1,17; i | ||||
| 0546.8-6851 | 747 | 364 | AGN | 5.6 | 1,3,7; b,j | ||||
| 0547.0-7040 | 1179 | [hard] | 7.3 | 1,7; f,k | |||||
| 0547.8-6745 | 100 | 20.5 | 0.390 | radio, AGN | 4.8 | 2,5,12; e | |||
| 0548.4-7112 | 1247 | 376 | [hard] | 6.4 | 1,3; f | ||||
| 0550.5-7110 | 1243 | 385 | 19.9 | 0.443 | AGN Sy | 6.7 | 1–3 | ||
| 0550.6-6637 | CAL 91 | 17.0 | 0.076 | AGN Sy | 4.2 | 2,9; e | |||
| 0552.3-6402 | 37 | 389 | AGN | 3.7 | 1,3,19; l | ||||
| 0601.1-7036 | 1166 | AGN | 7.0 | 1,11,18; m | |||||
| 0602.9-7102 | 1231 | 0.079 | AGN Liner | 7.2 | 1,15; n | ||||
| 0603.3-7043 | 1189 | AGN | 7.8 | 1 | |||||
| 0606.0-7042 | 1184 | 87 | [AGN], galaxy? | 6.8 | 1,3,19; o | ||||
| 0607.6-6651 | 433 | galaxy? | 4.8 | 1,13; p | |||||
References
(1) Haberl & Pietsch 1999;
(2) Crampton et al. 1997;
(3) Sasaki et al. 2000;
(4) Schmidtke et al. 1999;
(5) Marx et al. 1997;
(6) Schmidtke et al. 1994;
(7) Wang et al. 1991;
(8) White et al. 1991;
(9) Cowley et al. (1994);
(10) Cowley et al. 1997;
(11) White et al. 1987;
(12) Tinney 1999;
(13) Moran et al. 1996;
(14) Ma et al. 1998;
(15) Strauss et al. 1992;
(16) Hewitt & Burbidge (1992);
(17) Perlman et al. 1998;
(18) Dickey et al. 1994;
(19) Wright et al. 1994;
(20) Boller at al. 1992;
(21) Gurwell & Hodge 1990.
Notes to Table 1
a – Extended X-ray source; optical galaxy (Digital Sky Survey) in
X-ray error circle.
b – or X-ray binary (XRB).
c – Two optical galaxies are in the X-ray error circle (GH 7–20, type E2,
V=16.3 and GH 7–19, type S0, V=12.8, Gurwell & Hodge 1990).
d – X-ray source coincides with the radio source PKS 0517–726
(Ma et al. 1998).
e – AGN which have not been observed during pointed ROSAT PSPC
observations and have not been analyzed in this work.
f – Unclassified hard X-ray source.
g – X-ray source coincides with the optical galaxy AM 0532–640 and
IRAS F05322-6409.
h – Coincides with the Einstein source 2E 0534.8-6740.
i – X-ray source coincides with the quasar [VV2000] J054641.8-641522
(Perlman et al. 1998).
j – Coincides with the Einstein source 2E 0547.2-6852.
k – X-ray source also coincides with the Carbon star LMC–BM 42–26
(Blanco & McCarthy 1990).
l – X-ray source coincides with the radio source PKS 0552–640
(Wright et al. 1994).
m – X-ray source coincides with the radio quasar 0601-706 = PKS 0601–705
(Dickey et al. 1994; White et al. 1987). No 21-cm absorption has been
found for 0601-706 from the ATCA study of the source.
n – Coincides with the IRAS 06035–7102 source, a Liner type AGN with
B=15.6 (Strauss et al. 1992).
o – X-ray source coincides with the radio source PMN J0606–7041
(Wright et al. 1994).
p – Coincides with the IRAS galaxy RX J060740-66516 (Moran et al. 1996;
Boller et al. 1992).
3 Observations
The observations of the general LMC area were carried out with the PSPC detector of the ROSAT observatory from 1991 till 1998. They have been retrieved from the public ROSAT archive at the Max-Planck-Institut für extraterrestrische Physik (MPE). The satellite, X-ray telescope (XRT) and the focal plane detector (PSPC) are described in detail in Trümper (1983) and Pfeffermann et al. (1987). For each AGN given in Table 1 (excluding those AGN which have not been observed with ROSAT PSPC) we determined all ROSAT PSPC observations in a 2∘ 2∘ field centered on the AGN and merged all observations for which the AGN was observed at an off-axis angle of 50′ by using standard EXSAS procedures (Zimmermann et al. 1994).
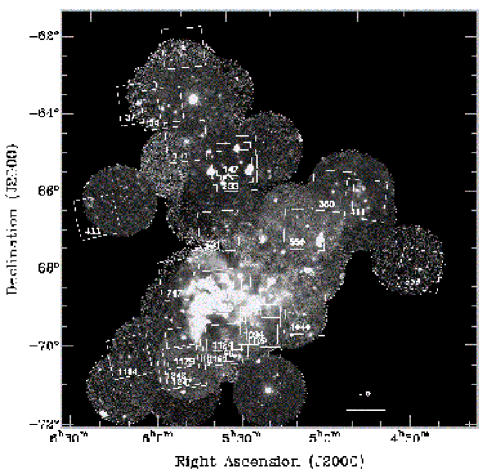
In Fig. 1 we show a merged image of 533 ksec exposure of the ROSAT PSPC observations of the LMC field. Time intervals with a high particle background rate have been removed by selecting data with a master veto rate in the interval 10 to 170 (cf. Snowden et al. 1995). In addition time intervals with a large soft (channel 11–41) X-ray count rate above the mean (by more than ) have been excluded. Such events may e.g. be due to scattered solar X-rays (cf. Kerp 1994). The image is generated in the energy band 0.4 – 1.3 keV and it has a binsize of 100″. It shows the brighter X-ray sources and the distribution of the hot diffuse X-ray flux and X-ray dark regions (X-ray shadows). We overlayed on the image with square boxes of 1∘ 1∘ the fields in which AGN have been analyzed (AGN for which X-ray spectral fitting has been performed in Sect. 4, which are included in Tab. 2 and which are not flagged with ).
We analyzed 139 ROSAT PSPC observations with exposure times of at least 1000 sec each in a 10∘ 10∘ field covering the LMC. For most of the X-ray sources which we analyzed it was required to merge several observations.
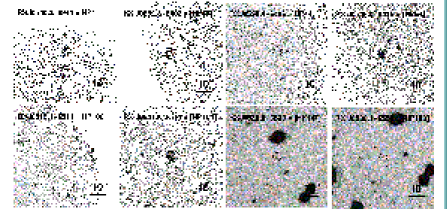
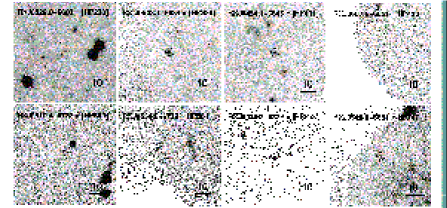
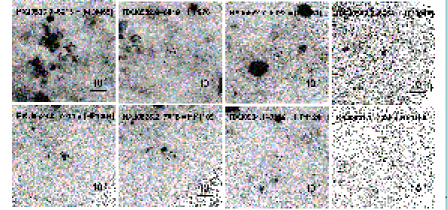
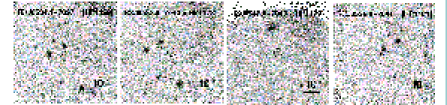
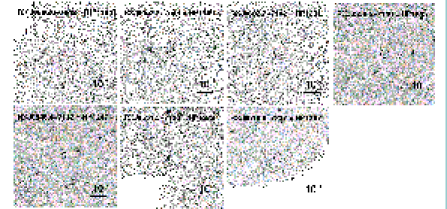
In Fig. 2 we show the exposure corrected images (0.1 – 2.0 keV) of the merged data centered on 35 AGN which have been observed with ROSAT PSPC and which are given in Table 1. In these images different observations have been merged during which the AGN was at different off-axis angles in the detector. As observations for which the AGN was at an off-axis angle 50′ have not been used these images may differ somewhat from the overall image in Fig. 1 which is made from all observations.
It is obvious that many additional point sources are in the total field, sometimes also close to the AGN. We note that most of these additional point sources are contained in the ROSAT PSPC catalog of the LMC of HP99.
4 X-ray spectral fits and gas absorption
| Name | Number | Source | Extract | Exposure |
|---|---|---|---|---|
| RX J | Obs. | countsa | radius (′) | ( sec) |
| 0436.2-6822 | 2 | 23530 | 6.4 | 5.0 |
| 0454.1-6643 | 4 | 95148 | 2.1 | 50.8 |
| 0503.1-6634 | 4 | 317391 | 4.2 | 50.8 |
| 0509.2-6954 | 3 | 54631 | 2.1 | 12.4 |
| 0510.4-6737 | 4 | 15836 | 2.3 | 26.2 |
| 0516.6-7237b | 2 | 11149 | 5.0 | 24.1 |
| 0522.7-6928 | 25 | 26552 | 1.5 | 114.6 |
| 0523.2-7015 | 25 | 30746 | 1.7 | 91.6 |
| 0524.0-7011 | 21 | 367983 | 2.1 | 80.2 |
| 0528.8-6539 | 25 | 80168 | 2.1 | 105.3 |
| 0529.0-6603 | 25 | 37359 | 1.7 | 117.2 |
| 0530.1-6551 | 25 | 55459 | 1.7 | 117.2 |
| 0531.5-7130b | 3 | 613 | 5.0 | 35.4 |
| 0532.0-6919 | 12 | 88875 | 1.5 | 124.7 |
| 0532.4-6406b | 10 | 5927 | 2.5 | 21.3 |
| 0532.9-7040b | 6 | 21942 | 2.9 | 28.5 |
| 0534.1-7018 | 18 | 52042 | 1.5 | 88.4 |
| 0534.1-7037 | 6 | 13019 | 1.2 | 28.5 |
| 0534.6-6738 | 9 | 11726 | 3.8 | 16.8 |
| 0536.0-7041 | 6 | 19321 | 1.2 | 28.5 |
| 0536.9-6913 | 25 | 21443 | 0.9 | 180.0 |
| 0540.3-6241 | 2 | 26524 | 5.0 | 3.1 |
| 0541.6-6511 | 3 | 40535 | 2.5 | 7.6 |
| 0546.0-6415 | 5 | 88133 | 2.5 | 7.2 |
| 0546.8-6851 | 8 | 83773 | 5.0 | 42.0 |
| 0547.0-7040 | 3 | 26952 | 2.9 | 37.6 |
| 0548.4-7112 | 3 | 28129 | 1.0 | 43.6 |
| 0550.5-7110b | 2 | 9534 | 1.8 | 35.7 |
| 0552.3-6402 | 2 | 17924 | 5.0 | 3.2 |
| 0601.1-7036b | 1 | 4510 | 1.3 | 6.0 |
| 0602.9-7102b | 1 | 4028 | 5.0 | 6.0 |
| 0603.3-7043b | 1 | 4713 | 1.7 | 6.0 |
| 0606.0-7042 | 2 | 29146 | 3.3 | 12.0 |
| 0607.6-6651 | 2 | 64972 | 3.0 | 20.7 |
a Source counts and errors in counts in amplitude range 11 – 256
and for the given size of the source circle.
b No X-ray spectra fitted.
We extracted the source plus background photon events in a circular region centered on the position of the AGN and the background events from a nearby second circular region using EXSAS procedures. We binned the spectral data with a signal to noise ratio of 3 to 5. We corrected the spectral data for vignetting and dead time using standard EXSAS procedures. We performed a spectral fit only in case the number of source photons was 100 after background subtraction. We verified for a few sources for which a large () absorbing column density is derived that the result of the spectral fitting does not depend on the chosen spectral binning.
In Table 2 we list the number of source photons available for the spectral fit of the individual AGN. RX J0515.1-6511 has not been detected in the ROSAT observations and has not been included in the table. In case the AGN is in an area of hot diffuse LMC gas then the background can be uncertain and depends on the location where the background has been determined.
4.1 Powerlaw with galactic foreground and LMC intrinsic absorption
We fitted the observed X-ray spectral flux with AGN model fluxes in order to characterize the source as well as to find the amount of absorption by gas. For the AGN we adopted a powerlaw spectrum for the X-ray spectral flux (cf. Laor et al. 1997). For the neutral gas we use two different absorption models making use of the photoelectric absorption cross sections given in Balucinska-Church & McCammon (1992) and using cosmic and LMC abundances with reduced metallicities respectively. We used an absorption model with galactic foreground absorption (EXSAS model gamm) and LMC intrinsic absorption using reduced metallicities (EXSAS model gabs). We do not account for gas between the LMC and the AGN and gas intrinsic to the AGN in the spectral fit.
We determined the spectral parameters (the powerlaw photon index and the normalisation of the flux ) in the rest frame of the AGN in case the redshift has been determined (cf. Table 1). But we note that consideration of the low values of the redshift measured for the AGN in the LMC field (z0.5, cf. Table 1) has little effect on the derived spectral parameters (we confirmed this finding for the X-ray brightest optically identified AGN, RX J0524.0-7011).
We used in the spectral fit galactic foreground absorbing columns which we determined from a Parkes survey of the galactic H i in the direction of the LMC (Brüns et al. 2001). The value of varies by a factor of 2 (cf. Table 1).
| Name | a | ||||
|---|---|---|---|---|---|
| RX J | dof | ||||
| (1) | (2) | (3) | (4) | (5) | (6) |
| 0454.1-6643 | -2.0 | 1.9 | 3.9 | 22 | 16.6 |
| 22 | |||||
| 0503.1-6634 | -2.3 | 5.3 | 3.9 | 5.0 | 18.4 |
| 22 | |||||
| 0509.2-6954 | -2.3 | 3.3 | 6.2 | 6 | 9.8 |
| 14 | |||||
| 0524.0-7011 | -2.05 | 4.2 | 5.1 | 6.0 | 78 |
| 68 | |||||
| 0532.0-6919 | -2.15 | 0.58 | 4.8 | 8 | 11.5 |
| 12 | |||||
| 0534.6-6738 | -1.7 | 1.8 | 4.6 | 0 | 10.8 |
| 11 | |||||
| 0546.0-6415 | -2.0 | 10.4 | 3.7 | 1.2 | 16.6 |
| 25 |
a In the rest frame of the AGN.
b In units of , at 1 keV.
c In units of .
We determined the LMC intrinsic absorption by adjusting the abundances of individual elements. We used for the abundances the values log(X/H) + 12 = 8.25, 6.99, 8.47 and 7.74 for C, N, O and Ne respectively (Pagel 1993). For the other elements we used a logarithmic decrement of –0.4 dex.
We first applied a spectral fit to the sample of AGN which had been optically identified, for which a redshift had been determined and for which at least 200 counts have been observed. We derive best-fit total hydrogen column densities due to the LMC, , which are in the range of to a few (cf. Table 3).
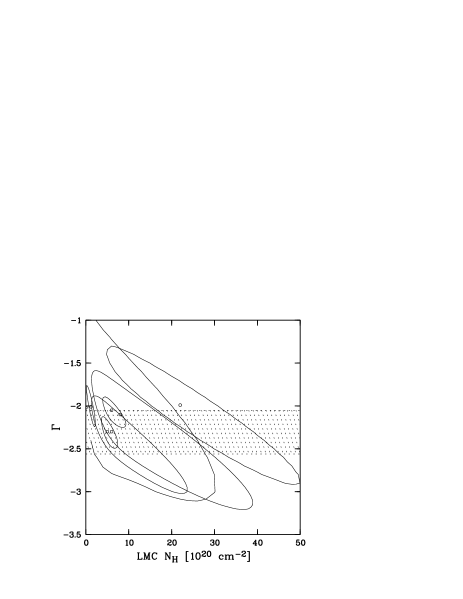
We derive for the five AGN in this sample with the best determined powerlaw photon index a value of (cf. Table 3 and Fig. 3). These powerlaw photon indices fall into the interval of powerlaw photon indices derived by Laor et al. (1997) for radio loud AGN in the ROSAT band (0.1 – 2.4 keV). Brinkmann et al. (2000) derive for about 500 optically identified AGN and galaxies which have been observed during the ROSAT all-sky survey the distribution of powerlaw photon indices by grouping these sources into 4 object classes (quasars, galaxies, low luminosity AGN and BL Lacs). Half of the AGN have a counterpart in the VLA 20cm FIRST catalog. If one excludes the galaxies then the range in powerlaw photon indices of the AGN and quasar sample cover the same values as the powerlaw photon indices of the radio loud and radio quiet AGN sample of Laor et al. (1997). But for their AGN sample Brinkmann et al. (2000) do not find evidence for a bimodal distribution in the radio-loudness parameter. In Fig. 3 we show as dashed band the range of powerlaw photon indices covered by the AGN sample of Brinkmann et al. (2000).
We also applied a spectral fit to further 19 background X-ray sources for which the number of available counts is given in Table 2. The uncertainties in the hydrogen column densities derived for these sources from the X-ray spectral fit are considerable. We will discuss the result of the spectral fit for these sources in Sect. 5.1 where we apply additional constraints to the powerlaw photon index.
4.2 Uncertainties in the spectral fit
Now we discuss uncertainties in the spectral fit which may affect the value of the deduced hydrogen column density. We use in our analysis AGN lying behind a wide range of LMC neutral hydrogen column densities as inferred from the 21-cm radio observations (cf. Sect. 5). A few of these AGN are located in regions of LMC column densities , behind a large cloud complex at the eastern side of the LMC and another cloud complex at the northwestern side. From ROSAT PSPC observations it has been found that these regions are associated with hot diffuse gas which emits in X-rays (Snowden & Petre 1994). This hot gas adds to the X-ray spectrum and has to be properly accounted for in the spectral fit. For that we determine the background spectrum in a region close to an AGN. But if the hot gas component varies on small scales then the result of the spectral fit depends on the location where the background is taken. Clearly, a careful selection of the background region is required.
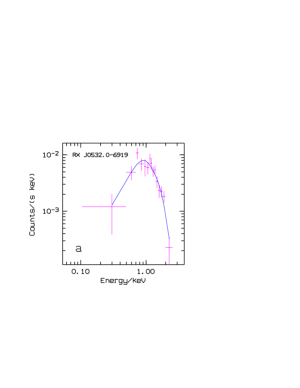
We briefly discuss the effect of background subtraction on the result of the spectral fit by choosing different areas for the background. We use as an example the AGN RX J0532.0-6919 which is located in a region of extended and variable diffuse emission. One choice for the background is a region of lower background taken 6′ east of the AGN, a second choice is a region of a higher but more appropriate background. The result of the spectral fitting (the absorbing column and the photon index) is somewhat dependent on the chosen background. Depending on the chosen background region we derive total LMC hydrogen absorbing columns for RX J0532.0-6919 in the range . This result shows that in regions of variable diffuse emission systematic effects can play a role in the determination of the hydrogen column density. In Fig. 4 we show the ROSAT PSPC spectrum used for the spectral fit using the best background model.
As another example we choose the AGN RX J0536.9-6913 (equal to the ATCA source MDM 65) which is located close to the 30 Dor complex. The radio source which also has the designation 0536-692 has been well studied at 21-cm (Dickey et al. 1994; Mebold et al. 1997). The X-ray source has been detected with the ROSAT PSPC in our merged image of the 30 Dor complex. SHP00 detected RX J0536.9-6913 in the HRI data but did not classify the source. But the identification with the radio source MDM 65 (= 0536-692) makes RX J0536.9-6913 a strong candidate for a background X-ray source.
Spectral fitting of the ROSAT PSPC data shows that this source is indeed very heavily absorbed. This is consistent with the fact that the source is seen through the complete gas in the 30 Dor complex. RX J0536.9-6913 is in a region of diffuse X-ray emission and the background region has to be carefully chosen as faint near-by X-ray sources and variable diffuse X-ray emission can affect the background subtraction and the result of the spectral fitting. Fortunately there exists a first light EPIC XMM-Newton image of the 30 Dor area (cf. Briel et al. 2000; Dennerl et al. 2001) which guided us to select a background region close to RX J0536.9-6913 which is free of faint X-ray sources and diffuse structure (a region south-west of the AGN).
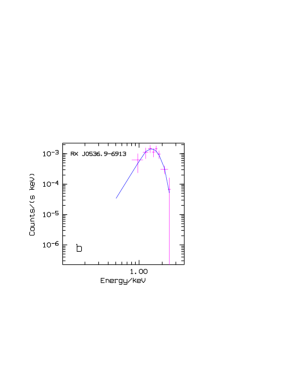
In Fig. 4 (lower panel) we show the background subtracted ROSAT PSPC spectrum of RX J0536.9-6913 and the spectral model assuming a galactic foreground absorption and keeping the powerlaw photon index fixed to . We derive an absorption due to LMC gas of (see also Sect. 5.1).
We note that the value for the absorbing column derived from the ROSAT PSPC data is within the uncertainties consistent with the absorbing column of derived from recent XMM-Newton Epic-PN observations of RX J0536.9-6913 (Haberl et al. 2001).
5 Comparison with 21-cm radio observations
The Magellanic system has been mapped in 21-cm with the Parkes radio telescope at a resolution of 14′ (Luks & Rohlfs 1992; Luks 1994) and with the ATCA radio telescope at a resolution of 1′ (Kim et al. 1998, 1999). Luks & Rohlfs (1992) have found in their 21-cm line survey of the LMC two separate structural features, one due to a gas disk (extending all over the LMC) and a L-component at lower radial velocities. They derived for both components the distribution of the H i column density in a .∘ .∘ field. The disk component has been found to contain 72% and the L-component 19% of the H i gas. The derived column densities of the H i gas due to the LMC vary from to at least . The largest column densities are found in the 30 Dor region which is contained in a large cloud complex with an area of square degrees at the eastern side of the LMC.
We now compare the hydrogen absorbing column densities towards the AGN in the LMC field derived from the X-ray spectral fitting in Sect. 4 with the column densities of neutral hydrogen H i as inferred from 21-cm line measurements. In Sect. 4.1 we have applied a spectral fit to the ROSAT PSPC AGN spectra by fixing the galactic contribution to the absorption. We used the values derived from the Parkes 21-cm line measurements of the galactic absorption in the direction of the AGN.
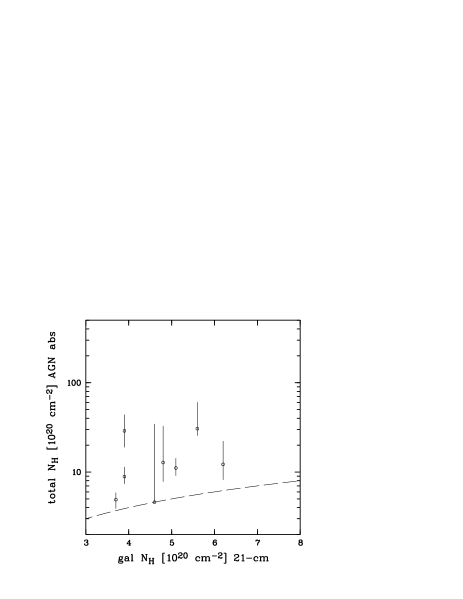
In Fig. 5 we demonstrate there is excess absorption (additional to the galactic absorption) which is assumed to be due to the LMC gas. As expected we find that the total hydrogen column (galactic & LMC) lies above the hydrogen column determined from the 21-cm for the Milky Way. The excess absorption varies from a few up to .
Next we compare the LMC hydrogen column density derived from the X-ray spectral fit in Sect. 4 with the LMC column density of neutral hydrogen H i as inferred from a Parkes 21-cm line survey of the Magellanic system with a resolution of 14′ (Brüns et al. 2001). We show the result in Fig. 6 for the sample of optically identified background AGN given in Table 3.
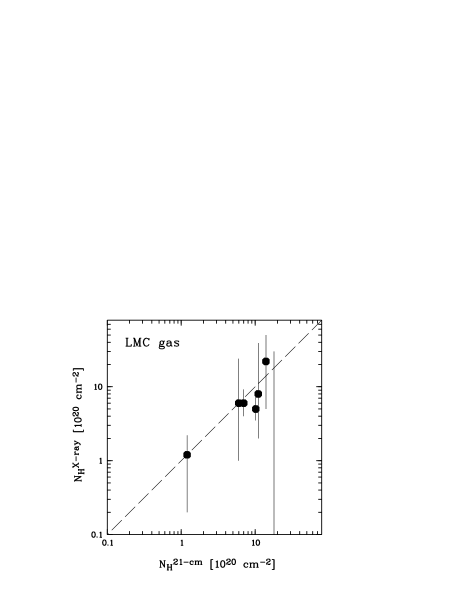
The LMC column densities inferred from the X-ray spectral fit cover the range from about to . We find that the values obtained from the spectral fit are within the uncertainties consistent with the hydrogen column densities determined from the 21-cm line measurements. Only for the background source RX J0503.1-6634 a somewhat lower value for the LMC column densities is derived from the X-ray spectral fit.
5.1 Constraints on the hydrogen column density for AGN type spectra
For many of the background X-ray sources given in Table 1 the uncertainties in the hydrogen column densities derived from the X-ray spectral fit are considerable and a comparison with the column densities derived from the 21-cm line measurements is not very conclusive. In order to further constrain also for these background X-ray sources the values of the hydrogen column densities (derived from the X-ray spectral fit) we make use of the assumption that all AGN have powerlaw photon indices which are consistent with the powerlaw photon indices determined by Brinkmann et al. (2000) for their AGN sample.
We already have found in Sect. 4 that the AGN which have well constrained spectral parameters have powerlaw photon indices which are consistent with the powerlaw photon indices derived by Brinkmann et al. (2000) for their AGN sample. We now use the constraint on the photon index =(2.0 – 2.5) to constrain the hydrogen column densities due to LMC gas in the direction of the background AGN. This constraint is consistent with the range in derived for the AGN sample of Brinkmann et al. (2000). We constrain the hydrogen columns for 26 background X-ray sources and we give the result in Table 4 and for 21 of these AGN in Fig. 7. We do not include RX J0530.1-6551 in the figure which is probably an X-ray binary.
| Name | Compa- | |||
| RX J | 21-cm | 21-cm | X-ray | risonc |
| 0436.2-6822 | 4.3 | 1.4 | 0 – 5 | = |
| 0454.1-6643 | 3.9 | 14 | = | |
| 0503.1-6634 | 3.9 | 10 | ||
| 0509.2-6954 | 6.2 | 6 | = | |
| 0510.4-6737h | 4.5 | 12 | ||
| 0522.7-6928h | 6.2 | 9.0 | = | |
| 0523.2-7015 | 6.8 | 6.6 | 2 – 20 | = |
| 0524.0-7011 | 5.1 | 7 | = | |
| 0528.8-6539 | 5.7 | 5.3 | = | |
| 0529.0-6603 | 4.6 | 7.6 | = | |
| 0530.1-6551 | 4.6 | 6.8 | ||
| 0532.0-6919 | 4.8 | 11 | = | |
| 0534.1-7018 | 5.7 | 19.5 | 35 – 50 | |
| 0534.1-7037h | 4.8 | 16.7 | 0 – 70 | = |
| 0534.6-6738 | 4.6 | 18 | 0 – 30 | = |
| 0536.0-7041 | 4.8 | 16.7 | = | |
| 0536.9-6913 | 5.0 | 33d | 160 – 340 | |
| 370e | 160 – 340 | |||
| 0540.3-6241 | 4.6 | 0.44 | = | |
| 0541.6-6511 | 4.5 | 0.53 | = | |
| 0546.0-6415 | 3.7 | 1.2 | = | |
| 0546.8-6851 | 5.6 | 38 | = | |
| 0547.0-7040 | 7.3 | 29.6 | ||
| 0548.4-7112 | 6.4 | 16.6 | 20–50f | = |
| 0552.3-6402h | 3.7 | 0.16 | = | |
| 0606.0-7042h | 6.8 | 2.5 | = | |
| 0607.6-6651 | 4.8 | 0.68 | 0 – 4.5 | = |
a Inferred from Parkes 21-cm line survey (Brüns et al. 2001).
b The constraint used is =(2.0 – 2.5)
and is about the range in derived for the AGN sample of Brinkmann et
al. (2000).
c Comparison between the X-ray derived value of the LMC column
density and the 21-cm line derived value.
d Value is determined from the 21-cm emission line measurement in
the direction of the AGN (Dickey et al. 1994).
e A dominant H i absorption component of has been determined from 21-cm line measurements.
f Constraint used is =(3.0 – 3.5) as the 68% confidence
error ellipse extends over .
g constraint for as the
68% confidence error extends over .
h Not included in Fig. 7.
We derive values for the hydrogen column due to LMC gas ranging from to . There remain still considerable uncertainties in these values. We have determined these values from the 68% confidence contours in the – parameter plane. The best-fit value given for the hydrogen column is in general the value for the minimum found by the grid search in the parameter plane. In Fig. 7 we compare the value for the LMC hydrogen absorbing column density in the direction of 21 of the AGN from Table 4 as inferred from the spectral fit with the value for the LMC hydrogen absorbing column density derived from a Parkes 21-cm line survey (Brüns et al. 2001). We find that most of these values are consistent with the H i values inferred from the Parkes survey.111The values given for the total LMC determined from X-ray spectral fitting differ from . They are the values resulting from the spectral fit and they have not been corrected taking the different photoionisation cross section for atomic and molecular hydrogen into account. can be determined with Equ. 1.
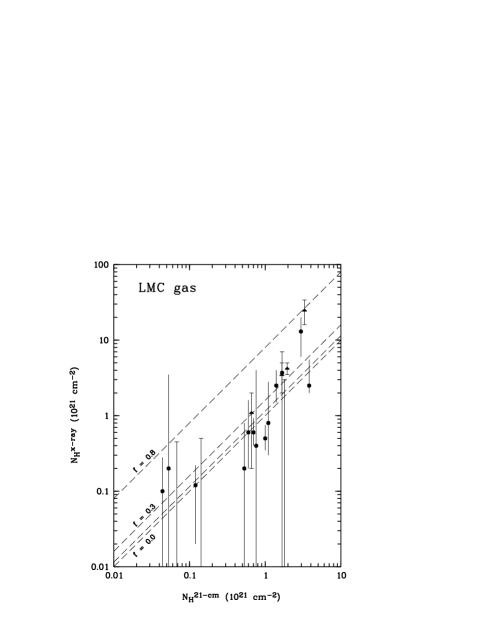
But for two sources substantial amount of absorbing gas would be derived which is in excess of the value inferred from the H i survey. One of these sources, RX J0536.9-6913, is located between 30 Dor and 30 Dor C, a region where high H i columns have been measured. In this region also copious emission of diffuse gas is seen in X-rays. In addition RX J0536.9-6913 lies in a region where high columns due to molecular gas (Sect. 6) have been measured and also a dark cloud complex is seen in this region. The second source, RX J0547.0-7040, coincides with a molecular cloud complex measured with NANTEN (Fukui et al. 1999; Mizuno et al. 1999). But if we take into account the constraints applied to the powerlaw photon index and the assumption for the metallicity of the LMC gas in the direction of these two background sources the significance for absorbing gas in excess of the measured H i may not be that large.
5.2 Uncertainties in the 21-cm line measurements
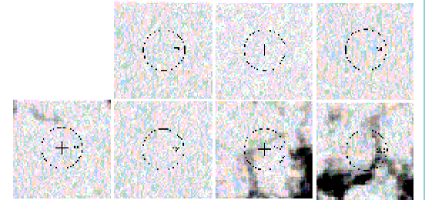
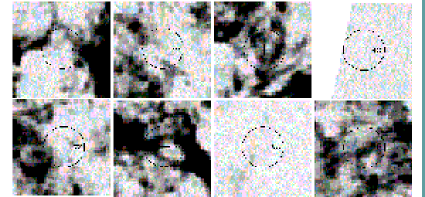
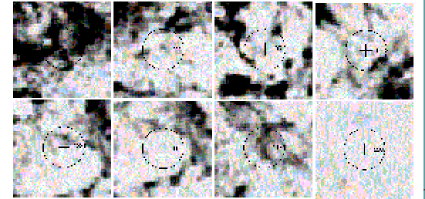
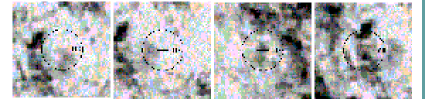
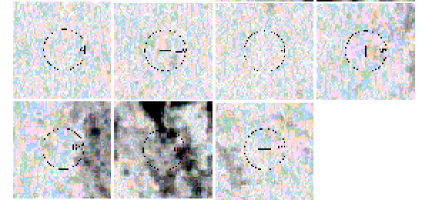
We have used Parkes 21-cm line measurements to infer the H i column densities in the direction of the AGN. The Parkes beam has a FWHM of 14′ and cannot resolve H i structure on smaller scales. But this may be required as aperture synthesis mosaics from the LMC with the ATCA revealed structure in the H i on scales up to the resolution of 1′ (Kim et al. 1998; 1999). We illustrate this effect in Fig. 8 where we show the positions of the ROSAT AGN marked as a cross inside a circle of the size of the Parkes beam. In several cases small scale H i structure is found in the 14′ beam centered on the ROSAT AGN. The map of Kim et al. (1998) does not give the value of the associated with H i structures and we cannot determine the uncertainties of the determination if we integrate across the Parkes beam.
A hierarchial structuring of the H i gas clouds up to small scales (the resolution of their H i survey of 1.′5) has been found by Staveley-Smith et al. (1997) and Stanimirovic et al. (1999) with ATCA observations of the SMC. A similar structuring of the LMC H i gas clouds has been found by Kim et al. (1999). Such a structuring of the gas may affect the integrated column density of the gas along the line of sight towards a background source.
5.3 Comparison of LMC results with those of the SMC
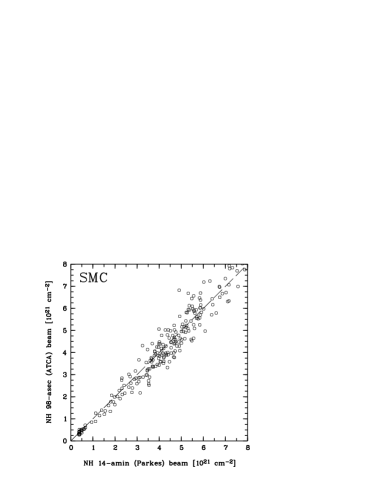
In order to investigate the uncertainties associated with the determination of the LMC column density towards an AGN in the field of the LMC we made use of the high-resolution H i survey of the Small Magellanic Cloud (SMC) performed with the ATCA radio telescope by Stanimirovic et al. (1999). We used the ROSAT PSPC catalog of point sources detected in the field of the SMC by Kahabka et al. (1999). We integrated the map of Stanimirovic et al. (1999) in a circular region of size 14′ (the Parkes beam) centered at the location of the X-ray sources detected with the ROSAT PSPC in the direction of the SMC.
In Fig. 9 we show the correlation between the determined from the ATCA map and integrated over the Parkes beam with the determined from the ATCA map at the location of the ROSAT source.
In Fig. 10 we show in a histogram the number of SMC sources for which the determination of the by these two different evaluations differs by a given percentage. Assuming this distribution is Gaussian one derives a FWHM for this distribution of 30% (a Gaussian of 13%).
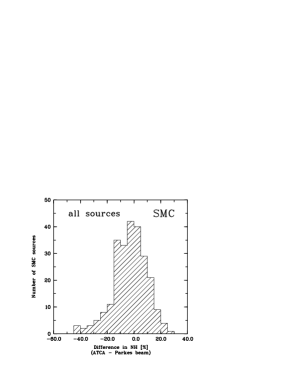
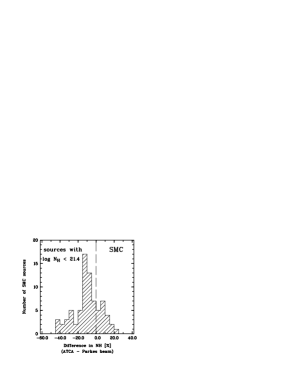
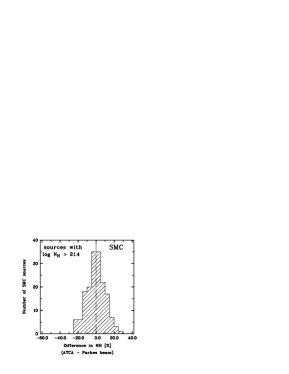
From Fig. 9 one can see that the column densities at the location of a ROSAT PSPC source in the field of the SMC as derived from the ATCA map are systematically lower for H i column densities below compared to the column densities inferred from the same map but integrated within the Parkes beam. For column densities above such a trend appears not to exist. We also show the histograms for these two ranges of column densities in Fig. 10.
There appears to be one straightforward explanation for this difference in the determination. For lower hydrogen column densities the SMC gas is transparent to a ROSAT source. So one expects to detect preferentially the sources seen through lowest columns. This is a selection effect. In addition, at lower columns fewer gas structures are expected to add up and inhomogeneities in the gas (the contrast of structures) will be better recognized. At higher columns background sources are difficult to detect and sources found are mostly sources not too deep inside the SMC. Also the contrast in H i decreases as more different structures add up. This means that the symmetry of the distribution for the higher column range, having a FWHM of 20% or a 9%, (see Fig. 10) represents the H i structure which still exists in the large column regime.
6 Molecular gas
Molecular hydrogen is abundant in regions of high hydrogen column densities (Savage et al. 1977). The fraction of molecular hydrogen with respect to atomic hydrogen (expressed in the molecular mass fraction ) can vary locally and may depend on the gas column density. Richter (2000) presented the molecular mass fraction of the LMC and the SMC gas in the direction of 7 stars from UV absorption. He found that the molecular mass fraction is low (less than 10%) while strongly depending on the hydrogen column density. Only in regions of hydrogen columns a molecular mass fraction 1% has been found.
We derive the column density of molecular hydrogen from the total hydrogen column density of the gas as derived from the AGN X-ray spectra and the column density of atomic hydrogen H i
| (1) |
Here we make the assumption that the photoionisation cross section is 2.8 times larger for molecular hydrogen than for atomic hydrogen (cf. Cruddace et al. 1974, Yan et al. 1998). The molecular mass fraction is then determined by
| (2) |
We note that we do not consider the contribution of warm diffuse gas to the total absorbing column density .
The molecular mass fractions derived with Equ. 2 are uncertain due to the uncertainties in the values of the hydrogen column densities inferred from the X-ray observations. But also the H i values are uncertain due to the beam size of the Parkes beam of 14′. We therefore can derive in most cases only upper limits for the molecular mass fraction from
| (3) |
In Table 5 we give the derived values () for the molecular mass fractions for 6 AGN from Table 4 with accurate determinations making use of Equ. 2 and 3 and assuming For further 6 AGN we determine only 1 upper limits for the molecular mass fraction.
| Name | Remarks | |||
|---|---|---|---|---|
| RX J | () | (%) | ||
| 0454.1-6643 | 1.4 | 0.39 | 36 | (a) |
| 0503.1-6634 | 1.0 | 0.0 | 0.0 | (b) |
| 0509.2-6954 | 0.6 | 0.36 | 120 | (b) |
| (c) | ||||
| 0523.2-7015 | 0.66 | 0.160.32 | 3245 | (a) |
| 0524.0-7011 | 0.7 | 0.08 | 30 | (b) |
| 0528.8-6539 | 0.53 | 0.1 | 180 | (b) |
| 0532.0-6919 | 1.1 | 0.61 | 180 | (b) |
| (d) | ||||
| 0534.6-6738 | 1.8 | 0.43 | 63 | (b) |
| 0536.9-6913 | 3.3 | 7.83.2 | 826 | (a) |
| 37 | 0.0 | 0.0 | (b),(e) | |
| 0546.0-6415 | 0.12 | 0.04 | 60 | (b) |
| 0546.8-6851 | 3.8 | 0.62 | 67 | (b) |
| 0547.0-7040 | 3.0 | 3.62.5 | 7115 | (a) |
(a) The value of is given derived from as
determined in the spectral fit.
(b) Upper limits () are given for and .
(c) Constraint obtained using as
derived from the hardness ratio analysis (cf. Paper II).
(d) Constraint obtained using as
derived from the hardness ratio analysis (cf. Paper II).
(e) Using the determination from the strongest H i absorption
component (cf. Dickey et al. 1994).
We now discuss the constraints on the molecular mass fraction derived for individual AGN (cf. Table 5). RX J0534.6-6738 and RX J0532.0-6919 are located in regions where molecular gas can be inferred from the CO map of Cohen et al. (1988). RX J0532.0-6919 is located in a region with a large () LMC H i column density (cf. Table 4). The total hydrogen column density inferred from the ROSAT PSPC X-ray spectral fit is within the uncertainties consistent with the H i column density inferred from the 21-cm line measurements. We derive for RX J0532.0-6919 a rather large upper limit for the molecular mass fraction of 180%.
RX J0454.1-6643, and RX J0524.0-7011 are close to regions with detected molecular gas as would be inferred from the CO map of Cohen et al. (1988). We derive upper limits for the molecular mass fraction of RX J0454.1-6643 and RX J0524.0-7011 of 70% and 30% respectively.
For RX J0536.9-6913 (= MDM 65), which is located in the 30 Dor complex, a very large column density of has been determined from the spectral fit to a deep (200 ksec) merged ROSAT PSPC observation. This is the largest hydrogen column determined for a LMC background X-ray source. From Parkes 21-cm line data we get here a H i column of . The molecular mass fraction in the direction of RX J0536.9-6913 is found to be 826%. However, Dickey et al. (1994) have detected H i in absorption with the ATCA radio telescope in the direction of a background radio source which coincides in position with RX J0536.9-6913. The absorption is, given the radial velocity, due to gas associated with the disk (D) component of the LMC. The column density determined for the strongest absorption component is (Dickey et al. 1994) and consistent with or even larger than the total column density derived from the X-ray absorption. This would mean that no large contribution due to molecular hydrogen is required to explain the X-ray absorption.
There is another ROSAT PSPC source in the 30 Dor complex, RX J0546.8-6851, for which also a large H i column density of is determined with the Parkes radio telescope. An X-ray spectral fit gives for this source a total gas column density of to assuming constraints on the photon index for AGN type spectra. This value for the absorption is consistent with the value determined from the 21-cm line measurements. The source has been classified as a likely AGN (or perhaps an X-ray binary) by SHP00. The molecular mass fraction derived for this source of 67% is somewhat lower than the fraction derived for RX J0536.9-6913. But if the absorption inferred for RX J0536.9-6913 from the 21-cm absorption line measurements is taken into account then a consistent constraint for the molecular mass fraction is derived for both sources. RX J0546.8-6851 was not studied in the ATCA 21-cm absorption line surveys of the LMC, so nothing is known about 21-cm absorption. The X-ray source does not appear to be located in an X-ray dark area of the LMC.
From these two highly absorbed ROSAT background sources we would conclude that the mass fraction of molecular gas in the 30 Dor complex is probably less than 70%. We infer for the other less absorbed ROSAT background sources (and excluding RX J0528.8-6539 for which the value determined for f is very uncertain) upper limits for the mass fraction for the molecular gas of about 30 to 140%. An alternative explanation for observed increased gas columns in the 30 Dor region could be a higher metal content of the star forming complexes (cf. Haberl et al. 2001; Dennerl et al. 2001).
Our result for the appears to be in qualitative agreement with the measured distribution of CO in the LMC (Cohen et al. 1988). According to these measurements, the CO intensity is larger in the 30 Dor complex than ′ east of it. According to Cohen et al. (1988) a maximum column density due to of is expected for the 30 Dor complex assuming an factor of .
We would determine for RX J0536.9-6913 a rather high column density due to molecular hydrogen of if we make use of the hydrogen column inferred from the 21-cm emission line measurements. We note that such a column density would imply the CO component would be above the detection limit of of the NANTEN 12CO survey (cf. Mizuno et al. 1999 and Fukui et al. 1999). But if we use the hydrogen column density of inferred from the dominant 21-cm absorption line component (Dickey et al. 1994) then we would not require molecular hydrogen to explain the result of the X-ray spectral fit. RX J0536.9-6913 is located in an “X-ray shadow” or “dark cloud”, a region of reduced diffuse X-ray emission which could indicate for a molecular cloud complex (or alternatively a cool cloud complex). From inspection of the ROSAT PSPC image (Fig. 2) centered on the AGN we estimate the size of the cloud to 3.2′ which is equivalent to 50 pc for a distance of 50 kpc. We note that the value for the total hydrogen column density in the direction of RX J0536.9-6913, is similar to the value as determined by Poglitsch et al. (1995) for 30 Dor.
For RX J0546.8-6851 on the other hand a lower value of the column density due to molecular hydrogen of is derived from the X-ray observations. Such a column density is below the detection limit of of the NANTEN 12CO survey. The derived value for the corresponds for the assumed factor to a CO intensity of which is consistent with the lowest contour in the CO map of Cohen et al. (1988).
7 Conclusions
We have set up a sample of 35 background X-ray sources in a 10∘ 10∘ field of the LMC observed with the ROSAT PSPC using the X-ray catalogs of HP99 and SHP00 and the radio catalog of MDM97. A fraction of these sources are candidate background X-ray sources which have been constrained from X-ray spectral properties.
For 7 of the background X-ray sources which are optically identified and for which a redshift has been determined we perform X-ray spectral fitting and we constrain the photon index and the hydrogen absorbing column density due to the LMC gas. We use for the galactic absorbing component values inferred from a 21-cm Parkes survey. We find for these sources powerlaw photon indices which are consistent with the powerlaw photon indices of AGN type spectra (with values in the range to ). The total LMC absorbing columns which we derive from the X-ray spectral fit are within the uncertainties consistent with the H i columns measured with a Parkes 21-cm line survey.
For further 19 background X-ray sources we cannot constrain the powerlaw photon index accurate enough to derive secure constraints on the LMC hydrogen column density. For these sources we make the assumption that the powerlaw photon index is that of AGN type spectra to . With that assumption we then derive constraints on the LMC hydrogen column density for these sources.
We compare for 20 X-ray background sources the LMC absorbing columns derived from the X-ray spectral fit with the LMC H i columns derived from a 21-cm line Parkes survey. We find in general, within the uncertainties of the values derived from the X-ray spectral fit, agreement between the X-ray and 21-cm derived absorbing columns.
For two background sources RX J0536.9-6913 and RX J0547.0-7040, which are located in regions of large () H i columns, we derive hydrogen columns from the X-ray spectral fit of which are in excess of the H i columns. These sources probably are seen through additional gas which may be warm and diffuse, cold or molecular. But if we take into account the constraints applied to the powerlaw photon index and the assumption made for the metallicity of the LMC gas in the direction of these two background sources the significance for absorbing gas in excess of the measured H i may not be that large.
We derive constraints on gas columns additional to H i for 10 background X-ray sources. Assuming that these columns are due to molecular gas we derive upper limits for the molecular mass fraction for these sources of 30 – 140%.
Acknowledgements.
The ROSAT project is supported by the Max-Planck-Gesellschaft and the Bundesministerium für Forschung und Technologie (BMFT). We have made use of the ROSAT Data Archive of the Max-Planck-Institut für extraterrestrische Physik (MPE) at Garching, Germany. This research has made use of the SIMBAD data base operated at CDS, Strasbourg, France. We have made use of the publicly available H i peak temperature image of the LMC (Kim et al. 1998) and of the H i image of the SMC provided by S. Stanimirovic. We have made use of the Karma software developed at ATNF. PK is supported by the Graduiertenkolleg on the “Magellanic Clouds and other Dwarf galaxies” (DFG GRK 118). We thank the referee W. Pietsch for the useful comments.References
- (1) Balucinska-Church, M., & McCammon, D. 1992, ApJ 400, 699
- (2) Blanco, V.M., & McCarthy, M.F. 1990, AJ 100, 67
- (3) Boller, T., Meurs, E.J.A., Brinkmann, W., et al. 1992, A&A 261, 57
- (4) Briel, U.G., Aschenbach, B., Balasini, M., et al. 2000, “Contributions to the SPIE’s International Symposium on Astronomical Telescopes and Instrumentation 2000”, SPIE 4012, 154
- (5) Brinkmann, W., & Siebert, J. 1994, A&A 285, 812
- (6) Brinkmann, W., Yuan, W., & Siebert, J. 1997, A&A 319, 413
- (7) Brinkmann, W., Laurent-Muehleisen, S.A., Voges, W., et al. 2000, A&A 356, 445
- (8) Brüns C., Kerp J., Staveley-Smith L. 2001, in Mapping the Hidden Universe: The Universe Behind the Milky Way - The Universe in HI, eds. Kraan Korteweg R.C. & Henning P.A., (ASP Conf. 218), 349
- (9) Cohen, R.S., Dame, T.M., Garay, G., et al. 1988, ApJ 331, L95
- (10) Cowley, A.P., Crampton, D., Hutchings, J.B., et al. 1984, ApJ 286, 196
- (11) Cowley, A.P., Schmidtke, P.C., McGrath, T.K., et al. 1997, PASP 109, 21
- (12) Crampton, D., Gussie, G., Cowley, A.P., & Schmidtke P.C. 1997, AJ 114, 2353
- (13) Cruddace, R., Paresce, F., Bowyer, S., & Lampton, M. 1974, ApJ 187, 497
- (14) Dennerl K., Haberl, F., Aschenbach, B., et al. 2001, A&A 365, L203
- (15) Dickey, J.M., Mebold, U., Marx, M., et al. 1994, A&A 289 357
- (16) Filipović, M.D., Pietsch, W., Haynes, R.F., et al. 1998b, A&AS 127, 119
- (17) Filipović, M.D., Haynes, R.F., White, G.L., & Jones P.A. 1998a, A&AS 130, 421
- (18) Fukui, Y., Abe, R., Hara, A., et al. 1999, in New views of the Magellanic Clouds, ed. Y.-H. Chu et al., p.61
- (19) George, I.M., Turner, T.J., Yaqoob, T., et al. 2000, ApJ 531, 52
- (20) Haberl, F., & Pietsch, W. 1999, A&AS 139, 277 [HP99]
- (21) Haberl, F., Dennerl, K., Filipović, M.D., et al. 2001, A&A 365, L208
- (22) Hewitt, A., & Burbidge, G. 1991, ApJS 75, 297
- (23) Gurwell, M., & Hodge, P. 1990, PASP 102, 849
- (24) Kahabka, P., Pietsch, W., Filipović, M.D., & Haberl F. 1999, A&AS 136, 81 [KPFH99]
- (25) Kahabka, P., de Boer, K.S., & Brüns, C. 2001, A&A (in prep, Paper II)
- (26) Kerp, J. 1994, A&A 289, 597
- (27) Kim, S., Dopita, M.A., Staveley-Smith, L., & Bessell, M.S. 1999, AJ 118, 2797
- (28) Kim, S., Staveley-Smith, L., Dopita, M.A., et al. 1998, ApJ 503, 674
- (29) Laor, A., Fiore, F., Elvis, M., et al. 1997, ApJ 477, 93
- (30) Luks, T., & Rohlfs, K. 1992, A&A 263, 41
- (31) Luks, T. 1994, RvMA 7, 171
- (32) Ma C., Arias E.F., Eubanks, T.M., et al. 1998, AJ 116, 516
- (33) Marx, M., Dickey, J.M., & Mebold, U. 1997, A&AS 126, 325 [MDM97]
- (34) Marx-Zimmer, M., Herbstmeier, U., Dickey, J.M., et al. 2000, A&A 354, 787
- (35) Mebold, U., Düsterberg, C., Dickey, J.M., et al. 1997, ApJ 490, L65
- (36) Mizuno, N., Abe, R., Hara, A., et al. 1999, in New views of the Magellanic Clouds, ed. Y.-H. Chu et al., p.120
- (37) Moran, E.C., Halpern, J.P., & Helfand, D.J. 1996, ApJS 106, 341
- (38) Pagel, B.E.J. 1993, Stellar vs. Interstellar Abundances in the Magellanic Clouds, in Lecture Notes in Physics 416, New Aspects of Magellanic Cloud Research, eds. Baschek B., Klare G., Lequeux J., 330
- (39) Perlman, E.S., Padovani, P., Giommi, P., et al. 1998, AJ 115, 1253
- (40) Pfeffermann, E., Briel, U.G., Hippmann, H., et al. 1987, Proc. SPIE 733, 519
- (41) Poglitsch, A., Krabbe, A., Madden, S.C., et al. 1995, ApJ 454, 293
- (42) Richter, P. 2000, A&A 359, 1111
- (43) Sambruna, R.M., Eracleous, M., & Mushotzky, R.F. 1999, ApJ 526, 60
- (44) Sasaki, M., Haberl, F., & Pietsch, W. 2000, A&AS 147, 75 [SHP00]
- (45) Savage, B.D., Bohlin, R.C., Drake, J.F., & Budich, W. 1977, ApJ 216, 291
- (46) Schartel, N., Walter, R., Fink, H., & Trümper, J. 1996a, A&A 307, 33
- (47) Schartel, N., Green, P.J., Anderson, S.F., et al. 1996b, MNRAS 283, 1015
- (48) Schmidtke, P.C., Cowley, A.P., Frattare, L.M, et al. 1994, PASP 106, 843
- (49) Schmidtke, P.C., Cowley, A.P., Crane, J.D., et al. 1999, AJ 117, 927
- (50) Snowden, S.L., Freyberg, M.J., Plucinsky, P.P., et al. 1995, ApJ 454, 643
- (51) Snowden, S.L., & Petre, R. 1994, ApJ 436, L123
- (52) Stanimirovic, S., Staveley-Smith, L., Dickey, J.M., et al. 1999 MNRAS 302, 417
- (53) Staveley-Smith, L., Sault, R.J., Hatzidimitrou, D., et al. 1997, MNRAS 289, 225
- (54) Strauss, M.A., Huchra, J.P., Davis, M., et al. 1992, ApJS 83, 29
- (55) Tinney, C.G. 1999, MNRAS 303, 565
- (56) Trümper, J. 1983, Adv. Space Res. 2, 241
- (57) Wang, Q., Hamilton, T., Helfand, D.J., & Wu, X. 1991, ApJ 374, 475
- (58) White, G.L., Batty, M.J., Bunton, J.D., et al. 1987, MNRAS 227, 705
- (59) White, G.L., Bunton, J.D., Anderson, M.W.B., et al. 1991, MNRAS 248, 398
- (60) Wright, A.E., Griffith, M.R., Burke, B.F., & Ekers, R.D. 1994, ApJS 91, 111
- (61) Yan, M., Sadeghpour, H.R., & Dalgarno, A. 1998, ApJ 496, 1044
- (62) Zimmermann, H.U., Becker, W., Belloni, T., et al. 1994, MPE report 257