The Hard X-ray Luminosity of OB Star Populations: Implications for the Contribution of Star Formation to the Cosmic X-ray Background
Abstract
We present an empirical analysis of the integrated X-ray luminosity arising from populations of OB stars. In particular, we utilize results from the All-Sky Monitor on RXTE, along with archival data from previous missions, to assess the mean integrated output of X-rays in the 2–10 keV band from accreting early-type binaries within 3 kpc of the Sun. Using a recent OB star census of the Solar neighborhood, we then calculate the specific X-ray luminosity per O star from accretion-powered systems. We also assess the contribution to the total X-ray luminosity of an OB population from associated T Tauri stars, stellar winds, and supernovae. We repeat this exercise for the major Local Group galaxies, concluding that the total X-ray luminosity per O star spans a broad range from 2 to erg s-1. Contrary to previous results, we do not find a consistent trend with metallicity; in fact, the specific luminosities for M31 and the SMC are equal, despite having metallicities which differ by an order of magnitude. In light of these results, we assess the fraction of the observed 2–10 keV emission from starburst galaxies that arises directly from their OB star populations, concluding that, while binaries can explain most of the hard X-ray emission in many local starbursts, a significant additional component or components must be present in some systems. A discussion of the nature of this additional emission, along with its implications for the contribution of starbursts to the cosmic X-ray background, concludes our report.
1 Introduction
Early-type stars are themselves modest X-ray emitters, with a mean output in the 0.1–10 keV band of only of their optical/UV flux. Thus, even a population of a million OB stars, typical of that found in a galaxy undergoing a vigorous starburst, will only produce an X-ray luminosity of . A single young neutron star similar to that in the Crab Nebula or a single O-star binary with a neutron star or black hole companion will thus outshine the entire population of main sequence stars. In order to determine the expected contribution of a young stellar population to the X-ray luminosity of a galaxy, then, it is necessary to estimate accurately the specific X-ray luminosity per O star, most of which comes from the deceased segment of the population. Such an exercise is of interest in light of the relatively high X-ray luminosities of starburst galaxies and the potential contribution of such objects to the cosmic X-ray background.
We attempt here a systematic, empirical census of the direct contributions OB stars, their lighter siblings, and their stellar remnants make to the hard (2–10 keV) X-ray luminosity of a starburst galaxy by calculating the specific X-ray luminosity per O-star in the Solar neighborhood, the Galaxy as a whole, and the other members of the Local Group. We begin (§ 2) with a cautionary tale concerning the calculation of long-term, mean X-ray luminosities for high-mass X-ray binaries by surveying the literature on the most luminous such system in the Local Group, SMC X-1. In § 3, we compile a list of all high-mass, accretion-powered X-ray binaries that lie within 3 kpc of the Sun and, using the Rossi X-ray Timing Explorer (RXTE) All-Sky Monitor database and other archival data, compute the total X-ray luminosity within this volume arising from such systems. Using a recent census of OB stars in the solar vicinity, we then calculate the specific X-ray luminosity per O star from accreting systems. This local estimate is then compared to that for the Galaxy as a whole. The following section (§ 4) repeats this analysis for the other Local Group galaxies, concluding with a commentary on the reported dependence of this value on metallicity. In § 5, we consider the other contributions an OB star population makes to the integrated X-ray luminosity of a galaxy—from associated T Tauri stars, stellar winds, and supernovae. We then go on (§6) to assess the fractional contribution these direct sources of X-ray emission make to the total hard X-ray luminosity of starburst galaxies. We conclude with a summary of our results, a brief discussion of additional possible contributions to the X-ray luminosity of starburst galaxies, and the implications of these results for the origin of the cosmic X-ray background.
2 The Mean Observed X-ray Luminosity of SMC X-1
The High-Mass X-ray Binary (HMXB) SMC X-1, the only persistent, bright, accretion-powered source in the Small Magellanic Cloud (SMC), consists of a B0 supergiant primary accompanied by a neutron star with a 0.7 s pulse period in a 3.9 d orbit. The system is the most luminous X-ray binary in the Local Group, and is frequently cited as “superluminous,” given that its nominal X-ray luminosity exceeds the Eddington limit for a neutron star. But just what is the mean, integrated luminosity of SMC X-1 as observed from Earth?
The most complete recent catalog of X-ray binaries is that of van Paradijs (1995) which lists, among other system parameters, a maximum and minimum (if available) reported flux density for each source. In the case of SMC X-1, these values are 57 and 0.5 Jy. The incautious reader might adopt either the maximum value (especially for the majority of sources in the catalog for which only one value is given), or simply average the two numbers to estimate the mean X-ray luminosity of the source. In fact, to convert these values to a mean observed X-ray luminosity requires adoption of a distance to the SMC, a mean spectral form for the X-ray emission, and a bandwidth over which the emission is integrated, as well as a description of the temporal behavior of the source. Compiling the variety of assumptions actually adopted in the literature is instructive: 45 kpc 70 kpc (Howarth 1982; Seward & Mitchell 1981); ; (Angelini, White, & Stella 1991; Coe et al. 1981); cm-2 (Kahabka & Pietsch 1996; Davison 1977); and 0.2–2.4 keV to 2–100 keV (Kahabka & Pietsch 1996; Coe et al. 1981). As a consequence, quoted luminosities range from erg (Seward & Mitchell 1981) to ergs (Price et al. 1971); far from all of this uncertainty results from the source’s intrinsic variability. Furthermore, some reports undertake systematic data editing that bias the flux estimates upward—leaving out data during the 16% of the time the X-ray source is in eclipse, ignoring periods when the source is at an undetectable level for a given instrument, etc.—which, while usually well-documented and appropriate for the task at hand, require reversal when attempting to define the source’s mean contribution to its galaxy’s X-ray luminosity.
To continue with this example, we adopt a distance to the Small Cloud of 65 kpc and, for SMC X-1 itself, we employ spectral parameters , (Angelini et al. 1991) and a cutoff energy of 6.5 keV; while these parameters ignore a reported soft (kT keV) component, they suffice to illustrate our point. Correcting the mean fluxes for SMC X-1 reported over monitoring times of weeks to a decade by Angelini et al. (1991), Wojdowski et al. (1998), Whitlock & Lochner (1994), Gruber & Rothschild (1984), and Levine et al. (1996) to the 2–10 keV band, we find all are consistent within two sigma with the value of ergs , or 17 , a factor of 5 below the highest value in the literature, and a factor of 3.5 below the cataloged flux. This value is below the Eddington limit for a neutron star mass of even before correcting for the lower metallicity of the accreting material in the SMC; more importantly, however, it represents the appropriate value to adopt in any summation of the integrated X-ray luminosity of the SMC OB-star population (see § 4.2) and illustrates the need for caution when undertaking such a task.
3 The X-ray Luminosity per O Star for Accreting Systems in the Milky Way
3.1 The Solar Neighborhood
We begin by examining in detail the populations of HMXBs and OB stars where our information is most complete—within 3 kpc of the Sun. In Table 1, we list all 57 accretion-powered X-ray binaries with high-mass stellar primaries ever reported in the literature as lying within this distance. Much of the data are taken from the catalog of van Paradijs (1995); a survey of the literature in the intervening five years has been used to bring the list up to date. The first column contains the original source name, followed by a vernacular name (if any). Columns 2–4 list the optical counterpart name and J2000 coordinates. These have been taken from the Hipparcos/Tycho catalogs (Perryman et al. 1997; Høg et al. 1997) if available (see also Chevalier & Ilovaisky 1998), and elsewise from the Guide Star Catalog, or from the highest precision position reported in the literature. For sources without confirmed optical identifications, the best available X-ray coordinates are given, and the star listed is the brightest object in the error circle. The source of the position is given in column 5; if the positional uncertainty is greater than and/or the identification is uncertain, its value is given in parentheses. Columns 6 and 7 give the star’s visual magnitude and spectral type; these are taken from the Hipparcos or Tycho catalogs when available, and otherwise from the literature. The source distances follow (cols. 8–10); they include the smallest distance reported in the literature, a best estimate (based in a few cases on Hipparcos parallaxes, but mostly on a qualitative assessment of the literature), and the maximum plausible distance. For stars with Hipparcos observations, the 1.5 lower limit is given. If a distance upper limit is greater than 3.0 kpc, it is quoted as “ kpc”, and the source’s contribution to the local X-ray binary luminosity is computed as if it were at 3 kpc for purposes of calculating an upper limit to this value. Clearly, if the source lies at a greater distance, its inferred luminosity would be higher, but its contribution to the quantity of interest is zero, making this a conservative approach to calculating an upper limit to the X-ray luminosity of the population as a whole.
The remaining columns of the Table report source fluxes and luminosity measurements. When spectral parameters are provided in the literature, they have been used to correct the observed flux to the 2–10 keV band. When only an instrumental flux and bandwidth are quoted, we have adopted a power-law spectral form with a photon index of 1.0 and a plausible column density for the adopted distance(s) (using unless excess extinction is indicated). Our results are not sensitive to this specific choice of parameters: varying the power law index over the range and the column density from cm-2 changes the inferred luminosities by .
Since our goal is to calculate the best available long-term mean integrated flux for each source, we have utilized the RXTE All-Sky Monitor (ASM; Levine et al. 1996) light curves when available; more than half the sources have such light curves with largely continuous coverage (80% to 98%) over more than 1650 days. For each of these, we include the number of days in the light curve for which no flux is available, the global mean flux, the mean flux plus 2 (since many sources are not detected on most days, this value is useful as a 2 upper limit), the number of days the source flux exceeded 4 , the mean flux on those days, and the first and tenth brightest daily mean fluxes in the 4.5-year interval; the latter values are included in order to ascertain whether or not one, or a few, large outbursts dominate the time-integrated luminosity. The 26 sources not included in the ASM database have never been significantly above the ASM threshold at any time throughout the last 4.5 years (R. Remillard, private communication). For these sources, we adopt an upper limit of 1.0 ASM ct and calculate the luminosity limit for each source as described above.
This limit is very conservative. As shown below, the mean ASM flux value for a truly absent source (SMC X-3, for example) over the ASM monitoring interval is ct s-1. The fact that all of the 31 regularly monitored sources have mean values a factor of five or more above this limit suggests that they are often present just below the detection threshold. But there is no such evidence for those sources which have never crossed the ASM detection threshold, suggesting that a reasonable upper limit to their contribution could be at least an order of magnitude lower.
In addition, for all sources, we have searched the High Energy Astrophysics Science Archive Research Center (HEASARC) X-ray Binary Catalog which archives all observations of X-ray binaries in the Center’s large collection of databases. For each source, we list the number of detections (col. 18), the maximum count rate and, in column 21, the catalog from which the count rate was taken. In no case does the integrated luminosity in a major outburst exceed the integrated luminosity over 30 years derived from the ASM 4.5-year averages or our conservative upper limits thereto.
As can be seen from the final line in Table 1, our best estimate for the integrated, mean 2–10 keV luminosity of the HMXB population within 3 kpc of the Sun is . Roughly one-third of this total comes from the black hole system Cyg X-1, one third from a handful of neutron star binaries such as Vela X-1 and 4U1700–37, and the final third from the upper limits adopted for the 26 sources not detected in the ASM. The estimate is conservative, since it includes all the sources not detected in the ASM as contributing at 1 ct s-1. Furthermore, nine of the systems (contributing 11% of the total flux) have nominal distances beyond 3.0 kpc, but are included because their distance uncertainties allow membership in our volume-limited sample.
If we take the 2 upper limits for all objects, the integrated value only increases by 40%. Adopting the additional extreme assumption that all sources are at their maximum allowed distances still does not raise the conservative best estimate by a factor of two. While examination of the 30-year history of all sources does show much higher luminosities in some cases for brief intervals, there is no evidence to suggest that the last 4.5 years of ASM data is in any way atypical. Thus, we conclude that the HMXB population within the 38 kpc3 volume surrounding the Sun produces a 2–10 keV X-ray luminosity of 2–3 .
The final step in calculating the specific X-ray luminosity per O-star in the solar neighborhood is to find the number of O-stars within 3.0 kpc. We use the recent (unpublished) compilation of K. Garmany (private communication). She finds a total of 351 spectroscopically confirmed stars of types O3 through O9 out to 1.95 kpc from the Sun; the number in bins of constant projected area (excepting a local minimum) is roughly constant out to this distance, suggesting incompleteness is not a problem. In addition, there are 1915 B0–B2 stars, plus a total of 772 stars with the colors of OB stars which lack spectroscopic types. Adopting the same O/B ratio as for the classified stars (18%) suggests as many as 140 additional O stars should be added to the total. Extrapolating with a constant surface density out to 3.0 kpc, then, yields a total of 1165 O stars within the volume. The specific accretion-powered X-ray luminosity per O star is , with a conservative upper limit (2 X-ray source upper limits, maximum distances, and no O stars in the unclassified portion of the stellar sample) of .
The census conducted here allows an estimate of the fraction of early type stars that eventually form X-ray binary systems. For example, there are 3038 stars of types O3 through B2 in the Garmany compilation, implying a total of stars within the 3 kpc distance (correcting for a modest incompleteness evident in the B0–B2 star counts); in this same region (using best-estimate distances), we currently know of 24 HMXBs with primaries of these types, as well as 22 other accreting systems for which the spectral class is too poorly established to include them unambiguously. Thus, of all the early-type stars are currently active accretion-powered X-ray sources. Since the HMXB phase lasts for a few percent of an OB star’s lifetime (Portegies-Zwart & Verbunt 1996), of all OB stars must produce an HMXB. This is roughly consistent with population synthesis studies (Dewey & Cordes 1987; Meurs & van den Heuvel 1989; Dalton & Sarazin 1995; Lipunov, Postnov, & Prokhorov 1997; Terman, Taam, & Savage 1998; Portegies-Zwart & van den Heuvel 1999), although the predictions of such calculations are quite sensitive to the assumed kick velocity imparted to neutron stars at birth. In our limited sample, at least, the fraction of X-ray active O stars is similar to that for B stars; given their shorter lifetimes, the fraction of HMXBs produced must be larger, consistent with the notion that kick velocities become increasingly sucessful at unbinding binaries as the mass of the companion star decreases. Note that these statistics include HMXBs with luminosities as low as erg s-1; the fraction of systems with persistent luminosities erg s-1 is an order of magnitude smaller.
3.2 The Whole Galaxy
The integrated Lyman continuum luminosity of the Milky Way is (van den Bergh & Tammann 1991). Using Table 5 of Vacca (1994) for solar metallicity, a Salpeter mass-function slope of 2.35, and a mass upper limit of 80 implies a total Galactic population of O stars of . This is greater than a straightforward extrapolation from the local population discussed above to the full Galactic disk (R = 12 kpc), consistent with the observed enhancement of star formation activity in the inner Galaxy. It is also consistent with the claim of Ratnatunga and van den Bergh (1989) that the total Pop I content of the Galaxy is times that found in a 1 kpc2 area of the disk centered on the Sun, and with an estimate (van den Bergh & Tammann 1991) based on counts of embedded O stars from IRAS observations (Wood & Churchwell 1989). The uncertainty in the number of O stars is probably less than 50%.
The total number of HMXBs in the Galaxy is less well constrained. Eight persistent sources are known with luminosities greater than (see Dalton & Sarazin 1995); these produce a total peak X-ray luminosity (see § 2) of . Other bright, unidentified X-ray sources in the Galactic plane could add to this population; Dalton & Sarazin’s population synthesis model predicts 12 sources with and 43 sources with . Tripling the four known sources with to match this prediction would yield a luminosity contribution of . Integrating the Dalton and Sarazin predicted luminosity function down to and adding the Be star population at a mean luminosity of yields a nominal HMXB luminosity for the Galaxy of . This value is dominated by the luminous sources, as is observed to be the case in the solar neighorhood. Adding the predicted flux from sources with to the observed of the eight bright sources yields a lower limit of for the Galaxy’s total . Dividing the nominal value by the O star population derived above gives , the same as the upper limit on locally derived value and, again, uncertain by a factor .
4 The X-ray Luminosity per O Star in Local Group Galaxies
The specific luminosities derived above depend on a number of factors which could well be different in environments such as the nuclear starbursts to which we ultimately wish to apply our results. For example, metallicity can introduce a variety of effects: lower metallicity (1) increases the Eddington luminosity of accreting sources by decreasing the X-ray scattering cross section of the infalling material, (2) lowers the mass of a star of a given spectral type (and thus changes the conversion factor between the number of Lyman continuum photons and the number of O stars), and, possibly, (3) changes the ratio of black holes to neutron stars formed in stellar collapse (Hutchings 1984; Helfand 1984). In order to explore the range of specific X-ray luminosities in different galactic environments, we have repeated the exercise of counting HMXBs and O stars in the four largest external members of the Local Group.
4.1 The LMC
The first X-ray sources discovered in the Large Magellanic Cloud were detected with non-imaging rocket-borne instruments thirty years ago (Price et al. 1971). Since then, systematic imaging surveys have been carried out by the Einstein Observatory (Long, Helfand, & Grabelsky 1981; Wang et al. 1991), EXOSAT (Pakull et al. 1995; Pietsch et al. 1989), and ROSAT (see Haberl & Pietsch 1999, although the complete results have yet to be published). In addition, ten X-ray binary candidates have been monitored by the RXTE ASM, allowing us to calculate accurate mean fluxes on timescales of years.
Of the four bright, persistent accreting binaries in the LMC, one (LMC X-2) is a low-mass system and does not concern us here. LMC X-1 and LMC X-3 are both strong black hole candidates (Hutchings et al. 1987; Cowley et al. 1983) with steep X-ray spectra (; White & Marshall 1984); LMC X-4 is a HMXB pulsar with a flat power-law index of (Kelley et al. 1983). Using these spectral parameters and the ASM mean count rates calculated as above, the integrated 2–10 keV luminosity of these three sources is for an adopted distance of 50 kpc.
In addition to these persistent sources, the original imaging surveys, high resolution images of 30 Doradus (Wang & Helfand 1991; Wang 1995), studies of variable sources in the ROSAT data (Haberl & Pietsch 1999), and monitoring observations by Ariel V, RXTE, CGRO, etc. have led to the detection of an additional fourteen HMXB candidates in the Large Cloud. Several of these have been confirmed as Be-pulsar systems through the detection of X-ray pulses, although the majority have neither firm optical or X-ray confirmation of their identity. Seven have been monitored by the ASM for periods ranging from to days. While most of these have been detected on a few occasions, none has a mean flux in excess of 0.15 ASM ct s-1; for nominal spectral parameters of and , this corresponds to an upper limit of . Of the remaining non-ASM sources, none has ever been reported above a luminosity of for more than a single day in outburst. Finally, there remain several dozen unidentified X-ray point sources from the Einstein survey. Although the majority of these are background interlopers, some could be additional HMXBs; however, the integrated luminosity of the brightest ten sources is . An even larger number of (mostly fainter) point sources are to be found in the ROSAT survey, but, again, the majority will be interlopers, and the integrated luminosity of any LMC HMXBs will not affect our sums by more than a few percent. Thus, we estimate the total accretion luminosity of the OB population in the LMC to be , or roughly half that of the Milky Way.
Kennicutt & Hodge (1986) have derived the total Lyman continuum flux from the integrated H luminosity of the LMC: . This value should be regarded as a lower limit owing to leakage of some Lyman continuum photons from H II regions. Oey & Kennicutt (1998) estimate the leakage fraction ranges from to for a sample of 12 bright LMC H II regions; we adopt their median value of 25% to correct the Kennicutt & Hodge estimate. From the integrated radio continuum flux, Israel (1980) derives a value for of , which should be regarded as an upper limit owing to the nonthermal continuum radiation which has not been subtracted. We adopt as a conservative estimate. For a mean metallicity of one-third solar, the measured upper IMF slope of (Massey et al. 1995), and an upper mass cutoff of 80 (both of which will be assumed throughout), Vacca’s (1994) tables provide an estimate for the total number of O stars in the Large Cloud of 5530 with an estimated uncertainty of . Thus, the specific 2–10 keV X-ray luminosity is , a factor of 1.5 to 3 greater than those derived for the solar neighborhood and the Galaxy as a whole.
4.2 The SMC
SMC X-1 is the most luminous HMXB in the Local Group. As discussed in detail in § 2, however, its mean observed luminosity is not quite as extraordinary as is often implied. To complement all of the long-term studies cited above, we have used the RXTE ASM database to calculate its mean flux over the past 4.5 years as we have for the LMC and Galactic binaries. Using the spectral parameters quoted in §2 and a distance of 65 kpc, we find , completely consistent with the value found above from monitoring studies over the past three decades.
Early studies of SMC X-1 with SAS-3 (Clark et al. 1978) also led to the discovery of two other putative HMXBs in the SMC at flux levels only a factor of lower. One of these, SMC X-3, has never been seen again, despite sensitive searches by imaging missions which reached flux levels nearly times lower. The other source, SMC X-2 which had also disappeared a few months after its discovery (Clark, Li, & van Paradijs 1979) has been detected once more in the intervening 23 years by ROSAT at a level of (adopting the spectral parameters of SMC X-1), although a subsequent observation with the same instrument failed to detect it at a level 650 times lower (Kahabka & Pietsch 1996). Both sources have been monitored for the past 4.5 years by the RXTE ASM and have been detected with 4 significance on only one and three days, respectively (roughly consistent with the number of such detections expected by chance, especially considering that the crowded region in which they reside raises the systematic uncertainties in daily flux determinations). Their mean values are both consistent with zero, with upper limits of 0.05 ASM ct or luminosities of .
As with the LMC, a number of surveys and targeted observations with Einstein and ROSAT, as well as monitoring observations by RXTE and CGRO have revealed several additional HMXBs and HMXB candidates in the Small Cloud. One new source, XTE J0111.2-7317 has had a mean ASM flux of 0.4 ct over the last 2 years, contributing a luminosity of during this interval. However, the source was not detected in either the Einstein or ROSAT surveys of the Cloud at flux levels more than 100 times lower, so this is unlikely to represent an accurate estimate of its long-term mean luminosity. The other two HMXBs included in the RXTE monitoring together contribute less than 20% of this luminosity, and the remaining thirteen candidates reported in the literature all have mean fluxes far below this level. Finally, as with the LMC, the total number of remaining unidentified Cloud members from the Einstein (Seward & Mitchell 1981; Wang & Wu 1992) and ROSAT (Kahabka & Pietsch 1996; Haberl et al. 2000) surveys would, if identified as HMXBs, increase the integrated luminosity of the population by only a few percent. Thus, we estimate the total accretion luminosity of the OB population of the SMC to be , or roughly equal to that for the LMC.
It is important to note, however, that more than two-thirds of this luminosity arises in the singular system SMC X-1 which, in addition to being the most luminous persistent HMXB in the Local Group, also contains the most rapidly rotating X-ray pulsar ( = 0.71 s), an object with a spin-up timescale of only 2000 years. In their detailed study of the spin and orbital evolution of SMC X-1, Levine et al. (1993) estimate that the current high-luminosity phase of the binary’s evolution will last at most a few times the pulsar spin-up time, or yr. Compared with the yr main sequence lifetime of this 20 star, we have a chance of of seeing the system at this X-ray luminosity. Since only of massive stars end up as short-period HMXBs (Portegies-Zwart & van den Heuvel 1999), the number of expected systems in the SMC is . Thus, while it is not enormously improbable that we see SMC X-1 at this luminosity, the long-term integrated X-ray luminosity of this galaxy is likely to be overestimated by a factor of several as a consequence of this one source’s current strut upon the stage. We pursue this matter further below in discussing the putative dependence of a galaxy’s X-ray luminosity on metallicity.
We can estimate the total O star population for the SMC in a manner exactly analogous to that used for the LMC. Kennicutt & Hodge (1986) report photons s-1 from H data, while Israel (1980) derives from the radio continuum emission; using the same considerations cited in the previous section, we adopt photons s-1. For a metallicity of 0.1 solar, the tables in Vacca yield an estimate of 1300 O stars. The resulting specific luminosity, then, is at the present time, although given the lifetime of SMC X-1 and the arguments presented above, it is likely to be lower by a factor of on long timescales, making it more similar to, but still significantly in excess of, the values derived for the solar neighborhood, the Galaxy, and the LMC.
4.3 M33
Given its distance (720 kpc), individual X-ray binaries in M33 are not detectable by non-imaging or ASM instruments, leaving the Einstein (Long et al. 1981; Markert & Rallis 1983; Trinchieri, Fabbiano, & Peres 1988) and ROSAT (Schulman & Bregman 1995; Long et al. 1996) surveys as our only views of its X-ray source population. The deepest image is that from the ROSAT PSPC obtained by Long et al. (1996): 50 sources were detected within of the nucleus above a luminosity threshold of ergs s-1 (for our adopted spectral form of a power-law spectrum with and —but see below). Five of the sources are identified with foreground stars, one is a background AGN, and ten are positionally coincident with optically identified supernova remnants; since the latter sources have mainly soft X-ray spectra, these associations are thought to be mostly correct.
Over 60% of the soft X-ray luminosity of the galaxy comes from a nuclear source which is unresolved with the ROSAT HRI (FWHM = ; Schulman & Bregman 1995). The origin of this emission is unknown. There was evidence from the Einstein data that the source is variable on timescales of days to months (Markert & Rallis 1983; Peres et al. 1989); more recently, Dubus et al. (1997) claim evidence for a 20% modulation with a 106 d periodicity, although their result is not significant at the 3 level and the periodicity is apparently inconsistent with the Einstein measurement (see their Figure 3). The object’s high X-ray luminosity in the soft band of the imaging experiments is in part a consequence of the source’s soft spectrum. The ASCA observations of Makishima et al. (2000) provide the most detailed spectral data in the harder X-ray band, and produce a luminosity estimate of . The unusual stellar content of the M33 nucleus (O’Connell 1983) and the absence of obvious signs of an AGN at other wavelengths, has led to a variety of speculative notions concerning the nature of this source: an anomalous AGN, a single black-hole HMXB, a cluster of HMXBs, intermediate-mass (Her X-1–type) binaries, LMXBs, and (predictably) a “new” type of X-ray source. While Chandra observations will soon eliminate many of these options, it is at present unclear whether some or all of this source’s luminosity should be charged to the OB population’s accretion account. We calculate the specific luminosity for M33 both including and excluding this contribution.
As for the remaining 33 X-ray sources with , one (the third brightest) is known to be an eclipsing binary pulsar (Dubus et al. 1999). In the somewhat unlikely event that all 32 remaining sources also are HMXBs, we can estimate the integrated 2–10 keV luminosity from the EXOSAT observations reported in Gottwald et al. (1987). The non-imaging ME detector’s field of view includes all the X-ray emission from M33. The ME count rate was ct s-1 in the 1–6 keV band and, while not a good fit, the spectrum can be characterized for our purposes of estimating a 2–10 keV luminosity by their best-fit power law parameters of cm-2. We find a total X-ray luminosity of . Some small fraction of this emission will be contributed by the soft foreground stars and M33 SNRs, so we adopt a 2–10 keV luminosity of including the nuclear source, and if it is excluded.
There is substantial disagreement between the estimated thermal radio continuum fluxes of M33 between Israel (1980) and Berkuijsen (1983). However, more recent radio results from Buczilowski (1988) and the H measurements of Devereux, Duric, and Scowen (1997) agree quite closely with Berkuijsen’s estimate which we adopt here. The implied Lyman continuum flux is, then, ph s-1; for a metallicity of 1/3 solar, we derive a total O star population of 3460 for M33. This yields a range for the specific X-ray luminosity of ergs s-1 star-1, a value comparable to that for the SMC if the nuclear emission is included.
4.4 M31
As the largest member of the Local Group, M31 has been studied by all the major X-ray satellite missions. The Einstein survey (van Speybroeck et al. 1979) revealed a luminous population of LMXBs both in globular clusters and in the galactic bulge, plus a disk population presumably consisting of HMXBs and supernova remnants. The recent ROSAT PSPC survey (Supper et al. 1997) brought the number of detected sources in the vicinity of the galaxy to nearly 300, lowered the luminosity threshold to ergs s-1, and confirmed the general picture of two source populations outlined above. In addition to these soft X-ray images, Ginga carried out a long pointing at the galaxy in the 2–20 keV band of direct interest here. Makishima et al. (1989), fitted the high signal-to-noise integrated spectrum with a composite model to represent the dominant LMXB and HMXB populations; the derived fluxes were carefully corrected for collimator response using the distribution of resolved sources in the Einstein images. They find an upper limit to the HMXB contribution, translated to the 2–10 keV band using their spectral assumptions (the Galactic foreground absorption of cm-2 and a cutoff power law with and kev) of ergs s-1; they demonstrate that this is consistent with a value derived by summing the Einstein sources in its softer bandpass.
Radio-continuum, far-infrared, and H images indicate that the bulk of the star-formation in M31 occurs in a thin ring in the galactic disk kpc from the nucleus (e.g., Beck & Gräve 1982; Devereux et al. 1994; Walterbos & Braun 1994; Xu & Helou 1996). This star-forming ring is the region in M31 where high-mass binaries might be expected to reside. After eliminating X-ray sources identified with foreground stars, background AGN, and globular clusters, a comparison of the PSPC source catalog of Supper et al. (1997) and the 60 m image of Xu & Helou (1996) reveals that 20 ROSAT sources are positionally coincident with the star-forming ring; four additional sources are located close to the ring, four more are coincident with 60 m–bright features outside the ring (excluding the bulge, which is not a site of massive star formation; see Devereux et al. 1994), and six others are found in an outer spiral arm northeast of the ring where there is some low-surface brightness IR emission. Only two of these 34 sources (both of which are weak and in the ring) are identified with supernova remnants, so the remainder could all be HMXBs. The PSPC count rates of the HMXB candidates sum to 0.36 ct s-1, roughly 30% of the 0.1–2.4 keV flux associated with the galaxy. Applying the Makishima et al. spectral parameters to this count rate and extrapolating to the 2–10 keV band suggests a maximum HMXB luminosity of in M31. Assuming a somewhat softer spectrum with or assigning only half the sources to the HMXB population yields a result consistent with the Ginga analysis: erg s-1.
As with the other Local Group galaxies, the ionizing photon luminosity of M31 can be inferred from the thermal fraction of its radio continuum emission and its H luminosity. Beck & Gräve (1982) estimate that within the central 20 kpc, the thermal radio flux density at 2.7 GHz is Jy, which suggests photons s-1. The extinction-corrected H luminosity of ergs s-1 measured by Walterbos & Braun (1994) gives, assuming Case B recombination, cm-3, and K, a nearly identical value for . Thus, adopting solar metallicity, we estimate that there are 3660 O stars in M31. An estimated luminosity of ergs s-1 for the HMXB population yields a specific luminosity of ergs s-1 star-1, very similar to the value we obtained for the SMC and nearly a factor of ten larger than that for the Galaxy. While surprising, we can think of no plausible loopholes in our argument to eliminate this difference (see §7).
4.5 Pop I X-rays in the Local Group
In Table 2, we summarize data relevant to the O-star populations and X-ray emissivity of the Local Group galaxies. For each object, we give our adopted distance (uncertain by less than 10%), the blue luminosity and the adopted metallicity. The next column lists the quantity from Vacca (1994), the ratio of the number of equivalent O7 stars needed to produce the observed Lyman continuum flux to the total number of actual O stars in the galaxy. This quantity depends on metallicity, and on the assumed slope and mass cutoff of the upper part of the IMF; we have adopted the Salpeter for the Milky Way and for the other galaxies. Varying the IMF slope from 2.0 to 3.0 (e.g., Hill, Madore,& Freedman 1994) changes the O-star counts by –22% to +60% for solar metallicity, and –22% to +36% for a metallicity of 0.1 solar. Likewise, changing from to produces changes in the estimated O-star population of roughly . Thus, the IMF parameters are not a major source of uncertainty in our estimates.
The number of Lyman continuum photons inferred from the observations described in the text, and the resulting number of O stars are found in columns 6 and 7. We then include several quantities which depend on the massive star population: star formation rate, core-collapse supernova rate, Lyman continuum flux and number of O-stars, all normalized to the value for the Milky Way. Clearly these quantities are not all independent, but they are listed to demonstrate that, within a factor of two, these four quantities are consistent for each galaxy, giving us some confidence that the O-star numbers by which we normalize our specific X-ray luminosities are not in error by more than a factor of two. The final two columns contain our estimates for the 2–10 keV discussed above and the X-ray luminosities per O star which constitute our principal result.
The range of specific luminosities spans an order of magnitude. In two cases, we list a range of values based on differing assumptions about the assignment of X-ray flux to Pop I binaries: for M33, we quote the value including and excluding the nuclear source, and for the SMC, we include the current value, as well as one-third of that value based on our arguments about the lifetime of SMC X-1. In both cases, however, the entire range of allowed values falls within the extremes defined by the Milky Way and M31. While it is somewhat curious that the galaxy for which we have the best information—the Milky Way—has the lowest value, the consistency of the results we obtain for the Solar Neighborhood and the Galaxy as a whole adds to the robustness of this conclusion. Bringing the value for the earlier type galaxy M31 down by a factor of to agree with M0 appears to lie outside of the range of the uncertainties involved. The implications of this result for the putative dependence of Pop I X-ray luminosity on metallicity is discussed below.
4.6 A Dependence on Metallicity?
Shortly after the discovery of highly luminous Pop I X-ray binaries in the Magellanic Clouds, Clark et al. (1978) discussed the apparent shift in the mean X-ray luminosity of HMXBs in the Clouds with respect to that in the Milky Way, and attributed the higher luminosities of the Cloud binaries to the lower metallicity of the accreting gas. The discovery that the metal-poor extragalactic H II region NGC 5408 has a very high X-ray luminosity (Stewart et al. 1982) reinforced the notion that the Pop I X-ray luminosity of a galaxy and its metallicity are inversely correlated. Alcock & Paczynski (1978) calculated evolutionary tracks for low-metallicity massive stars, and pointed out that such stars spend more time in evolutionary phases with massive stellar winds that power much HMXB emission, offering a possible explanation for this trend. Hutchings (1984) offered an alternative explanation, postulating that the fraction of compact objects in HMXBs that are black holes may be higher in late-type (lower metallicity) galaxies; indeed, two of the three persistently bright LMC Pop I binaries are among the best black hole candidates. Without any quantitative analysis of its significance or cause, numerous studies on the contribution of starbursts to the X-ray Background (XRB; e.g., Bookbinder et al. 1980; Griffiths & Padovani 1990) have adopted this relation.
The results presented here, however, suggest caution. While our value for the specific X-ray luminosity per O star in the solar neighborhood is similar to the number of ergs s-1 per O star quoted by Stewart et al. (1982), our values for the LMC and SMC disagree by factors of 4 to 8; a similar table from Bookbinder et al. (1980) contains values higher by yet another factor of 4. Since no details on the derivation of these numbers are given in this earlier work, it is difficult to pinpoint the causes of these discrepancies, although the common overestimation of the X-ray luminosities of specific sources, exemplified by our discussion in § 2, is a likely culprit. Our use of the ASM data to obtain long-term mean values and our detailed analysis of the imaging data for each galaxy (as well as modern estimates for O star counts) has, we hope, reduced the uncertainties in these estimates.
Our conclusion that M31, the most metal-rich member of the Local Group, has a specific X-ray luminosity per O star very similar to that of the SMC (the lowest metallicity galaxy) casts serious doubt on the widely adopted notion that these two quantities are anticorrelated. The recognition that SMC X-1, which dominates the value for the Small Cloud, may be sufficiently short-lived that the current luminosity of that galaxy is several times greater than the long-term average would actually reverse the trend. The detailed census of 2–10 keV point sources in M31, the resolution of the nature of the M33 nuclear source, and the resolution of the point source populations in more distant galaxies with Chandra should help to constrain further the values derived here and to clarify the dependence, if any, of X-ray luminosity on metallicity.
5 Other X-ray Contributions Associated with Star Formation
While HMXBs are the most luminous individual X-ray sources arising from star formation, several other high energy phenomena associated with massive stars also produce hard X-rays. For completeness, we evaluate their contributions to the specific X-ray luminosity per O star here.
Since most of these phenomena are, like the HMXBs, associated with all stars down to 8 (the approximate dividing line between stars which end their lives in core-collapse supernovae and those which end as white dwarfs), we include the integrated contributions from stars down to this mass cut. Furthermore, since these phenomena are mostly short-lived compared to the main sequence lifetimes of OB stars, we calculate the expected contribution to the instantaneous X-ray luminosity of the population by dividing total X-ray luminosity produced by the mean main-sequence lifetime of the population, weighted by the initial mass function:
where is the initial mass function (and we adopt the Salpeter slope of ), and (Stothers 1972). The result, adopting lower- and upper-mass limits of 8 and 80 , respectively, is Myr.
In the steady state, such as obtains today in the Milky Way, this provides the appropriate comparison to our empirical specific luminosity per O star from the HMXBs. In a galaxy undergoing a starburst with a duration comparable to this timescale, the relative contributions of these various additional sources of X-ray emission will be a function of the starburst age. However, for a population of such starbursting systems, the steady state value provides a valid approximation.
5.1 Main Sequence O Stars
As noted in the Introduction, OB stars on the main sequence produce X-rays which are thought to originate from shocks that develop in unsteady wind outflows (Lucy & White 1980; Cooper & Owocki 1994; Feldmeier et al. 1997). The typical ratio of (Pallavicini et al. 1981). The characteristic temperature of the emission is keV (Chlebowski, Harnden, & Sciortino 1989), implying a 2–10 keV luminosity of ergs s-1 for all spectral classes. The total is, then, of the binary contribution and can be safely ignored.
Harder emission, both thermal and nonthermal, can arise when winds from neighboring stars collide (Cooke, Fabian, & Pringle 1978; Chen & White 1991; Wills, Schild, & Stevens 1995). In the Orion Trapezium region, the total 2–10 keV X-ray luminosity, not all of which can reasonably be associated with this phenomenon is ergs s-1 in the 2–10 keV band (Yamauchi & Koyama 1993; Yamauchi et al. 1996). With at least several O stars participating, this yields a specific luminosity of that of binary systems. While it is possible that in the massive OB associations found in starburst nuclei wind collisions could be significantly enhanced, it seems highly improbable that they will compete with binaries as a significant source of an OB star population’s hard X-ray luminosity.
5.2 Pre-Main Sequence Stars
Lower mass stars, formed in association with massive stars, undergo a T Tauri phase prior to descending onto the main sequence during which significant hard X-ray emission is produced (e.g., Koyama et al. 1996). Again, using the local example of Orion as a template, the X-ray luminosity associated with T Tauri stars in the 2–10 keV band is ergs s-1 (Yamauchi & Koyama 1993). Since there are O stars in the Orion complex, this yields a specific luminosity of ergs s-1. If there is a discrepancy in the ratio of high- to low-mass stars in starburst galaxies versus the local sites of star formation, it is likely to be in the direction of a deficit of lower mass stars, reducing this contribution to an even smaller value. In any event, it appears unlikely that the contribution from pre-main sequence low-mass stars will exceed 1% that of the HMXBs.
5.3 Supernova Remnants
The violent deaths of massive stars in core-collapse supernovae provide several means of producing X-ray emission: thermal emission from shock-heated gas left by the passage of the SN blast wave, nonthermal emission from particles accelerated at the shock front, nonthermal emission from a synchrotron nebula generated by a young, rapidly rotating neutron star, and emission from a hot young neutron star’s surface and magnetosphere. We examine each of these in turn, taking the Galaxy’s supernova remnant (SNR) population as exemplary.
The hot gas generated by the outward moving shock wave from the SN explosion, along with the stellar ejecta heated by the reverse shock, produce thermal X-ray emission with a temperature characteristic of the shock velocities; for most of a remnant’s life these range from 300 to 3000 km s-1, yielding nominal temperatures from 0.2 to 20 keV, although delayed equilibration between the protons and electrons, nonequilibrium ionization, and inhomogeneities in the ambient and ejected material conspire to produce observed temperatures for the bulk of the emitting material of keV.
While more sophisticated models of remnant X-ray emission have been constructed over the past few decades, it suffices for our purposes of estimating the total 2–10 keV energy radiated to use the simple Sedov equations (e.g., Gorenstein & Tucker 1976). For typical SNR parameters (explosion energy ergs, ambient density cm-3), we have calculated the temperature, shock velocity, and radius, as well as the fraction of the radiated flux emitted in the 2–10 keV band, as a function of time. As the swept-up material decelerates the shock, the temperature falls and the X-ray luminosity rises. However, the fraction of the emission in the 2–10 keV band also falls once km s-1 ( yr), such that, for yr, the 2–10 keV band luminosity is constant to within a factor of two, with an average value of erg s-1; for later times, the emission in this band rapidily declines into insignificance. Thus, the integrated contribution from thermal remnant emission is erg s erg; dividing by our mean O-star lifetime gives erg s-1 per O star or roughly 1-2% of the HMXB contribution.
In addition to heating ambient gas and supernova ejecta, the shock wave sweeps up magnetic fields and accelerates particles to relativistic energies. The primary consequence of this is the bright radio emission associated with SNRs. However, for young remnants at least, the particle spectrum extends to very high energies, producing detectable synchrotron radiation in the X-ray band. The 2–10 keV X-ray luminosity of the historical remnant SN1006 is dominated by such synchrotron emission (Koyama et al. 1995), and evidence for such nonthermal radiation has recently been detected in several other young remnants (Petre et al. 1999 and references therein). Indeed, Petre et al. claim that there is evidence that all young remnants have an X-ray synchrotron component, and that we only see this as a dominant contributor to the remnant’s X-ray emission when the SN takes place in a very low density region of the interstellar medium and thus can form no significant reverse shock to illuminate the ejecta. The synchrotron luminosities of these sources are typically of the thermal , and the timescale over which this component is significant is less than that for the thermal emission. Thus, its overall contribution to the hard X-ray luminosity is almost certainly that of the HMXB contribution.
One of the most luminous hard X-ray sources in the Galaxy is the Crab Nebula, a remnant of the supernova of 1054 AD powered by rotational kinetic energy loss from the young neutron star created in the explosion; in the 2–10 keV band, ergs s-1 (Harnden & Seward 1984). While often characterized as the prototypical young neutron star, the Crab is, in fact, not typical. For example, the SN of 1181 AD also produced a pulsar-powered synchrotron nebula (3C 58), but its 2–10 keV X-ray luminosity is times lower at only ergs s-1, despite its slightly younger age (Helfand, Becker, & White 1995). Furthermore, evidence for young pulsars in the remnants of other core collapse supernovae has been notoriously difficult to find, and while more than three dozen such cases of SNR/neutron star associations have now been suggested, none produce X-ray luminosities within a factor of five of the Crab pulsar (see Helfand 1998 for a review). Broad distributions of initial spin period and magnetic field strength for newly born neutron stars are likely to be responsible for the wide range of properties observed.
A firm upper limit on the contribution such objects can make to the hard X-ray luminosity of a young stellar population can be derived by assuming that all neutron stars are born with msec, yielding a total rotational kinetic energy of erg, where g cm2) is the star’s moment of inertia and is the rotational frequency. For the Crab, the fraction of the rotational kinetic energy loss rate emerging in the 2–10 keV band is ; other young Crab-like remnants such as 0540-693 in the LMC and 1509-58 show similar ratios of . Thus, the upper limit to the contribution of young pulsar nebulae to the 2–10 keV luminosity of an OB population is erg , where is the fraction of supernovae that produce neutron stars, and is the fraction of the Crab spin-down luminosity of the average young neutron star. Although the mass cut dividing black hole and neutron star remnants of core collapse events is unknown, is likely to be of order unity. The quantity is less well-determined, but is clearly much less than unity: for a core-collapse SN rate of one per century, there should be ten sources with in the Galaxy. In fact, there is only one source at 0.2 (G29.7-0.3; Helfand & Blanton 1996) and no other sources within an order of magnitude. We adopt , although we regard this as a conservative upper limit. Thus, the X-ray luminosity contribution from pulsar synchrotron nebulae could be as high as ergs s-1 per O star or roughly 10% of the HMXB contribution; if, as seems to be the case in the Galaxy, the median X-ray luminosity of young neutron stars is at least a factor of ten less than that of the Crab, the contribution of synchrotron nebulae will be of the HMXB value.
The final source of X-ray emission resulting from a SN explosion is the thermal emission from the hot surface of the young neutron star and the nonthermal emission from its magnetosphere. Since rapid neutrino cooling reduces the surface temperature to under K within a few decades, the contribution of thermal emission in the 2–10 keV band is completely negligible. Nonthermal pulsed emission in the Crab accounts for only of the total nonthermal emission produced by the pulsar nebula. Becker and Trumper (1997) have shown that for a wide range of pulsar ages and magnetic field strengths; thus, magnetospheric X-ray emission from rotation-powered pulsars is negligible compared to the HMXB contribution.
5.4 Galactic Winds
The large mechanical energy input to the interstellar medium of a starburst galaxy from stellar winds and supernovae results in a pressure-driven wind of hot plasma. Such “superwinds” (e.g., Heckman, Armus, & Miley 1990) have been observed to be characteristic of galaxies with high star formation rates, and diffuse X-ray emission associated with them has been detected in a number of galaxies (e.g., M82, NGC 253 [Fabbiano 1988]; NGC 3256 [Moran, Lehnert, and Helfand 1999], etc.). The characteristic temperature of these winds, however is to keV, and their contribution to the galaxies’ emission above 2 keV is negligible.
6 HMXBs and the Hard X-ray Luminosities of Starburst Galaxies
Having characterized the dominant role of HMXBs in the production of hard X-rays in the Milky Way and other Local Group galaxies, we can now discuss the direct contribution of OB stars and their remnants to the total hard X-ray luminosities of galaxies undergoing bursts of star formation. To do this, we need to relate the specific X-ray luminosity per O star to observable quantities for nearby starbursts—total hard X-ray flux and infrared luminosity.
The integrated 2–10 keV X-ray luminosity of high-mass binaries in a star-forming galaxy can be expressed as , where is an adopted value of the specific X-ray luminosity per O star for HMXBs, and is the actual number of O stars present. Assuming an IMF slope of 2.35, an upper mass cutoff of 100 , and solar metallicity, the models of Leitherer & Heckman (1995) predict that a region producing stars at a constant rate of 1 yr-1 for at least yr will have O stars and an associated bolometric luminosity of ergs s-1. Provided that the young stellar population dominates the host galaxy’s bolometric luminosity—which is approximately equal to its total infrared luminosity —the number of O stars can be scaled for a system of arbitrary star-formation rate: . The binary luminosity expression then becomes , or in terms of fluxes, .
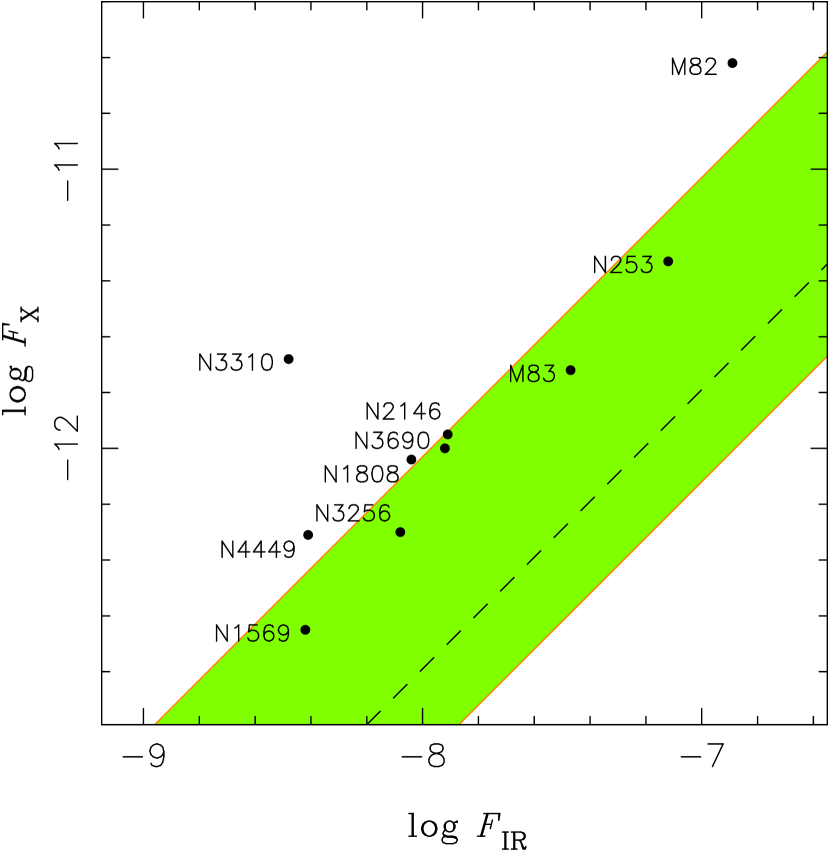
Using the latter equation, we have computed the range of HMXB X-ray fluxes expected at a given IR flux for the range of Local Group values of . These are represented by the shaded region in Figure 1. This region is bounded on the lower-right by the specific X-ray luminosity per O star derived from direct counts of HMXBs and O stars in the solar neighborhood ( ergs s-1 star-1), and on the upper-left by the value of ergs s-1 star-1 obtained for the SMC and M31. The dashed line represents the upper limit derived for the solar neighborhood which is roughly equal to the global Milky Way value. Also plotted in Figure 1 are the locations in the plane of several nearby starburst galaxies that have been studied with ASCA. The IR fluxes of these objects have been calculated from the highest reported IRAS flux densities using the prescription of Sanders & Mirabel (1996). Their 2–10 keV X-ray fluxes have been collected from published ASCA results (references are provided in the figure caption). Note that the X-ray luminosities of the starbursts span several orders of magnitude, from ergs s-1 (NGC 1569 and NGC 4449) to ergs s-1 (NGC 253 and NGC 2146) to ergs s-1 (NGC 3256 and NGC 3690).
Several important conclusions can be drawn from Figure 1. First, there is a clear tendency for the 2–10 keV X-ray fluxes of starburst galaxies to increase with , indicating that their hard X-ray luminosities are largely governed by sources whose contributions are proportional to the star-formation rate. As discussed in the previous section, HMXBs are expected to dominate over all other such contributors. However, in order for HMXBs to account for all of the hard X-rays produced in starbursts, their typical output per O star must be significantly greater than that observed in the Milky Way or the LMC. Even in the starburst galaxies with the lowest ratios (NGC 1569, NGC 3256, M83, and NGC 253), HMXBs would have to exhibit values that are 5 times higher than the Milky Way’s. Both direct observations and population syntheses (e.g., Dalton & Sarazin 1995) indicate that the bulk of the X-ray emission of a binary population arises from the small fraction of objects with the highest individual luminosities. Thus, if HMXBs produce most of the hard X-ray flux of starburst galaxies, we would expect such systems to have many more high-luminosity objects (per O star) than the Milky Way and the LMC. For the nearest starbursts (including several of the objects in Fig. 1), this hypothesis is testable with high-resolution Chandra observations.
The good correlation between and stands in contrast to the large scatter in a plot of vs. , the blue optical flux, from these same galaxies. Thus, unlike normal galaxies which show a tight correlation between and (Fabbiano 1989)—i.e., the X-ray luminosity is proportional to the light from the whole stellar population and is dominated by long-lived, low-mass X-ray binary emission—in starbursts, the dominant X-ray production is associated with the young stellar population.
Two objects, M82 and NGC 3310, deviate significantly from the trend exhibited by the other starburst galaxies in Figure 1.111M82 contains a variable hard X-ray source (Matsumoto & Tsuru 1999) that can, in outburst, dominate the 2–10 keV emission of the galaxy. However, preliminary Chandra results (Griffiths et al. 1999) indicate that there are many other sources of hard X-ray emission in M82 as well. The X-ray flux of M82 shown in Figure 1, from Moran & Lehnert (1997), is the lowest flux measured by ASCA; it is likely to represent the integrated contribution of the “quiescent” sources of hard X-ray luminosity in the galaxy. The X-ray fluxes of these two objects are clearly inconsistent with the level of emission expected from an HMXB population, even one similar to that of the SMC, suggesting that each galaxy possesses an extra component of hard X-ray luminosity that is weak (or absent) in the other starbursts. Indeed, Chandra images of NGC 253 (Strickland et al. 2000) and M82 (Griffiths et al. 1999), which have similar IR luminosities but 2–10 keV X-ray luminosities that differ by at least a factor of 5, reveal strikingly different hard X-ray morphologies. The hard X-ray flux of NGC 253 is produced almost entirely by discrete sources, whereas in the more luminous M82, about half of the hard X-ray emission arises from a diffuse component coincident with the most active region of star formation. We have suggested previously (Moran & Lehnert 1997; Moran, Lehnert, & Helfand 1999) that inverse-Compton scattered emission, resulting from the interaction of IR photons with supernova-generated relativistic electrons, may in some circumstances contribute appreciably to the hard X-ray fluxes of starburst galaxies. M82 and NGC 3310 thus represent the best sites for the investigation of this possibility.
7 Starbursts and the X-ray Background
We have demonstrated that the hard (2–10 keV) X-rays produced directly by a population of OB stars, their remnants, and their accompanying lower-mass brethren are dominated by the small fraction of massive stars that form X-ray binaries. Despite our efforts to assess with care the long-term mean luminosities of such systems through our use of the ASM database and our consistent methods for deducing O-star number counts, we find a range of an order of magnitude in the specific X-ray luminosity per O star among the galaxies of the Local Group. While the specific luminosities of M33 and the SMC are each dominated by a single source, and, as we have argued, could plausibly have a long-term value within a factor of 2 of the Milky Way, M31 remains an outlier. It is possible that only a small fraction of the 34 luminous X-ray sources coincident with star-forming regions in that galaxy are HMXBs, although no other Local Group galaxy shows a similar population of bright, non-HMXB objects. Alternatively, the O-star population of M31 could have been severely underestimated if a large fraction () of its Lyman continuum photons escape from the galaxy without ionizing a hydrogen atom. Were either (or both) of these scenarios to hold, and were we to ignore the bright single sources in M33 and the SMC (a somewhat uncomfortable chain of assumptions), the specific X-ray luminosity per O star in Local Group members could all fall within a factor of two of erg s-1 per O star.
In this case, the starburst galaxies would all require a source of X-ray luminosity in addition to the direct contributions of the OB star population. Even if we allow the full observed range of specific luminosities and brand the Milky Way as atypical, however, some starbursts still require an additional hard X-ray component. While a buried active nucleus is a plausible candidate, Chandra observations have ruled this out in the case of M82. The diffuse nature of a significant fraction of the hard X-ray flux from M82 is consistent with our suggestion of IC emission as the origin of this additional component. The fact that the less intense and more diffuse starburst in NGC 253 (1) shows no significant diffuse hard emission, and (2) falls within the band predicted from binaries alone, is also consistent with this picture, since the predicted IC luminosity from NGC 253 would be negligible.
Natarajan and Almaini (2000) have recently used global energetics arguments to conclude that OB stars and their products (HMXBs and SNRs) contribute at most of the X-ray background at energies above 2 keV. They (reasonably) assume the HMXB population tracks the global star formation rate, although their normalization assumes a Milky Way hard X-ray luminosity a factor of 2.5 lower than we derive in §3.2, and, thus, a factor of below the mean value for the Local Group. In addition, as they note, extra contributions such as IC emission are not included in their calculation. Thus, we conclude it remains plausible that a significant contribution to the hard X-ray background arises from starburst galaxies.
It should be emphasized that such a conclusion is not inconsistent with existing deep-field X-ray source counts or faint X-ray source identifications. Given the steep redshift dependence of the star formation rate, the vast majority of the XRB contribution from starbursts will arise at redshifts greater than 1. To illustrate, we use the results of Moran et al. (1999) in which we showed that, owing to the tight correlation between far IR and centimetric radio emission for starburst galaxies (and the correlation shown in Figure 1 between far-IR and X-ray luminosity in these same galaxies), faint radio source counts can be used to constrain the surface density of starburst XRB contributors. For a 75% starburst fraction (Richards 1998) in the radio flux density range, arcmin-2 (Fomalont et al. 1991). The ROSAT Deep Survey in the Lockman Hole (Hasinger et al. 1998) had a 0.5–2.0 keV limit of erg cm-2 s-1 for their complete sample of 50 sources over deg2. Using the ratio of 5 keV to 5 GHz flux density for starbursts found in Moran et al. (1999), ergs cm-2 s-1 keV, this implies an equivalent radio flux density limit of mJy;222To compare the radio source counts to the core X-ray/radio flux density ratio, we multiply the core radio flux density by a factor of 2 (a typical ratio for local starbursts). Even if we assume the entire radio flux density is from the nuclear starburst, we still expect and sources in the ROSAT and Chandra surveys, respectively. assuming an X-ray spectral index of as observed in NGC 3256, we should then expect starbursts deg-2 or 0.1 such sources in the survey. For the largest Chandra Deep Survey published to date (Giacconi et al. 2000), the 2–10 keV limit is erg cm-2 s-1 which corresponds to a 5.7 mJy radio flux density and an expected surface density of 2.2 sources deg-2, or sources in the 0.096 deg2 survey area.
In summary, the deepest surveys yet performed have not gone deep enough to reveal the population of starbursts at their expected luminosities. The continued flattening of the AGN-dominated X-ray log-log seen by Chandra observations at 2–10 keV flux levels above erg cm-2 s-1 strengthens the requirement for a new population of objects at fainter fluxes in order to account for the remaining 20-25% of the X-ray background. Starburst galaxies remain an attractive candidate, and deeper Chandra surveys should begin to find them at a surface density of 30 deg-2 ( per Chandra field) when a flux threshold of erg cm-2 s-1 is reached.
References
- (1) Alcock, C., & Paczyinski, B. 1978, ApJ, 223, 244
- (2) Angelini, L., White, N.E., & Stella, L. 1991, ApJ, 371, 332
- (3) Awaki, H., Ueno, S., Koyama, K., Tsuru, T., & Iwasawa, K. 1996, PASJ, 48, 409
- (4) Beck, R., & Gräve, R. 1982, A&A 105, 192
- (5) Becker, R.H., Helfand, D.J., & Szymkowiak, A.E. 1982, ApJ, 255, 557
- (6) Becker, W., & Trumper, J. 1997, A&A, 326, 682
- (7) Bookbinder, J., Cowie, L.L., Ostriker, J.P., Krolik, J.H., & Rees, M.R. 1980, ApJ, 237, 647
- (8) Chen, W., & White, R.L. 1991, ApJ, 366, 512
- (9) Chevalier, C., & Ilovaisky, S.A. 1998, A&A, 330, 201
- (10) Chlebowski, T., Harnden, F.R. Jr., & Sciortino, S. 1989, ApJ, 341, 427
- (11) Clark, G., Doxsey, R., Li, F., Jernigan, J.G., & van Paradijs, J. 1978, ApJ, 221, L37
- (12) Clark, G., Li, F., & van Paradijs, J. 1979, ApJ, 227, 54
- (13) Coe, M.J., Burnell, S.J.B., Engel, A.R., Evans, A.J., & Quenby, J.J. 1981, MNRAS, 197, 247
- (14) Cooke, B.A., Fabian, A.C., & Pringle, J.E. 1978, Nature, 273, 645
- (15) Cooper, R.G., & Owocki, S.P. 1994, Ap&SS, 221, 427
- (16) Cowley, A.P., Crampton, D., Hutchings, J.B., Remillard, R., & Penfold, J.E. 1983, ApJ, 272, 118
- (17) Dalton, W.W., & Sarazin, C.L. 1995, ApJ, 448, 369
- (18) Davison, P.J.N. 1977, MNRAS, 179, 15P
- (19) Della Ceca, R., Griffiths, R.E., Heckman, T.M, & MacKenty, J.W. 1996, ApJ, 469, 662
- (20) Della Ceca, R., Griffiths, R.E., & Heckman, T.M. 1997, ApJ, 485, 581
- (21) Della Ceca, R., Griffiths, R.E., Heckman, T.M, Lehnert, M.D., & Weaver, K.A. 1999, ApJ, 514, 772
- (22) Devereux, N.A., Price, R., Wells, R.A., & Duric, N. 1994, AJ, 108, 1667
- (23) Dewey, R.J., & Cordes, J.M. 1987, ApJ, 321, 780
- (24) Dubus, G., Charles, P.A., Long, K.S., & Hakala, P.J. 1997, ApJ, 490, L50
- (25) Dubus, G., Charles, P.A., Long, K.S., Hakala, P., & Kuulkers, E. 1999, MNRAS, 302, 731
- (26) Fabbiano, G. 1988, ApJ, 330, 672
- (27) Fabbiano, G. 1989, ARAA, 27, 87
- (28) Feldmeier, A., Kudritzki, R.-P., Palsa, R., Pauldrach, A.W.A., & Puls, J. 1997, A&A, 320, 899
- (29) Fomalont, E.B., Windhorst, R.A., Kristian, J.A., & Kellerman, K.I. 1991, AJ, 102, 1258
- (30) Giacconi, R., et al. 2000, preprint (astro-ph/0007240)
- (31) Gorenstein, P., & Tucker, W.H. 1976, ARA&A, 14, 373
- (32) Griffiths, R.E., Ptak, A., Feigelson, E., Brandt, N., Bregman, J., Townsley, L., Garmire, G., & Sambruna, R. 1999, BAAS, 31, 1509
- (33) Griffiths, R.E., & Padovani, P. 1990 ApJ, 360, 483
- (34) Gruber, D.E., & Rothschild, R.E. 1984 ApJ, 283, 546
- (35) Haberl, F., & Pietsch, W. 1999, A&A, 344, 521
- (36) Haberl, F., Filipovic, M.D., Pietsch, W., & Kahabka, P. 2000, A&AS, 142, 41
- (37) Harnden, F.R. Jr., & Seward, F.D. 1984, ApJ, 283, 279
- (38) Hasinger, G., Burg, R., Giancconi, R., Schmidt, M., Trumper, J., & Zamorani, G. 1998, A&A, 329, 482
- (39) Heckman, T.M., Armus, L., & Miley, G.K. 1990, ApJS, 74, 833
- (40) Helfand, D.J. 1984, PASP, 96, 913
- (41) Helfand, D.J., Becker, R.H., & White, R.L. 1995, ApJ, 453, 741
- (42) Helfand, D.J., & Blanton, E.L. 1996, ApJ, 470, 961
- (43) Helfand, D.J. 1998, in The Relationship Between Neutron Stars and Supernova Remnants, eds. R. Bandiera, E. Masini, F. Pacini, M. Salvati, & L. Woltjer, Memorie della Societa Astronomica Italiana, Vol. 69, No. 4, 791
- (44) Hill, R.J., Madore, B.F., & Freedman, W.L. 1994, ApJ, 429, 204
- (45) Høg, E. et al. 1997, A&A, 323, L57
- (46) Howarth, I.D. 1982, MNRAS, 198, 289
- (47) Hutchings, J. 1984, in Structure and Evolution of the Magellanic Clouds (Dordrecht: D. Reidel), 305
- (48) Hutchings, J.B., Crampton, D., Cowley, A.P., Bianchi, L., & Thompson, I.B. 1987, AJ, 94, 340
- (49) Israel, F.P. 1980, A&A, 90, 246
- (50) Kahabka, P., & Pietsch, W. 1996 A&A, 312, 919
- (51) Kelley, R.L., Jernigan, J.G., Levine, A., Petro, L.D., & Rappaport, S. 1983, ApJ, 264, 568
- (52) Kennicutt, R.C., & Hodge, P.W. 1986, ApJ, 306, 130
- (53) Koyama, K., Hamaguchi, K., Ueno, S., Kobayashi, N., & Feigelson, E.D. 1996, PASJ, 48, L87
- (54) Koyama, K., Petre, R., Gotthelf, E.V., Hwang, U., Matsura, M. Ozaki, M., & Holt, S.S. 1995, Nature, 378, 255
- (55) Leitherer, C., & Heckman, T.M. 1995, ApJS, 96, 9
- (56) Levine, A., Rappaport, S. Deeter, J.E., Boynton, P.E., & Nagase,F. 1993, ApJ, 410, 328
- (57) Levine, A.M., Bradt, H., Cui, W., Jernigan, J.G., Morgan, E.H., Remillard, R., Shirley, R.E., & Smith, D.A. 1996, ApJ, 469, L33
- (58) Lipunov, V.M., Postnov, K.A., & Prokhorov, M.E. 1997, AstL 23, 492
- (59) Long, K.S., Helfand, D.J., & Grabelsky, D.A. 1981, ApJ, 248, 925
- (60) Long, K.S., D’Odorico, S., Charles, P.A., & Dopita, M.A. 1981, ApJ, 246, L61
- (61) Long, K.S., Charles, P.A., Blair, W.P., & Gordon, S.M. 1996, ApJ, 466, 964
- (62) Lucy, L.B., & White, R.L. 1980, ApJ, 241, 300
- (63) Makishima, K., et al. 1989, PASJ, 41, 697
- (64) Markert, T.H., & Rallis, A.D. 1983, ApJ, 275, 571
- (65) Massey, P., Lang, C.C., Degioia-Eastwood, K., & Garmany, C.D. 1995, ApJ, 438, 188
- (66) Matsumoto, H., & Tsuru, T. 1999, PASJ, 51, 321
- (67) Meurs, E.J.A., & van den Heuvel, E.P.J. 1989, A&A, 226, 88
- (68) Moran, E.C., & Lehnert, M.D. 1997, ApJ, 478, 172
- (69) Moran, E.C., Lenhert, M.D., & Helfand, D.J. 1999, ApJ, 526, 649
- (70) Natarajan, P., & Almaini, O. 2000, MNRAS, (in press: astro-ph/0007151)
- (71) O’Connell, R.W. 1983, ApJ, 267, 800
- (72) Oey, M.S., & Kennicutt, R.C. 1998 PASA, 15, 141
- (73) Okada, K., Mitsuda, K., & Dotani, T. 1997, PASJ, 49, 653
- (74) Pakull, M., Brunner, H., Staubert, A., Pietsch, W., & Beuermann, K. 1985, SSRv, 40, 379
- (75) Pallavicini, R., Peres, G., Serio, S., Vaiana, G.S., Golub, L., & Rosner, R. 1981, ApJ, 248, 279
- (76) Peres, G., Reale, F., Collura, A., & Fabbiano, G. 1989, ApJ, 336, 140
- (77) Petre, R., Allen, G.E., & Hwang, U. 1999, Astr. Nach., 320, 199
- (78) Pietsch, W., Rosso, C., & Dennerl, K. 1989, in 23rd ESLAB Symposium, vol 1, 573
- (79) Perryman, M.A.C., et al. 1997, A&A, 323, L49
- (80) Portegies-Zwart, S.F., & Verbunt, F. 1996, A&A, 309, 179
- (81) Portegies-Zwart, S.F., & van den Heuvel, E.P.J. 1999, NewA, 4, 355
- (82) Price, R.E., Groves, D.J., Rodrigues, R.M., Seward, F.D., Swift, C.D., & Toor, A. 1971, ApJ, 168, L7
- (83) Ptak, A., Serlemitsos, P., Yaqoob, T., Mushotzky, R. & Tsuru, T. 1997, AJ, 113, 1286
- (84) Richards, E.A. 1998, BAAS, 30, 1326
- (85) Sanders, D.B., & Mirabel, I.F. 1996, ARA&A, 34, 749
- (86) Schulman, E., & Bregman, J.N. 1995, ApJ, 441, 568
- (87) Seward, F.D., & Mitchell, M. 1981, ApJ, 243, 736
- (88) Slane, P., Hughes, J.P., Edgar, R.J., & Plucinsky, P.P. 1999, BAAS, 31, 1418
- (89) Stewart, G.C., Fabian, A.C., Terlevich, R.J., & Hazard, C. 1982, MNRAS, 200, P61
- (90) Stothers, R. 1972, PASP, 84, 373
- (91) Strickland, D., Heckman, T.M., Weaver, K.A., & Dahlem, M. 2000, AJ (in press: astro-ph/0008182)
- (92) Supper, R. Hasinger, G., Pietsch, W., Truemper, J., Jain, A., Magnier, E.A., Lewin, W.H.G., & van Paradijs, J. 1997, A&A, 317, 328
- (93) Takano, M., Mitsuda, K., Fukazawa, Y., & Nagase, F. 1994, ApJ, 436, L47
- (94) Terman, J., Taam, R.E., & Savage, C.O. 1998, MNRAS, 293, 113
- (95) Trinchieri, G., Fabbiano, G., & Peres, G. 1988, ApJ, 325, 531
- (96) Vacca, W.D. 1994, ApJ, 421, 140
- (97) van den Bergh, S., & Tammann, G.A. 1991, ARA&A, 29, 363
- (98) van Paradijs, J. 1995 in X-ray Binaries, eds. W.H.G. Lewin, J. van Paradijs, & E.P.J. van den Heuvel (Cambridge: Cambridge University Press), 536
- (99) van Speybroeck, L., Epstein, A., Forman, W., Giacconi, R., Jones, C., Liller, W. & Smarr, L. 1979, ApJ, 234, L45
- (100) Walterbos, R.A.M., & Braun, R. 1994, ApJ, 431, 156
- (101) Wang, Q.D., Hamilton, T., Helfand, D.J., & Wu, X. 1991, ApJ, 372, 475
- (102) Wang, Q.D., & Wu, X. 1992, ApJS, 78, 391
- (103) Wang, Q.D., & Helfand, D.J. 1991, ApJ, 370, 541
- (104) Wang, Q.D. 1995, ApJ, 453, 783
- (105) White, N.E., & Marshall, F.E. 1984, ApJ, 281, 354
- (106) Whitlock, L., & Lochner, J.C. 1994, ApJ 437, 841
- (107) Wills, A.J., Schild, H., & Stevens, I.R. 1995, A&A, 298, 549
- (108) Wojdowski, P., Clark, G.W., Levine, A.M., Woo, J.W., & Zhang, S.N. 1998, ApJ, 502, 253
- (109) Wood, D.O.S., & Churchwell, E. 1989, ApJ, 340, 265
- (110) Xu, C., & Helou, G. 1996, ApJ, 456, 152
- (111) Yamauchi, S., & Koyama, K. 1993, ApJ, 405, 268
- (112) Yamauchi, S., Koyama, K., Sakano, M., & Okada, K. 1996, PASJ, 48, 719
- (113) Zezas, A.L., Georgantolpoulos, I., & Ward, M.J. 1998, MNRAS, 301, 915