Chemical composition and origin of nebulae around Luminous Blue Variables
Abstract
We use the analysis of the heavy element abundances (C, N, O, S) in
circumstellar nebulae around Luminous Blue Variables
to infer the evolutionary phase in which the
material has been ejected. We concentrate on four aspects.
(1) We discuss the different effects that may have changed the gas
composition of the nebula since it was ejected: mixing with the
swept up gas from the wind-blown bubble, mixing with the gas from the
faster wind of the central star, and depletion by CO and dust.
(2) We calculate the expected abundance changes at the stellar surface
due to envelope convection in the red supergiant phase. We show that
this depends strongly on the total amount of mass that was lost
prior to the onset of the envelope convection. If the observed LBV
nebulae are ejected during the red supergiant phase, the abundances
of the LBV nebulae require a significantly smaller amount of mass
to be lost than assumed
in the evolutionary calculations of Meynet et al. (1994).
(3) We calculate the changes in the surface composition during
the main sequence phase by rotation induced mixing.
If the nebulae are ejected at the end of the main
sequence phase, the abundances
in LBV nebulae are compatible with mixing times between and years. These values are reasonable,
considering the high rotational velocities of main sequence O-stars.
The existence of ON stars supports this scenario.
(4) The predicted He/H ratio in the nebulae, derived from the
observed N/O ratios, are significantly smaller than the current observed
photospheric values of their central stars. This indicates
that either (a) the nebula was ejected from a star that had an
abundance gradient in its envelope, or (b) that
fast mixing on a time scale of years must have occurred in the
stars immediately after the nebula was ejected.
Combining various arguments we show that the LBV nebulae are
ejected during the blue
supergiants phase and that the stars have not
gone through a red supergiant phase. The chemical enhancements are
due to rotation induced mixing, and the ejection is possibly
triggered by near-critical rotation.
During the ejection, the outflow was
optically thick, which resulted in a large effective
radius and a low effective temperature. This explains why the
observed properties of the dust around LBVs closely
resemble the properties of dust formed around red supergiants.
1 Introduction
Luminous Blue Variables (LBVs) are very luminous stars with log 5.0 to 6.3 and variable spectral types between about O9 and A (Humphreys & Davidson, 1994). In the HR diagram, they are located in close proximity to the observed luminosity upper limit for very massive stars, the Humphreys-Davidson (HD) limit. This upper limit suggests that stars above log do not evolve into red supergiants (RSG) but that they are prevented from doing so by very severe mass loss in the previous phases.
From an observational point of view, LBVs are characterised by extreme instability, violent eruptions - with visual brightness increases of 3 magnitudes or more - and high mass loss. The material ejected (up to several solar masses) is often observed in the form of spectacular associated nebulae (Nota et al. 1995). In between such dramatic outbursts, LBVs still lose mass at high rates – typically 10-5-10-4 M⊙/yr (e.g. Leitherer 1997). The properties of LBVs are reviewed by Humphreys & Davidson (1994) and in the proceedings of a dedicated workshop by Nota & Lamers (1997). The ejected nebulae around LBVs have been found to have typical diameters of 0.5 to 2 pc, an expansion velocity between 25 and 140 km s-1 , and a dynamical age of 5 to 5 years. The exceptions are Car and P Cygni whose ejecta have higher velocities and much shorter dynamical ages (for a comprehensive discussion of LBV nebular properties, see review by Nota & Clampin, 1997).
LBV’s are believed to be the precursors of Wolf-Rayet stars. However, the evolutionary phase of LBVs is still poorly understood: their instability and related nebula ejection is believed to occur during the post main sequence life of a massive star, but it is not clear exactly when and how. When the star is still on the main sequence, the O star wind creates a wind-blown bubble with a radius of at least 50 pc. This bubble contains the hot, shocked wind from the main sequence phase. The LBV nebula is then formed within this cavity by rapid mass loss during the LBV instability phase. Subsequently, in the Wolf-Rayet phase, the fast and dense wind collides with the LBV nebula. Waters et al (1997, 1998, 1999) and Voors et al. (2000) have studied the properties of the dust in LBV nebulae and argued on the basis of the dust properties (composition, grain size) that the dust is very similar to that of RSGs. They conclude that the dust in LBV nebulae was ejected under very similar conditions, most likely when the star was a RSG.
Smith et al. (1998) derived the N and O abundances of several LBV nebulae, and noticed that the N/O abundance ratios are higher than for initial composition gas, but smaller than for gas with CNO-equilibrium abundances. In fact, they show that the abundances are quite similar to those predicted for RSGs in the evolutionary models of the Geneva group (Meynet et al. 1994). Smith et al. discuss the problem of reconciling their nebular N/O ratios with the observed absence of RSG at high luminosities by postulating a pseudo-RSG phase. They suggest that if the star does not lose enough mass in the blue phase, than it could encounter its Eddington limit, develop a convective envelope in response and become very bloated such that the star will appear as a RSG for a brief period.
From a theoretical point of view, two different approaches have
been recently presented to explain the occurrence of the LBV instability:
1) Langer et al. (1994) have proposed a mechanism based on enhanced
mass loss, dominant towards the end of the core hydrogen
burning evolution. This high mass loss maintains the star on the blue
side of the HR diagram. The ignition of the
H-burning shell forces the stellar radius to increase, and the
corresponding redward evolution of the star in the HR diagram results
in a destabilization of the envelope due to the proximity to the
Eddington limit (Lamers & Fitzpatrick, 1988; Lamers & Noordhoek
1993). The star experiences extreme mass loss (as high as 5
10-3 M⊙/yr) which involves the enriched stellar surface
layers. This phase
corresponds to the observed LBV instability, and the mass ejection occurs
therefore when the star is a blue supergiant. Due to the
large mass-loss rates in the LBV phase, the evolution of the star into
a RSG is avoided.
2) Alternatively, models of Stothers & Chin (1993, 1996)
predict that the major mass-loss occurs in a single ejection event
during a brief RSG phase. They find that the star rapidly
moves redward in the HR diagram after core hydrogen exhaustion. An
instability is then triggered
by the recombination of hydrogen and helium as a result of the envelope
expansion, leading to the rapid loss of the H-rich envelope. The star
then moves back to the blue and becomes a true LBV. The mass ejection
occurs while the star is in a brief RSG phase, before the LBV phase.
The problem with the first scenario is that the nature of the instability is not completely understood. The challenge to the second scenario is that the HD limit shows that no RSG exist with (Humphreys and Davidson 1979). This implies that two of the standard LBVs, AG Car in the Galaxy and R 127 in the LMC, cannot have been RSGs (except maybe for a short time of years).
In reality, we still do not know the evolutionary phase at which the LBV nebulae are ejected. One way to address this problem is to study the LBV surface chemical composition. However, atmospheric analyses of heavy element abundances can be very uncertain. Alternatively, we can study the abundance determinations of the circumstellar ejected nebulae, and compare the results with the predicted surface composition for massive stars during various phases of their evolution, including the effects of mass loss, convective mixing in the core and in the envelope and rotation induced mixing.
Some predictions have already been made on what one should expect:
hydrodynamical models of the evolution of the circumstellar environment
of a 60 M⊙ star have been made by García-Segura et al.
(1996a) as the star transitions from an O star to an LBV and then to a
WR star. They predict that the LBV nebula will have CNO equilibrium
abundances. However, LBV nebular abundance studies of Smith et al.
(1997, 1998) have shown that the observed N/O ratios are closer to
CN-equilibrium values. This suggests that the nebulae
were created by the ejection of surface layers that consist of a
mixture of CN-processed gas and original gas.
In this paper we study which effects can produce the abundances
that are observed in the LBV nebulae. We consider mixing by
convection of the outer layers in the red supergiant phase,
and by rotation induced mixing during the main sequence phase.
(a) In the case of convective mixing, the resulting surface abundance
in the red supergiant phase depends critically
on the total amount of mass that was lost during the main
sequence phase. If the LBV nebulae are ejected during the
RSG phase, we can determine the amount of mass that was lost
prior to the envelope ejection.
(b) In the case of rotation induced mixing,
the surface abundance at the end of the main sequence phase depends
critically on the ratio between the mixing time and the main sequence
lifetime. If the LBV nebulae are ejected in the blue supergiant phase
after the main sequence, we can determine the mixing timescale during
the main sequence phase.
We will compare the observed abundances of the LBV nebulae
with both sets of predictions. Combining this with information about the
dynamical age, the mass, the ejection velocity and the
morphology of the nebulae, we can determine at which evolutionary
stage the LBV nebulae were ejected.
In Sect. 2 we discuss the observed properties of the LBVs. In Sect. 3 we describe the effects that may have influenced the abundances of the nebulae since their ejection. In Sect. 4 we derive estimates for the mixing in the star, either convective or rotation-induced, that must have occurred to explain the observed N/O and N/S ratios in the nebulae. Sect. 5 gives a description of the predicted changes in the surface abundances of massive stars in the red supergiant (RSG) phase due to the convective envelope, and the way in which the abundances depend on the mass loss prior to the RSG phase. The results are compared with the observed abundance ratios of the nebulae. In Sect. 6 we give a description of the changes in the surface composition of the stars due to rotation induced mixing during the main sequence phase. If the nebulae are ejected in the blue supergiant phase, their abundances can be used to derive empirical estimates of the mixing time. In Sect. 7 we apply the results of the previous sections to determine the evolutionary phase in which the LBV nebulae were ejected. The results are discussed in Sect. 8.
2 The observed properties of LBV nebulae
2.1 The nebulae
Most LBVs and related transition objects (eg. Ofpe/WN9 stars) display associated circumstellar nebulae, which are spatially resolved both in ground-based observations using coronography and by direct imaging with HST. These nebulae are very similar in terms of morphological and physical properties. They are typically 1 parsec in size, with morphologies which are mildly to extremely bipolar, with the possible exception of the nebula around P Cygni (Barlow et al. 1994; Nota et al. 2000). They expand in the surrounding medium with velocities of the order of 25 – 140 km s-1. Their size and expansion velocities identify dynamical timescales which are of the order of years. Their spectra show typical nebular emission lines (H, [NII] 6548, 6583, 5755, [OII] 3726, 3729, [SII] 6717, 6731) which can be used to derive the nebular physical and chemical properties. Densities derived from the [SII] 6717, 6731 line ratio are generally found to be low (500 - 1000 cm-3) and the temperatures, derived from the ratio of the [NII] lines, are in the range 5000 - 10000K.
The abundances and dynamical stuctures of the LBV nebulae can be used to study at what phase of the evolution of the central star these nebulae were ejected. We have selected four stars for which the nebula has been studied in detail. These include AG Car and P Cygni in the Galaxy, and R 127 and S 119 in the LMC. We have omitted the well known LBV Car, that was studied by Dufour et al. (1997) and Ebbets et al. (1997), because of its peculiar nature. The nebula around R 143 is also omitted, because Smith et al. (1998) showed that the nebula is not associated with the star.
The properties of the four selected LBVs and their nebulae are summarized in Table 3. We list the distance and the luminosity, but not the radius or effective temperature because these values are variable for LBVs. We give the photospheric Helium abundance. The parameters are from compilations by Humphreys & Davidson (1994), Crowther (1997), Nota & Clampin (1997) and from Crowther & Smith (1997). The Table also shows the parameters of the nebulae, such as velocity, dynamical age, mean density and temperature, as well as the nebular abundances. The data are from Nota and Clampin (1997), Smith et al. (1997; 1998) and Schulte-Ladbeck et al. (2000). Notice that all nebulae have an enhanced N-abundance by about 1 dex and a depleted O-abundance by -0.3 to -1.2 dex. For AG Carinae, Smith et al. (1997) derived a nitrogen enhancement of a factor 4.51.3 and an oxygen deficiency of a factor 15.17.2. Such mild enrichment is typical of material which has not reached CNO equilibrium. For the other two nebulae around R 127 and S 119, the abundance analysis (Smith et al. 1998) provided very similar results: for R 127, a N enrichment was found of a factor 10.72.2, and O depletion of 2.01.0, with N/O = 0.890.40; for S 119, Smith et al. (1998) were not able to secure an accurate electron temperature, and found a ratio N/O = 1.41 to 2.45, similar to the value determined for R 127 (Table 1).111Unless otherwise mentioned, all abundance ratios in this paper are number-ratios, e.g. N/O n(N)/n(O). For the P Cygni nebula, no accurate abundance analysis is currently available, except for the earlier work by Johnson et al. (1992), where N/S ratios are provided at one position in the nebula. In Table 1 we also give the number ratios N/H, N/O and N/S, which will be compared with evolutionary calculations. For the N/S ratios we only have upper limits because they are derived from the N+/S+ ratios with an unknown ratio S++/S+. Unfortunately we do not have reliable nebular S/H ratios which might have been used to derive the underabundance of H.
2.2 The accuracy of the observed abundance ratios
The accuracy of the derived abundances can be checked by comparing the sum of the C, N and O abundances to the initial abundance. Since the changes in the abundances of these elements are due to the mixing with products from the CN and the NO-cycles, the mass ratio of (C+N+O)/(H+He) at the stellar surface should remain constant during the evolution of the star, until the products of He-burning appear at the surface. If the nebulae had the initial ratio He/H=0.075, we would expect a number ratio (C+N+O)/H for the Galactic nebulae and for the LMC nebulae. If the He/H ratio in the nebula is about 0.2, as predicted on the basis of the observed N/O ratios (see later: Tables 2 and 3) then we expect (C+N+O)/H for Galactic nebulae and for the LMC nebulae. If the He/H ratio in the nebula is 0.40, as it is in the stellar photospheres, then the mass fraction of H has decreased by about a factor two and so we would expect ratios of (C+N+O)/H for the Galactic nebulae and for the LMC nebulae. We note that the contribution of C is only about 30 percent for gas with the initial composition, and much less for gas with CN-equilibrium composition. So for nebulae enriched in N we can replace the above mentioned C+N+O abundance with the N+O abundance to reasonable accuracy.
The data in Table 1 show that the observed number ratio (N+O)/H is about a factor two smaller than predicted for R 127 and S 119. For P Cygni the predicted value is within the wide range of the observed value. For AG Car the observed (N+O)/H ratio is about a factor five smaller than predicted. These discrepances are most likely due to errors in the determinations of the N/H and O/H ratio due to the inhomogeneity of the nebulae. In a non-homogeneous nebula that contains regions of different temperatures, either in the form of clumping or in the form of a temperature gradient, the strength of H is less affected than the strength of the forbidden lines, because the latter are collisionaly excited from their respective ion ground state, whereas the former is the product of H recombination. This results in a systematic overestimate of the electron temperature and, therefore, in a systematic underestimate in the derived ratios of metals relative to H (e.g., Peimbert 1967, Panagia & Preite Martinez 1975). In principle this can be tested by determining the S/H ratio, because S is not affected by the abundance changes inside the star. So the S/H ratio is a good measure of the changes in the H-content or of the errors in the abundance determinations due to inhomogeneities in the nebula. Unfortunately we only have an upper limit for the N/S ratio of the AG Car nebula, which does not provide a useful test.
We have calculated the strength of the observed forbidden lines for simple spherical nebular models with clumping, or with gradients in temperature or density, for a given input abundance. We then used the calculated line ratios to derive the mean electron density, the mean electron temperature and the resulting abundances, in the same way as done in the analysis of the observed spectra. The resulting abundance ratios were then compared to the input abundance ratios. We found for a large range of models and clumping factors, that the thus derived abundance ratios N/H, O/H and S/H can differ drastically from the input values, for the reason mentioned above, but that the abundance ratios of the metals, N/O and N/S, are very insensitive to clumping and temperature or density gradients (within about 0.1 dex for a wide range of clumping factors and gradients). For this reason we will concentrate on these ratios in the rest of this paper.
3 Does the gaseous nebular abundance reflect the abundance during ejection?
The atomic abundances of the gaseous component of the
LBV nebulae might be different from the
abundances of the nebula at the time of the ejection
due to several effects, which will be discussed and estimated below:
(a) a fraction of C and O may have been locked into CO and
several atomic species may be depleted due to dust,
in particular O and Si
(b) the nebula may have mixed with the gas of the interstellar (IS) bubble
into which it was ejected
(c) the nebula may have mixed with the
wind from the star after it was ejected.
3.1 Depletion of atomic species by CO and dust
Infrared studies of LBV nebulae have shown that they contain significants amounts of CO and dust (e.g. McGregor et al. 1988; Hutsémekers 1997). The analysis of ISO observations by Waters et al. (1997,1998, 1999) and Voors et al. (2000) have shown that most LBV nebulae contain O-rich dust, with a small contribution of C-rich PAHs. This dust is mainly in the form of amorphous silicates, such as MgFeSiO4 and Fe2SiO4, plus a minor contribution from crystalline silicates such as olivines and pyroxenes (Voors et al. 2000). Estimates of the dust mass vary between about and (Hutsemékers 1997; Lamers et al. 1996; Voors et al. 2000). However, the presence of dust or molecules does not affect the abundance ratios derived from the gaseous component. This is because the nebular gaseous abundances are determined from the ionized regions of the nebulae, where no corrections for the presence of dust, molecules and neutral atoms are needed.
3.2 The interaction of the nebula with the IS bubble or with the stellar wind
The ejected nebula runs into the interstellar bubble that was blown during the main sequence phase. Such an interaction may have changed the composition of the nebula from the outside. However, the density in the bubble is so low, on the order of atoms cm-3, that only about has been swept up. This is negligible compared to the mass of the nebula (Smith et al. 1997).
On the other hand, the stellar wind that is blowing since the nebula was ejected may have caught up with the nebula and may have changed the composition of the nebula from the inside. The amount of wind material that has run into the nebula is
| (1) |
where and are the mass loss rate and the velocity of the wind since the ejection of the nebula; and are the expansion velocity and the dynamical age of the nebula and is the inner radius of the nebula. The mean mass loss rate is not very well known for LBVs because the mass loss rate varies strongly between phases of high and low mass loss rates. Studies of mass loss in various LBV phases indicate that the mean mass loss rate of AG Car is yr-1 and that the mean wind velocity is km s-1 (Leitherer 1997). With a nebular expansion velocity of 70 km s-1 and a dynamical age of years (Table 3) we find that . A similar estimate for R 127 with yr-1, km s-1, km s-1 and years gives . These values are upper limits if the stars have not been LBVs immediately since the ejection of the nebula. For instance, if the nebula was ejected during the RSG phase and the star evolved to an LBV since then, the average wind velocity (and possibly also the average mass loss rate) will have been lower.
García-Segura et al. (1996b) have calculated the evolution of a nebula that was ejected during the RSG phase by a star with and interacted with the wind produced in the subsequent Wolf-Rayet (WR) phase. In their model the evolution from RSG to WR star is very short and lasts only about 100 years. This evolution does not allow the presence of an LBV phase about years after the nebula ejection, so it is not applicable to our program stars.
We conclude that the initially ejected nebula may have mixed with wind material after the ejection. If this material had the same composition as the nebula, no enrichment has occurred. On the other hand, if the wind material had a composition different from that of the ejected nebula, the presently observed chemical abundance of the nebula is a mixture of the two components. We will later present evidence (Sect. 7) that an enrichment of the surface layers may indeed have occured after the nebula was ejected. This may have resulted in a slight enrichment of the nebula after its ejection.
4 The expected nebular abundances due to CNO-enrichment
The abundance ratios of N/O and N/S, derived from observations of LBV nebulae and given in Table 3, can be used to derive the evolutionary stage of the star when the nebula was ejected. The N/O ratio in LBV nebulae is about 1 to 6 whereas we only have an upper limit for the N/S ratio of 30 to 80, except for the P Cygni nebula (Table 3). These ratios will be compared with predictions from evolutionary calculations for stars with convective and rotation induced mixing. Although we have no He/H ratio determination for the nebulae, we will also study the changes in the He/H ratio in the stars during their evolution. This is of interest because the data in Table 3 show that the photospheres of LBVs are remarkably helium-rich, and have a narrow number ratio of He/H to 0.7 or a helium mass fraction of to 0.73.
Evolutionary models of massive stars and the resulting variations in the surface abundances have been calculated by several groups, e.g. Maeder & Meynet (1989), Langer (1991), Schaller et al. (1992). We will use the evolutionary calculations by Meynet et al. (1994) and Schaerer et al. (1996). The evolution is strongly affected by mass loss and since different authors used different expressions for the mass loss rates, their evolutionary tracks can differ greatly. For instance, whether a massive star will go through a red supergiant phase or not depends on the amount of mass lost during the main sequence and the blue supergiant phase.
In the next sections we describe the expected abundance changes in the interiors of massive stars from a very basic point of view. The purpose of this description is to point out where the layers with the observed abundance ratio N/O to 6 are located in the star, and at what point in the evolution they may have been ejected to form the LBV nebulae. We also determine the location of the layers where He/H because they appear at the surface of the star after the nebula was ejected. We will concentrate our efforts on stars with initial masses in the range of 85 to 40 , i.e. roughly the range of the LBVs. However, since rotating 20 models potentially can evolve to luminosities of more than (Heger et al. 1997), we will also study the evolution of a star with an initial mass of 20 . For the prediction of the changing surface abundances we need to know the chemical evolution inside the star and the size of the convective core. For this we adopted the evolutionary calculations of the Geneva group (Meynet et al. 1994, Schaerer et al. 1996). These authors calculated evolutionary tracks for two different sets of mass loss rates on the main sequence: the “normal” rates (de Jager et al. 1988) and the same rates enhanced by a factor 2. Meynet et al. (1994) argued that the tracks with the higher mass loss rates agree better with the observations. Therefore we adopt the internal structure of the evolution models of Meynet et al. (1994) with the enhanced mass loss rates.
The initial abundances in terms of mass fractions in the Z=0.02 (Galactic) models of Meynet et al. (1994) for C, N and O are which are essentially solar. This corresponds to number ratios of
| (2) |
For lower metallicity models of Z=0.008 Meynet et al. (1994) scaled the absolute abundances, but kept the same relative ratios.
It is well known that H II region abundances are lower than solar values. The average H II region abundances of Shaver et al. (1983) give the following number ratios:
| (3) |
The nebular N/O ratio is a factor 0.52 smaller than assumed in the evolutionary models. This difference is even worse for the LMC (Z=0.008) since the H II region analyses of Dufour (1984) and Russell & Dopita (1990) give number ratios of
| (4) |
So the N/O ratio of the H II regions in the LMC is a factor 0.31 smaller than adopted in the evolutionary calculations for the LMC stars with . Although the question of the correct initial abundances is still controversial since B-stars sometimes give different results to the H II region analyses (Killian 1992, Rolleston et al. 1996, Venn 1999) we believe it is more correct to adopt the H II region abundances as the initial abundances of the stars. Therefore we adopt the relative initial abundances of Eq. (3) for Galactic stars and Eq. (4) for the LMC stars. We re-normalised the initial stellar abundances of the evolutionary models of Meynet et al. (1994) that we will discuss in the following sections. Obviously, this scaling only applies to the initial abundances; the abundances of the CN or ON-cycle products are not sensitive to the initial abundance ratios, except when these cycles have not yet reached equilibrium.
The abundance ratios of the gas enriched by the CNO-cycle in equilibrium in a 60 star are
| (5) |
These ratios are not affected by the change in the adopted initial composition described above. Using the abundance ratios of Eq. (5), it is easy to show that for a mixture consisting of a mass fraction of initial composition and a mass fraction of the CNO-equilibrium material we find that to 0.8 for the observed ratio of 1 N/O 5 in the LBV nebulae. This admittedly rough estimate shows that a significant fraction of the gas in the LBV nebulae must have gone through CN or CNO processing.
We conclude that the abundances in LBV nebulae can only be explained if the ejected material was a mixture of original gas and CN or CNO-processed gas. This conclusion was already reached by Smith et al. (1998), based on the N/H and O/H ratios. The mixing must have occurred in the star before the nebula was ejected. In the next two sections we will consider two mechanisms for the mixing: convective mixing and rotation induced mixing.
5 The surface abundances during the red supergiant phase
In this section we discuss the effect of convective mixing in the stellar core during the main sequence phase and of convective envelope mixing during the red supergiant phase. We calculate the expected surface abundance of H, He, C, N and O in the red supergiant phase for different mass loss rates in the main sequence phase.
5.1 The global picture
The internal structure of a massive star during the main sequence phase
and at the start of the core He-burning is sketched in the
Kippenhahn-diagram of Figure 1. The left panel
shows the internal structure as a function of time (horizontal axis)
and mass fraction compared to the initial mass (vertical axis).
During the main sequence it consists
of the following layers, from the inside to the outside:
(a) a core where H is converted into He by the CN-cycle and the ON-cycle.
(b) a convective core that extends beyond the H-burning zone. This
includes the overshooting region. The mass of the convective core
decreases with time.
(c) possibly a thin layer where the overshooting has been less effective
and where the chemical mixing with the lower layers is incomplete.
(It is unlikely that the ejected LBV nebula comes from this thin
region of possibly incomplete overshooting. Firstly, this layer will be thin
as it is expected to extend over a small fraction of a pressure
scale height during the early main sequence phase. Secondly,
the ejection of exactly this layer in all LBV nebulae would require a strict
fine tuning of the mass loss rate, because the star must have lost
just enough mass during the previous phases to get rid of the
original layer, but leave the mixed layer unaffected until it is
blown out to form the nebula.)
(d) the envelope in radiative equilibrium.
The upper part of the envelope
has the original composition. The lower layers of
the envelope have a variable composition due to mixing by
the receding convective core. Mass loss removes part of the top layer.
The CN-cycle in the core reaches equilibrium very quickly, within a few years, and so the initial N/C ratio of 0.13 will be increased to about 30 throughout the layers of the initial convective core. The ON-cycle reaches equilibrium more slowly, typically in a few years, so the O-abundance slowly decreases during the main sequence phase and the N/O ratio slowly increases. Since the convective core is shrinking in mass, the N/O ratio at the end of the main sequence phase will increase with depth in the layers between the extent of the initial and the late convective core.
The right panel of Figure 1 schematically shows the chemical composition of N throughout the star before the envelope convection sets in (left) and during the red supergiant phase when the convection has set in (right). The amount of mass of the original layer at the time when the outer convection starts depends critically on the mass loss during the earlier phases. During the RSG phase N is destroyed in the core by the He-burning. Above it is a region with CN-equilibrium material. The outer convection layers consist of mixed gas. The composition of this layer will critically depend on the ratio between the mass of the original layer and the mass of the CN-layer that is reached by the outer convection. We will calculate this composition below.
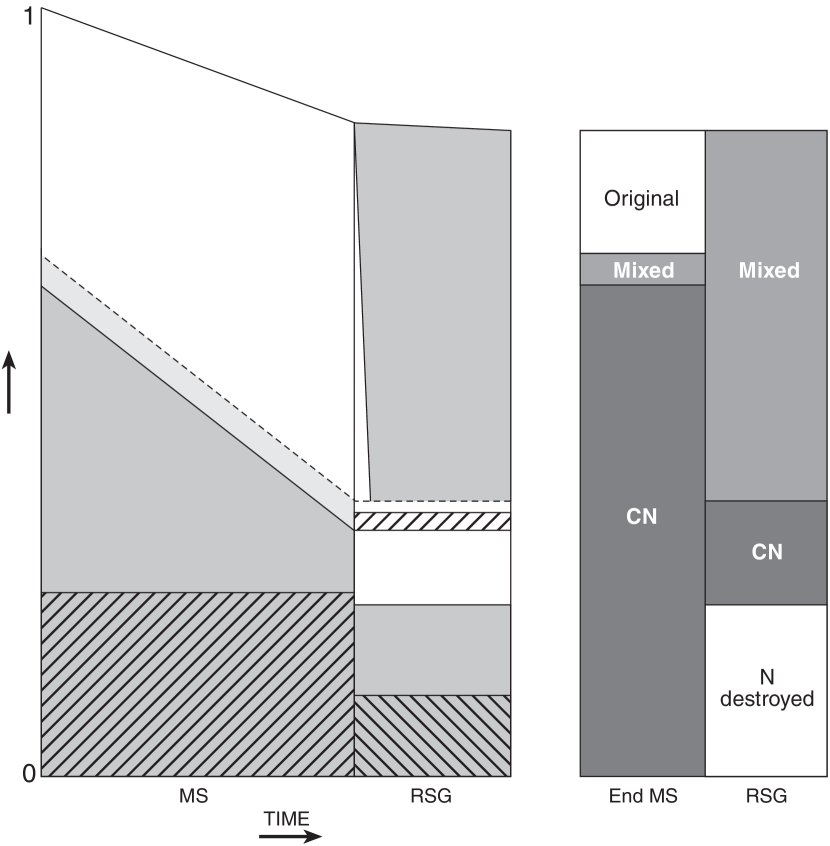
Right panel: the chemical composition of N at the end of the main sequence and after the onset of the convection in the outer envelope. Dark grey areas have CN-equilibrium composition, light grey areas have a mixed composition (adapted from Maeder & Meynet, 1987)
5.2 The internal abundance prior to the red supergiant phase
The abundance pattern of C, N and O in the star just prior to the red supergiant phase is shown in Figure 2 for models with Z=0.02 (Galactic) and Z=0.008 (LMC) for stars of initial masses of 85, 60, 40 and 20 . The abundance structure was derived from the evolutionary models of Meynet et al. (1994) for enhanced mass loss rates, but corrected for the initial CNO abundances from the H II regions. The figure shows the enhancements or depletions of CNO in the star as a function of the fraction of the initial mass. The models show that the N abundance reaches it CN-equilibrium value nearly throughout the whole region of the initial convective core. The C abundance shows a steep drop at the edge of the initial convective core, but then slowly rises by about a factor 2 to the inside. This is because the ON cycle slowly decreases the O abundance and increases the C abundance as the convective core shrinks in mass. In comparing the abundance distributions of the two metallicities, we see that the abundance patterns are very similar. The main difference is in the abundances of O, which has a steeper profile in low metallicity stars, because the ON-cycle more quickly reaches equilibrium in the stars with Z=0.008 than with Z=0.02. For stars of lower metallicity the C, N and O nuclei have to go through the CNO nuclear cycle more frequently than for higher metallicity in order to reach the same conversion rate of H into He. We will use these chemical profiles to calculate the composition of the envelope after the convective mixing has set in.


We remind the reader that the internal chemical evolution of the stars during the pre-RSG phase is very little affected by the mass loss. The main effect of the mass loss on the internal evolution is through the luminosity: a star with a higher mass loss rate will more slowly increase its luminosity during the main sequence phase than a star with a low mass loss rate, so the main sequence phase of the star with the higher mass loss rate will last longer.
5.3 The envelope abundance after convective mixing in the RSG phase
A considerable fraction of the stellar mass may have been lost before the star reaches the onset of the convective mixing. This depends on the mass loss rate during the earlier phases and hence on the metallicity. Let us assume that a certain fraction of the initial mass, , was lost before the onset of the convection. Because the mass loss prior to the red supergiant phase is not well known (in the evolutionary calculations a very high mass loss rate in the blue supergiant phase is assumed almost arbitrarily to prevent the most massive stars from evolving over to the RSG phase!), we will treat as a free parameter. Let us express the amount of mass in the core that is not reached by the envelope convection as . We set this value to the mass of the convective core at the end of the core H-burning phase, plus the few solar masses of the shell H-burning. From the evolutionary models we find that this shell-burning mass is approximately 0.05 of the initial mass. We adopt this value.
Having specified the chemical profile (Fig. 2), the mass of the star at the onset of the envelope convection, , and the mass of the core that does not mix, , we can calculate the abundance of the mixed envelope. Figure 3 shows the predicted abundance pattern of the convective envelope as a function of the remaining mass of the star at the onset of the red supergiant phase, i.e. . For , that is for no mass loss (=0), the mass of the layer with the original composition has its maximum value. This gives the minimum abundance changes in the red supergiant phase. When is so large that there is no layer of original composition left at the onset of the envelope convection, the abundances converge to the CN equilibrium values, except for the fact that the NO cycle may not have reached equilibrium. Notice the very steep dependence of the N/O ratio on the amount of mass that is lost during the main sequence phase, especially in the region where N/O to 30.
Figure 3 shows that the N/O ratio rises more steeply for the Z=0.008 models than for the Z=0.02 models. This is due to the steeper initial decrease of the O-abundance during the early MS-phase when the convective core has its maximum extent. Therefore the O-abundance is lower in the Z=0.008 models than in the Z=0.02 models over a larger fraction of the stellar mass (see Figure 2). For a given initial mass the N/O ratio rapidly increases with decreasing mass of the star at the onset of the RSG phase, i.e. with increasing mass loss. For Z=0.02 the mass loss rates adopted in the evolutionary calculations of Meynet et al. (1994) leave 38 % of the initial mass for , 65 % for 60 and 80 % for 40 . From the figure we read that this would predict an N/O ratio during the RSG phase of log N/O=1.75, 1.35 and 0.35 for 85, 60 and 40 respectively. If the mass loss rate prior to the RSG phase were higher, then the ratios would by higher. For Z=0.008 the evolutionary models predict a mass at the end of the main sequence of 68 % for , 76 % for and 89 % for . The correspondingly predicted N/O ratio after convective envelope mixing is log N/O = 1.75, 1.00 and 0.20 respectively.


We want to point out that the surface abundances predicted in the Geneva models (e.g. Meynet et al. 1994) during the RSG phase are closer to the initial abundance than in our calculations. This is due to the fact that the convection is artificially reduced in the Geneva models of the red supergiants, in order to avoid a large density inversion that causes numerical problems. This reduction of the convection produces in the Geneva tracks red supergiant models which have too high effective temperatures: the convection in the models does not reach deep enough, so the convective mixing is reduced, the envelope is not extended enough and the radius is not large enough to make cool red supergiants (Maeder, Private Communications).
5.4 Comparison with the observations
We compare the observed nebular abundances with those expected from stars in the RSG phase as shown in Figure 3. If we assume that the nebula was ejected during the RSG phase, we can derive the total amount of mass that was lost from the star before the onset of the outer convection. The results are summarized in Table 2. The stars and their initial mass are listed in Columns 1 and 2. Column 3 gives the observed abundance ratio that was used to derive the mass of the star when it entered the RSG phase, . This mass is compared to the initial mass in Column 4. Column 5 gives the mass of the star that was lost prior to the RSG phase, derived from the observed abundance ratio and column 6 gives the mass lost on the main sequence adopted in the evolutionary calculations by Meynet et al. (1994). Column 7 gives the nebular He/H ratio that is predicted on the basis of the observed N/O or N/S ratio, using the results in Figure 3. The last column gives the observed photospheric He/H ratio.
-
•
AG Car: The luminosity of this star suggests an initial mass of about 60 if the star is presently in the post-RSG phase. From Fig. 3 we see that the observed ratio N/O can be explained by convective mixing if i.e. the star has lost 22 percent of its mass, corresponding to 13.0 1.8 , prior to the onset of the convection. The evolutionary calculations by Meynet et al. (1994) for enhanced mass loss predict that the star has lost about 35 percent of its mass at the end of the H core burning phase, and 20 percent for normal mass loss (see Sect. 4). The empirically derived value is close to the predicted value for normal mass loss rates. We see that the nebular N/O ratio can be explained if the nebula was ejected during the RSG phase and the star had lost 11 to 15 prior to this phase. The surface He/H ratio for a star of that has lost 13 before the onset of the RSG phase is He/H. The observed surface ratio of 0.4 for the star AG Car is slightly higher than this. This might indicate that the star has lost more mass since the nebula was ejected, bringing more enriched layers to the surface in the blue supergiant phase.
-
•
P Cygni: If P Cygni is in the post-RSG phase its initial mass must have been about 50 . Therefore we interpolated the predicted N/S and the N/H ratio for the two models of 40 and 60 . Unfortunately we only have an observed lower limit to the N/O ratio (Table 1). This lower limit does not set a useful constraint on the mass of the RSG. Therefore we use the N/S ratio, which is however a less senstive indicator of the fraction of mass that is lost than the N/O ratio. Moreover, the derived N/S ratio is uncertain (see Sect. 2). The observed ratio of N/S corresponds to for , and for . This suggests that if the nebula was ejected during the RSG phase, the star of initially 50 must have lost about 7 percent of its mass prior to this phase. The observed N/S ratio corresponds to a predicted He/H ratio of 0.22, which is much smaller than the photospheric ratio of He/H=0.42. The evolution calculations with enhanced mass loss of Meynet et al. (1994) show that a star of 50 is expected to lose about 30 percent of its mass during the core H-burning. This is significantly higher than the (uncertain) value of 7 % that we derived from the N/S ratio. For a mass loss of 30 percent we predict an N/S ratio of 50, which may still be within the uncertainty of the derived abundances.
-
•
R 127: From the location of this star in the HR-diagram we find that the initial mass must have been about 75 if the star is now in the post-RSG phase. Comparison with the results in Fig 3 for the Z=0.008 models shows that the observed abundance ratio of N/O = 0.9 is smaller than the predicted one, even if the star had not lost any mass at all prior to the onset of the envelope convection! The predicted He/H ratio for is 0.2, which is much smaller than the present photospheric ratio of 0.50. The evolutionary tracks with enhanced mass loss of Meynet et al. (1994) predict that the star has lost 25 percent of its mass during the core H-burning and that the N/O ratio should be larger than 100, which is much higher than observed. Assuming that the mass loss rate of R 127 has been about 0.4 times that of its Galactic counterpart AG Car, because the mass loss rate is proportional to metallicity as (Vink et al. 2000), we would expect a , which corresponds to N/O . This is twice as high as the observed maximum ratio of 1.3. This result depends sensitively on the adopted initial mass of the star. If the luminosity was 6.0 dex instead of 6.1 (which is within the accuracy of the luminosity determination), the initial mass would be 60 and the predicted N/O ratio would be 1.5, which is only marginally higher than the upper limit of the observed ratio.
-
•
S 119: The initial mass, estimated from the stellar parameters, is if the star in presently in a post-RSG phase. Comparison of the observed nebular ratio of N/O with the results in Fig 3 for 60 shows that the star must have lost 7 percent of its mass if N/O=1.9 and 12 percent if N/O=2.4 before the envelope convection started. The lower limit of the observed ratio of N/O=1.4 is not compatible with the predictions. The predicted He/H ratio for 7 to 12 % mass loss is about 0.20. This is much smaller than the present photospheric He/H ratio of 0.67. The evolutionary models of an LMC 60 star of by Meynet et al. (1994) show that the star has lost about 25 percent of its mass prior to the RSG phase. However, if that were the case the N/O ratio of the nebula should have been about 10, which is clearly incompatible with the observed value.
We conclude that the N/O abundance ratio in the nebula is a very sensitive indicator of the mass that was lost prior to the onset of the envelope convection, if the nebula was ejected during the RSG phase. The observed ratio of AG Car is in agreement with the evolutionary predictions for the mass that the star has lost at the end of the main sequence phase if the “normal” mass loss rates of de Jager et al. (1988) are adopted. For the P Cygni nebula we used the observed uncertain N/S ratio because for the N/O ratio only a lower limit is known. The uncertain N/S ratio is about 40 percent smaller than the value predicted by stellar evolution. For the LMC stars the N/O ratios point to a mass loss rate that is smaller than adopted in the evolutionary tracks by Meynet et al. (1994) if the nebulae were indeed ejected during the RSG phase.
For all stars we find that the predicted He/H ratio, that is associated with the observed N/O or N/S ratio is smaller than the observed photospheric He/H ratio. The difference is small for AG Car, but it is significant for P Cygni and R 127. Taken at face value, this shows that a significant enrichment of the surface layers must have occured after the LBV nebula was ejected. We return to this in Sect. 7.
We remind the reader that in these calculations we have adopted a considerably deeper mixing during the RSG phase than in the evolutionary calculations of the Geneva group. In the Geneva models the deep convection is trimmed to avoid numerical instabilities in the code, which results in less severe mixing than in our simplified models.
6 The surface abundances of stars with rotation induced mixing
In this section we consider the effects of rotation induced mixing on the chemical evolution of the star. Evidence for envelope mixing during the main sequence phase comes from the existence of OB supergiants with enhanced N abundance (Walborn, 1988), and also from the boron depletion in their photospheres (cf. Fliegner et al. 1996). This indicates that in these stars the products of the nuclear fusion already have reached the stellar surface at or near the end of the main sequence phase. This is not surprising. Firstly, the mean rotation velocity of the main sequence O-stars is high and of order several hundred km s-1. Secondly, the grid of stellar evolution models for stars in the mass range 10 to 25 of Heger et al. (2000) shows that the rotational mixing is more efficient for higher initial masses, as radiation pressure becomes more dominant and renders the influence of mean molecular weight barriers less important (see also Maeder 1998).
Therefore we study the effect of mixing on the surface abundance at the end of the main sequence phase. We will calculate the surface abundances as a function of the ratio between the mixing timescale , and the timescale for core H-burning, . Before presenting the calculations we discuss the mixing timescale that might be expected for rotation.
6.1 The time scale for rotation induced mixing
Rapidly rotating stars will develop an Eddington-Sweet circulation due to thermal imbalance (e.g. Kippenhahn & Weigert, 1990, p 439). This circulation will bring nuclear products from the convective core into the non-convective envelope, where they may appear at the surface of the star. In differentially rotating stars, among other processes, the shear instability can produce turbulence which can also result in chemical mixing (Maeder 1998). Assuming that mean molecular weight barriers have only a limited efficiency in preventing the mixing (Maeder & Zahn 1998, Heger, Langer & Woosley 2000), the timescale for the Eddington-Sweet circulation, which dominates the mixing time scale for massive main sequence stars, is related to the Kelvin Helmholtz timescale (Kippenhahn & Weigert, 1990, p 439),
| (6) |
where is typically about times the main sequence lifetime, and
| (7) |
where and are the centrifugal acceleration and the acceleration of gravity at the equator and is the angular velocity (Kippenhahn & Weigert, 1990). These two expressions are for a solidly rotating star, which is a good approximation for the considered case. While recent, more sophisticated models of rotating massive main sequence stars show that the rotational mixing is really determined by an interplay of Eddington-Sweet currents, shear mixing, and baroclinic turbulence (Heger et al. 2000, Meynet & Maeder 2000), they confirm the basic trends predicted by Eq. (6). We see that and that the circulation time is on the order of the Kelvin-Helmholtz time for stars near critical rotation speed and increases rapidly for slower rotation.
The main sequence lifetime, the mass and radius during the ZAMS phase of stars with , derived from the evolutionary calculations for Z=0.02 by Meynet et al. (1994) depend on the initial mass approximately as
| (8) |
where is in years and all stellar quantities are in solar units. For the luminosity is about 10 % lower, the main sequence lifetime is about 10 % larger, and the radius is about 10 % smaller. Combining Eqs. (6), (7) and (6.1) we find an expression for the ratio between the circulation time and the MS lifetime for stars with of
| (9) |
for , where the rotational period is in days. For the ratio is about
| (10) |
The dependence of on is slightly flatter for than for . In deriving these expressions we have used the luminosity and the radius of the ZAMS and we have adopted solid rotation. These are only rough approximations but they serve to give an indication of the possibility that rotation induced mixing may occur in massive stars. From these estimates we see that the circulation time is of the order of the main sequence lifetime for rotational periods of the order of 5 days. This corresponds to equatorial velocities of about 100 km s-1 for a star with a radius of 10 . The observed distribution of of main sequence O-stars shows a bimodal distribution, with peaks near 100 and 300 km s-1 (Conti & Ebbetts 1977). This implies that the circulation times may be of the order of the main sequence lifetime. Therefore we may expect rotation induced mixing to occur.
6.2 The effect of rotation induced mixing on the CNO abundances
In this section we describe the changes in the surface composition due to mixing on a mean mixing timescale, . If the mixing time were short compared to the MS lifetime, the star would be fully mixed at the end of the H-core burning phase. In that case the CNO abundance throughout the star would be about in CNO-equilibrium, with the abundance ratios given by Eq. (5) for a star of 60 . This is obviously not the case. If the mixing time is much longer than the MS lifetime, rotation induced mixing would not be effective. The most interesting case is that of partial mixing, when is of the same order of magnitude as . By comparing the observed nebular abundances with the predictions for different values of we can empirically derive the values of for massive stars.
We calculate the changes in the composition of the envelope due to mixing by assuming that in a time interval a fraction of the total mass of the star is mixed. If is the mass fraction of an element in the convective core at time and is the mass fraction of that same element in the envelope, than the change in the mass fraction in the envelope due to mixing can be written as
| (11) |
where and are the masses of the star and of the envelope at time . This equation can be solved analytically for constant and . However, the convective core shrinks, both the stellar mass and the envelope mass change during the main sequence phase and the composition of the core may change with time. Therefore we have solved this equation numerically. Starting with the original composition of the envelope at the beginning of the main sequence phase (adopting the abundance ratios discussed in Sect. 4) and taking the variation of , and from the evolutionary calculations, we calculated the changes in the surface composition due to rotation induced mixing. In these equations we assume that the material that is freshly mixed from the envelope into the core is quickly transformed into the core composition at that time. This is a good assumption for C and N, because the CN-cycle quickly reaches equilibrium (see Figure 2) and because the timescale for convective overturning in the core is very short. But it is not a very accurate assumption for the O-abundance in the early part of the main sequence phase of the stars because the ON-cycle takes a longer time to reach equilibrium. However since we are mainly interested in the composition of the envelope at the end of the main sequence phase, we can adopt Eq. (11) as a first estimate to describe the changes in the CNO abundances of the envelope at the end of the core H-burning phase.
We note that our description of the mixing is a simplified version of the diffusion approximation and that our definition of the mixing time, defined by Eq. (11), is not the same as the definition of the diffusion time. In the diffusion approximation the mixing is described as (Kippenhahn & Weigert, 1990)
| (12) |
The diffusion coefficient is where is the length scale of the diffusion and is its timescale. Using and , we find
6.3 The effect of rotation induced mixing on the H and He abundance
Equation (11) can also be used to describe the H and He abundance in the envelope, but in this case we cannot assume that all H that is mixed from the envelope into the core will instantaneously reach the core composition because the transformation of H into He occurs on the main sequence time scale. In this case the change in the H-abundance in the stellar core is described by
| (14) |
where is the energy produced by transforming a unit mass of H into He. The first term on the right hand side describes the change due to H-burning and the second term describes the changes due to mixing. If we set , we retrieve the chemical changes in the core of the star as predicted by the stellar evolution models without mixing. The change in the H-abundance in the envelope of the star due to rotation induced mixing is described by Eq. (11). The changes in the He-abundances in the core and the envelope follows from the condition that the sum of the mass fractions of H and He is invariant to mixing and nuclear fusion during the main sequence phase: .
For calculating the variation of the surface H and He abundance for a star with rotation induced mixing we solve the Equations (11) and (14) simultaneously. We adopt the changes in luminosity and in the core mass and the envelope mass as a function of time from the evolutionary tracks of Meynet et al. (1994) with enhanced mass loss. For severe mixing, i.e. , this assumption is not justified because mixing would bring fresh H into the core which would prolong the main sequence phase. However, we will show below that the observations indicate only mild mixing, so that the evolutionary calculations without mixing can be adopted as a first approximation to estimate the abundance changes due to rotation induced mixing.
We note that our description of the mixing (Eqs. 11 and 14) implies that we predict only the “mean” values of the abundances in the envelope as a function of time which also gives the evolution of the surface abundances in the star as a function of time. In reality the diffusive rotation-induced-mixing will set up an abundance gradient in the envelope (see e.g. Heger et al. 2000). We will return to this aspect later in Sect. 7.
6.4 The surface abundances as a function of mixing-time
Using Equations (11) and (14) we have calculated the expected surface abundances of massive stars with rotation induced mixing. The mixing time is expressed in terms of the main sequence lifetime , with between 0.5 and 5. Figure 4 shows the envelope abundance at the end of the main sequence phase, for four initial masses. We see that the N/O, N/C, N/S and He/H ratios increase as the mixing time decreases. Even for a mixing time as long as 5 the N/O ratio of about unity is already significantly higher than the initial value of N/O=1/13. This is because the N/O ratio in the core is a factor 700 higher than the initial value. For such a large difference between the initial abundance and the core abundance, the surface N/O ratio is already increased by a factor 3 at a time as small as if and the O abundance was in ON-equilibrium. Figure 4 also shows that for strong mixing with the surface abundances at the end of the main sequence phase approach the abundances in the core, as expected.


The N/O ratio in the envelope is smaller for stars with smaller initial masses than for high initial mass, especially for large values of . This is because the mass loss rate in the higher mass stars is larger and hence the ratio between the mass of the envelope and the mass of the core is smaller for high mass stars. With a smaller envelope mass, less mixing is required to increase the envelope abundance. Comparing the results of the with we find that the envelope abundances due to mixing are very similar. The main difference is for fast mixing which gives a higher value of N/O in the models than in the models. This is because the O abundance has a steeper profile with less O in the core of the LMC models than in the core of the Galactic models because of the ON-cycle reaches equilibrium composition faster for than for (see Figure 2).
Heger & Langer (2000) predict the changes in the surface abundances of rotating stars of 8 to 25 using detailed stellar evolution models. Their 20 model with an initial rotation velocity of 300 km s-1 evolves to and , which compares well with our results for a star of 20 and to 3 . Meynet (1998) presented models for rotating stars of =20 and 40 and finds ratios of for 20 and 1.3 for 40 for a similar rotational velocity. This compares, again, well with our results for to 3 . We conclude that our simplified prescription does yield results which are comparable with those of more sophisticated calculations, and that we can use our predictions for comparison with the observations.
6.5 Comparison with the observations
If the LBV nebulae are ejected at the end of the main sequence phase, but before the RSG phase, the abundance of the nebula can be used to derive the timescale of the rotation induced mixing. The results are summarized in Table 3.
-
•
AG Car: If AG Car is in the post main sequence phase, its initial mass derived from the location in the HR diagram is . (This mass estimate is higher than the value of used in Sect. 5.4 in case the star has been a red supergiant, because the luminosity of the star has increased during the RSG phase. This results in a lower estimate of the initial mass for a given post-RSG luminosity compared to that for a given post-MS luminosity.) Interpolating between the results for and in Figure 4 we see that the observed ratio N/O= requires a ratio of . Since the main sequence life time of a star of 70 is years (Eq. 6.1), this implies a mean mixing time of years. For this mixing time the predicted N/S abundance is N/S = 60 and He/H = 0.33 for the nebula. The observations show that N/S , which is slightly smaller than the predicted value.
-
•
P Cygni: The stellar parameters of P Cygni indicate an initial mass of about 50 , if the star is in the post main sequence phase. The N/S ratio of its nebula, derived from interpolation between the models of 60 and 40 , indicates a mixing time of , i.e years. For this mixing time, the expected He/H ratio of the nebula is 0.18. This is much smaller than the observed photospheric He/H ratio. We return to this in Sect. 7.
-
•
R 127: If R 127 is a post main sequence star, its initial mass must have been 75 . From the interpolation between the calculations of 60 and 85 in Fig. 4 we find that the abundance ratio N/O = requires a mixing time yrs. For such a mixing the predicted ratio N/S is , which agrees with the observed upper limit for the nebula of . The predicted He/H ratio is 0.16, which is much smaller than the photospheric ratio.
-
•
S 119: The initial mass of S 119 derived from its location in the HR diagram, under the assumption that it is a post main sequence star, is about 65 . From Figure 4 we see that the observed ratio N/O= requires a mixing time of about yrs. For such a mixing time the predicted N/S ratio is which agrees with the observed upper limit of . The predicted He/H ratio of the nebula is 0.18, which is much smaller than the photospheric ratio.
We conclude that if the LBV nebula is ejected at the end of the main sequence phase, mixing from the core into the envelope must have occurred during the main sequence phase. Using a simple mixing time description, we find that the observed N/O ratio in AG Car, R 127 and S 119 and the N/S ratio of P Cygni requires a mixing on timescales of 1.8 to 4 times the main sequence time, i.e. about yrs for AG Car and 1.0 to 1.5 years for P Cygni, R 127 and S 119. We see that such relatively long mixing times can still significantly alter the N/O and N/S ratios at the stellar surface, because only a little mixing is necessary to change these ratios. The fact that we find a range of two in the mixing time of stars in such a small mass range is not surprising, as the mixing depends not only on the initial composition and the evolution but also on the initial rotation velocities. These might differ from star to star.
We can estimate the rotation velocity during the zero age main sequence phase that is needed to explain the derived mixing timescale. The result is listed in Table 3 where we have used Eqs. (9) and (10) and the ratio . We see that the required equatorial rotation velocities are in the range of 70 to 100 km s-1. These values are not particularly high for massive main sequence stars. Conti & Ebbets (1977) found that the distribution in sin of main sequence O-stars has a bimodal distribution with peaks at 100 and 300 km s-1. So it is possible that the enhanced N/O ratios observed in LBV nebulae already appear at the surface of the stars near the end of the main sequence phase due to rotational mixing. In fact the presence of the ON-supergiants is a clear indication of this process (Walborn, 1988; K.C. Smith et al. 1998), as well as the existence of N enriched main sequence stars in the LMC (Korn et al. 2000). Unfortunately no detailed quantitative studies of the C, N and O abundances of the ON stars has been done yet, to see if the abundances are the same as in LBV nebulae.
7 When were the LBV-nebula ejected?
We have shown above that the abundances of the LBV nebulae, in particular the N/O ratio can be explained by ejection in either the RSG phase, when mixing in the convective envelope has occurred, or at the end of the main sequence phase, hereafter referred to as the blue supergiant (BSG) phase, if rotation induced mixing occurred during the main sequence phase. In this section we compare the results derived above for the two explanations with the constraints of the dynamical age of the nebula and the present photospheric He/H ratio (see Tables 1, 2 and 3). These constraints are:
-
1.
The dynamical ages of the LBV nebulae are between 1 and 7 times years, apart from the P Cygni nebula which is much younger.
-
2.
The LBV nebulae contain between about 2 and 8 solar masses of mildly enriched ionized gas, except for P Cygni which has a much smaller nebular mass. The amount of molecular or neutral material in LBV nebulae is not well known. A recent study of the CO emission from the AG Car nebula (Nota et al. 2000b) shows that the nebula contains about in the form of CO. The fraction of CO is estimated to be of the total molecular gas, which then amounts to 2.6 . This is about as much as the 4.2 of ionized gas in the AG Car nebulae. So the total amount of mass in LBV nebulae might be as high as twice the mass of the ionized gas.
-
3.
The photosphere of the LBVs is more chemically enriched than the nebula. The N/O ratio in the nebulae suggest a He/H ratio of about 0.3 for the nebula of AG Car and about 0.2 for the nebulae around P Cygni, R 127 and S 119 (Sections 5.4 and 6.5). However, the photospheric He/H ratios are between 0.4 and 0.7.
-
4.
The outflow velocities of the LBV nebulae are 70 km s-1 for AG Car and 140 km s-1 for P Cyg. The outflow velocities of the LMC stars R 127 and S 119 are 25 and 29 km s-1 respectively.
-
5.
No red supergiants with luminosities above have been found in the Galaxy or in the LMC (Humphreys & Davidson 1979). This implies that either more luminous stars do not pass through a RSG phase or that their RSG phase lasts only a very short time, i.e. less than about a few years.
7.1 The ejection of the nebula at the beginning of the RSG phase?
Let us suppose that the nebula was ejected during the RSG phase. From the nebular abundance we found that AG Car must have lost about 25 % of its initial mass prior to the onset of the envelope convection. The convection then created a layer of about 15 of mildly enriched material above the non-convective core. If the observed 7 of the nebula (ionized plus molecular gas) was ejected near the beginning of the RSG phase, i.e. before significant RSG mass loss has occurred, the star would still have an envelope of about 8 of mildly enhanced material after the ejection. This is at odds with the fact that about years after the nebula was ejected the He/H ratio at the surface of the star has already increased significantly to the observed value of He/H 0.42. It would require an unrealistically high mass loss rate of about yr-1 after the ejection of the nebula. The problem is even more severe for the LMC stars which have lost a smaller fraction of their initial mass before the envelope convection starts. They will have a much more massive layer with mildly enriched material and a predicted He/H ratio of only about 0.20. In order for these stars to reach a ratio He/H 0.4 at the surface requires the ejection of even more mass than from the Galactic LBVs within the short dynamical age of their nebula.
7.2 The ejection of the nebula at the end of the RSG phase?
If the nebula was ejected near the end of the RSG phase, when the star had already lost about 10 as a RSG, the increase in surface abundance to the presently observed He/H ratio of about 0.4 within the dynamical age of the nebula can be explained because soon afterwards the deeper more enriched layers may have been exposed. Adopting a “normal” RSG mass loss rate of about yr-1, the star may have lost its last solar mass of mildly enriched material in the dynamical time of the nebula.
The question is then, where is the mass that must have been ejected in the RSG phase before the nebula was ejected? For example, AG Car had about 15 of convectively mixed material in the early-RSG phase, about 7 of which are in the nebula ( 4 ionized and 3 molecular). The other 8 must have been lost before the nebula ejection. With a typical RSG wind velocity of 10 km s-1 that material should have reached a distance of about a few tenth of a parsec, and it would have been overtaken by the nebula that was ejected with a velocity of about 70 km s-1 for AG Car. So in that case we would have expected the visible nebula to contain practically all the gas that was lost during the RSG phase, i.e. about 15 . This is not observed. Moreover, in that case we cannot explain the lack of luminous RSG, because they must have lived about years to eject the initial 10 layer of the mixed material (unless the mass loss rate was very high during that phase).
7.3 The ejection of the nebula in the BSG phase ?
Let us now suppose that the nebula was ejected in the BSG phase, and that rotation induced mixing has affected the abundances as predicted in our calculations. (These abundances are confirmed for stars in the mass range 15 of 25 by the detailed evolutionary models for rotating stars by Heger (1998, p 81) and Heger et al. (2000).) In this case, the N/O and N/S ratios can all be satisfactorily explained, although this requires differences in the adopted mixing time scales in the stars by about a factor of two.
The increase of the CNO-enrichment from
the mild enhancement in the nebula, which indicates He/H 0.2,
to the present day photospheric
He/H ratio of about 0.4 to 0.7 can also be explained in the framework of
the rotating stellar models by two effects which will both be
operating:
(1) Rotation induced mixing will continue after the ejection of the nebula
in the BSG phase and the He/H ratio will keep increasing with time.
In fact, the mixing is likely to become faster when the star
moves away from the main sequence, because it may approach its
limit for near-critical rotation in the layers where the
radiation pressure is high (Langer 1998; Langer et al. 1999).
For near-critical rotation
the mixing-time approaches the Kelvin-Helmholtz time, which is about
years for a star with an initial mass of 60 . This means that
within about years after the ejection of the nebula the
composition may have changed drastically.
(2) Rotation-induced-mixing is a diffusive process that will result
in an abundance gradient in the envelope, with the most enriched
matter closer to the core (see Sect. 6.3). The ejection of the
outer layers will therefore automatically reveal photospheric layers
which are more enriched than the ejected gas.
In this respect the star P Cygni is an interesting test case. The nebula was ejected only 2000 years ago. We do not know the He/H ratio in the nebula, but the N/S ratio implies that the He/H ratio in the nebula must be about 0.2, whereas the He/H in the photosphere is 0.4. 222Unfortunately, the abundance determination of the P Cygni nebula is less well known than that of the other program stars. A more accurate determination of the abundance and of the total amount of ionized plus neutral gas would be highly desirable. Such a difference implies that there must have been an abundance gradient near the outer layers of the star. An abundance gradient is expected for rotation induced mixing by diffusion but not for mixing by convection in the RSG phase. Our simplified method of predicting the rotation-induced-mixing does not allow us to calculate the abundance gradients. Heger et al. (2000) have calculated the evolution of rotating stars in the mass range of 10 to 25 with diffusive mixing. Although these models have lower masses than P Cygni, they indicate that abundance gradients of the required order may well be present in rotating massive blue supergiants.
Additional evidence for a prominent role of rotation in the ejection of the nebula comes from the observed bipolar structure of several LBV nebulae (Nota, 1997) and the linear polarization of the UV and optical radiation of AG Car and R 127 (Schulte-Ladbeck et al. 1994).
A more indirect argument for the ejection of the LBV nebulae in the blue supergiant phase may come from the expansion velocities of the nebulae. The expansion velocity of the Galactic nebulae of AG Car and P Cygni are 70 and 140 km s-1 respectively. The wind speeds of luminous red supergiants are smaller and on the order of 10 to 20 km s-1 (Reimers 1975, Dupree & Reimers, 1987). Although the ejection of the nebulae may have been due to a process other than the normal RSG wind, it is unlikely that this process could have lead to an ejection velocity much higher than that of the wind. In general, an increase in the mass loss rate by some subphotospheric mechanism results in a decrease of the velocity (unless a large amount of extra energy is generated as in Nova outbursts). On the other hand, the wind velocities of luminous blue supergiants with high mass loss rates such as Sco or Cyg are about 100 to 200 km s-1. An increase in the mass loss rate by a significant factor, such as during the ejection of the nebula, will result in a decrease of the wind velocity. So it is easier to explain the velocities of the nebulae of P Cyg and AG Car if they are ejected in the BSG phase than in the RSG phase. (The velocities of the nebulae of the LMC stars R 127 (29 km s-1) and S 119 (25 km s-1) are markedly smaller than those of the Galactic counter parts. In fact they are close to those expected for red supergiants. Until we understand the ejection mechanism of the LBV nebulae and its dependence on metallicity, it is difficult to explain the reason for the difference in nebular velocity between the Galactic LBVs and their counterparts in the LMC.)
8 Discussion and conclusions
In an attempt to explain the origin of the LBV nebulae, which are mildly enriched in N and depleted in O, we have studied the effects that can modify their composition. The results are summarized.
- •
-
•
We have shown that the abundance patterns of four LBV nebulae, in particular the N/O and N/S ratios, can be explained by both mechanisms:
– either, by mixing due to an outer convective envelope. In that case the LBV nebula must have been ejected during the red supergiant phase. The observed N/O and N/S ratios then provide an estimate of the amount of mass that must have been lost before the envelope convection sets in. For this scenario, we find that the mass lost is significantly smaller than adopted in the evolutionary calculations of Meynet et al. (1994).
– or, due to rotation induced mixing during the main sequence phase. In that case the LBV nebula was ejected after the main sequence in the blue supergiant phase. The N/O and N/S ratios then provide an estimate of the mixing time. The mixing times are between and years. These values are reasonable, considering the fast rotation of the main sequence O-stars. Additional evidence that rotational mixing is common in early type stars comes from the fact that a considerable fraction of the OBA supergiants and even some O main sequence stars have an enhanced N abundance (e.g. Walborn, 1988; K.C. Smith et al. 1998; Venn 1996, 1997, 1999) -
•
Both models (convective or rotation induced mixing) predict a nebular He/H ratio that is about a factor two smaller than the observed photospheric abundance of He/H 0.4 to 0.7. This enrichment of the stellar surface must have occurred after the nebula was ejected, i.e. within the dynamical timescale of the nebulae of about years. This cannot be explained in the context of the nebular ejection during the RSG phase, but it is a logical consequence of rotation induced mixing for two reasons:
(1) The mixing is expected to become faster as the star expands after the main sequence phase and approaches its limit for critical rotation in the layers where the radiation pressure is high. Depending on their Eddington-factors, for stars near critical rotation the mixing time may become as short as the Kelvin-Helmholtz time, which is of order years for a star of 60 .
(2) Contrary to convective envelope mixing, rotation-induced-mixing is a diffusive process that results in an abundance gradient in the envelope with the more enriched material closer to the core. The ejection of surface layers will automatically reveal the more enriched deeper layers. -
•
The expansion velocities of about 100 km s-1 of the LBV nebulae of AG Car, P Cyg and R 143 can be explained if the nebulae were ejected during the BSG phase but not during the RSG phase. The low expansion velocities of R 127 and S 119 might be the result of deceleration by interaction (these are the oldest nebulae of our sample) or due to the small radiative acceleration because of the low metallicity of the LMC stars.
We conclude that the abundance pattern observed in LBV nebulae and in the photospheres of their central stars may be explained with the rotation induced mixing scenario. This scenario may explain all observations consistently. In the rotation scenario the differences in the N/O ratios of the LBV nebulae are due to different mixing time scales, that are most likely due to differences in the initial rotation rates. An advantage of the mixing scenario may be that it ties in with the LBV outburst model involving the -limit (Langer et al. 1999), which appears to be able to explain the bi-polar morphology found in virtually all LBV nebulae (Nota et al. 1995). It would be interesting to investigate if the model for the outburst due to the -limit might also explain the fact that the photospheric He/H ratio of the LBVs is in a narrow range of 0.4 to 0.7. This narrow range might possibly be due to the fact that in such a model, the rotation determines both the moment of the outburst and the amount of mixing.
How do we combine the scenario that the LBV nebulae are ejected in the
BSG phase with the results of the studies of the ISO
spectra of these nebulae by Waters et al. (1997; 1998; 1999) and Voors et al.
(2000). These authors have shown that the dust in the LBV nebulae
is very similar to the dust around red supergiants, i.e.
mainly in the form of
amorphous silicates plus a minor contribution from
crystalline silicates such as olivines and pyroxenes.
Since the composition depends sensitively on the conditions during
the ejection of the material, Waters et al. (1997; 1998; 1999) have argued
that the LBV dust must have been ejected when the star was a RSG.
However, one has to be careful with applying this argument and one should
make a distinction between two possible interpretations:
(a) The star was a red supergiant in the evolutionary sense,
i.e. it had a large convective envelope during a typical evolutionary
timescale of order to years. (We have rejected this
possibility on the basis of the abundances and velocities of the
LBV nebulae)
(b) During the ejection of the nebula, by whatever mechanism,
the star was temporarily cool and large in size, resembling a
RSG. This is likely because a very high temporary mass loss rate
will produce an extended cool pseudo-photosphere because of its
large optical depth. The dust that forms outside such a photosphere
will be formed under similar conditions as in RSG winds. This
explanation agrees with the arguments that the nebula was
ejected in a temporary RSG phase.
We conclude that many arguments point to the LBV nebulae being ejected during the blue supergiant phase and that the chemical enrichment is due to rotation induced mixing.
This suggests the following evolutionary scenario for the
formation of the LBV nebulae with the observed chemical
and dynamical properties:
1. Mildly or rapidly rotating massive stars experience rotation
induced mixing during the MS phase. This enhances the He/H ratio
from the initial value of 0.1 to about 0.2 to 0.4 and the N/O ratio from
0.07 to about 1 to 5 in the envelope, depending on the
ratio between the mixing time and main sequence life time.
This explains the existence of the ON-stars.
2. After leaving the main sequence and evolving into
blue supergiants, the stars run into the -limit,
which is the critical rotation limit in a star with
a significant contribution by radiation pressure.
3. When the star reaches the -limit it ejects a large
amount of mass, on the order of one or a few solar masses. The
ejected matter has an enhanced N/O ratio, because it consists of
matter from the
envelope that was mixed during the main sequence phase.
This explains the observed abundances of LBV nebulae.
4. When the star has reached
thermal equilibrium after the ejection,
it is again located to the left of the -limit
in the HR-diagram. It will then start again to expand
and will reach the -limit. In this way
the star may suffer multiple ejections, with time intervals
on the order of a fraction of the Kelvin-Helmholtz timescale, i.e. about
to years. This may explain the relatively large number of
eruptions in Galactic LBVs (two in about 6 LBVs)
that have been observed during the last four hundred
years.
5. If the ejections of a large amount of mass are due to the
star reaching its -limit, we can expect that the mass
is ejected mainly in the equatorial plane.
(Models of moderately rotating stars show that the mass flux
from the poles is slightly larger than from the equator, e.g. Maeder (1999).
This will not be the case for a star near critical rotation. In any
case, the density of the equatorial wind will always be higher than
the density of the polar wind, because the wind velocity is very
sensitive to the local escape velocity and will therefore be lower
in the equatorial region than in the polar region,
e.g. Pelupessy et al. (1999).)
The nebula ejected at the first ejection (when the star has moved off
the main sequence) will be influenced very little
by the wind form the main sequence phase, because the
main sequence wind velocity is expected to be higher
than the velocity of the ejecta. However, the nebula
formed by the later ejecta
may be shaped by the presence of the equatorial
circumstellar matter from the previous ejection or from the
equatorially enhanced winds from the rapidly rotating star
in between the ejections. This may explain the observed bipolar structure of
most LBV nebulae.
6. During the ejection phase, the outflow is optically thick, which
results in a large effective radius and a low effective temperature
of the star that temporarily resembles a red supergiant.
This explains the similarity between
the properties of dust in LBV nebulae and in RSG winds.
7. After each ejection, the He/H ratio and the N/O ratio
of the stellar photosphere is (slightly) higher than that of the
ejected gas, because there is an abundance gradient in the
envelope due to the continued rotation induced mixing of the envelope
with the deeper layers. The mixing gets faster and the abundance
gradient gets steeper, the closer the star moves to the
-limit. This may explain why the photospheric He/H ratio
is higher in the LBV photospheres than in their nebulae.
8. The ejections stop when the star has lost most of its
H-rich envelope. The star then contracts to become a Wolf-Rayet
star with a He-rich envelope.
9 Acknowledgement
H.J.G.L.M.L., L.J.S. and N.L. are grateful to the Space Telescope Science Institute for financial support and hospitality. We thank Robert Voors and Rens Waters for enlightening discussions on the dust properties of LBV nebulae, and Nolan Walborn for discussions about chemically enriched ON stars. We thank George Meynet for critical comments and suggestions on an earlier version of this paper. This work has been supported by the Deutsche Forschungsgemeinschaft through grants La 587/15-1 and 16-1 to N.L.
References
- (1) Barlow, M.J, Drew, J.E., Meaburn,J. & Massey, R.M. 1994 MNRAS 268, L29
- (2) Conti, P.S. & Ebbets, D. 1977 ApJ 213, 438
- (3) Crowther, P.A. 1997, in ASP Conf. Ser. 120, Luminous Blue Variables: Massive Stars in Transition, ed. A. Nota & H.J.G.L.M. Lamers (San Francisco: ASP), 51
- (4) Crowther, P.A. & Smith, L.J., 1997, A&A, 320, 500
- (5) de Jager, C., Nieuwenhuijzen, H., & van der Hucht, K.A. 1988, A&A, 72, 259
- (6) Dupree, A.K. & Reimers, D. 1987 in Exploring te Universe with the IUE Satellite, eds Y. Kondo et al. (Dordrecht:Reidel) p. 321,
- (7) Dufour, R.J. 1984 in Structure and Evolution of the Magellanic Clouds, IAU Symp 108, eds S. van den Bergh and K.S. de Boer, p 353
- (8) Dufour, R.J., Glover, T.W., Hester, J.J., Currie, D.G., van Orsow, D. & Walter, D.K. 1997, in ASP Conf. Ser. 120, Luminous Blue Variables: Massive Stars in Transition, ed. A. Nota & H.J.G.L.M. Lamers (San Francisco: ASP), 255
- (9) Ebbets, D.C., Walborn, N.R., & Parker J.Wm. 1997, ApJ 489, L161
- (10) Fliegner J., Langer N., Venn K.A., 1996, A&A 308, L13
- (11) Fullerton, A.W., Crowther, P.A., De Marco, O., et al. 2000, ApJL (in press)
- (12) García-Segura, G., Mac Low, M.-M. & Langer, N. 1996a, A&A 305, 229
- (13) García-Segura, G., Langer, N. & Mac Low, M.-M. 1996b, A&A 316, 133
- (14) Heger A. 1998, in The pre-supernova evolution of rotating massive stars, thesis Max Planck Inst für Astrophysik, Munich
- (15) Heger A., Jeannin L., Langer N., Baraffe I., 1997, A&A 327, 224
- (16) Heger A., Langer N. 2000, ApJ (in press)
- (17) Heger A., Langer N., Woosley S.E., 2000, ApJ, 528, 368
- (18) Humphreys, R.M. & Davidson, K. 1994 PASP 106, 1025
- (19) Humphreys, R.M. & Davidson, K. 1979 ApJ 231, 384
- (20) Hutsemékers, D., 1997 in ASP Conf. Ser. 120, Luminous Blue Variables: Massive Stars in Transition, ed. A. Nota & H.J.G.L.M. Lamers (San Francisco: ASP), 316
- (21) Johnson, D.R.H., Barlow, M.J., Drew, J.E., Brinks, E., 1992, MNRAS 255, 261
- (22) Killian, J. 1992, A&A 262, 171
- (23) Kippenhahn, R. & Weigert, A., 1990 in Stellar Structure and Evolution, (Berlin: Springer Verlag)
- (24) Korn,A.J., Becker, S.R., Gummersbach, C.A., Wolf, B., 2000, A&A 353, 655
- (25) Lamers, H.J.G.L.M. & Fitzpatrick, E.L., 1988, ApJ 324, 279
- (26) Lamers, H.J.G.L.M., Morris, P.W., Voors, R.H.M., van Gent, J.I., Waters, L.B.F.M., de Graauw, Th., Kudritzki, R.P., Najarro, F., Salama, A., Heras, A.M., 1996, A&A Letters 315, L225
- (27) Lamers, H.J.G.L.M. & Noordhoek, R. 1993, in ASP Conf. Ser. 35, Massive Stars: their Lives in the Interstellar Medium, ed. J.P. Cassinelli & E. Churchwell (San Francisco: ASP), 517
- (28) Langer, N., 1991, A&A 252, 669
- (29) Langer, N., 1998, A&A 329, 551
- (30) Langer, N., Hamann, W.-R., Lennon, M., Najarro, F., Pauldrach, A.W.A. & Puls, J. 1994, A&A 290, 819
- (31) Langer, N., García-Segura, G., Mac Low, M.-M., 1999, ApJ 520, L49
- (32) Leitherer, C 1997, in ASP Conf. Ser. 120, Luminous Blue Variables: Massive Stars in Transition, ed. A. Nota & H.J.G.L.M. Lamers (San Francisco: ASP), 58
- (33) Maeder, A. 1998 in ASP Conf Ser. 131, Boulder-Munich II: Properties of Hot Luminous Stars, ed I.D. Howarth, p. 85
- (34) Maeder, A. 1999, A&A 347, 185
- (35) Maeder, A. & Meynet, G. 1987, A&A 182, 243
- (36) Maeder, A. & Meynet, G. 1989, A&A 210, 155
- (37) Maeder, A. & Zahn J.-P., 1998, A&A 334, 1000
- (38) McGregor, P.J., Hyland, A.R., Hillier, D.J., 1988 ApJ 329, 874
- (39) Meynet G., 1998 in ASP Conf Ser. 131, Boulder-Munich II: Properties of Hot Luminous Stars, ed I.D. Howarth, 96
- (40) Meynet G., Maeder A., Schaller G., Schaerer D., Charbonnel C. 1994 Astr. Ap. Supp. 103, 97
- (41) Meynet G., Maeder A., 2000, A&A 361, 101
- (42) Nota, A. & Clampin, M., 1997 in ASP Conf. Ser. 120, Luminous Blue Variables: Massive Stars in Transition, ed. A. Nota & H.J.G.L.M. Lamers (San Francisco: ASP), 303
- (43) Nota A. & Lamers H.J.G.L.M. 1997, ASP Conf. Ser. 120, Luminous Blue Variables: Massive Stars in Transition, ed. A. Nota & H.J.G.L.M. Lamers (San Francisco: ASP), 303
- (44) Nota, A., Livio, M., Clampin, M. & Schulte-Ladbeck, R.E. 1995, ApJ 448, 788
- (45) Nota, A., Clampin, M., Pasquali, A., Robberto, M., Paresce, F. & Staude, J. 2000a, in preparation
- (46) Nota, A., Pasquali, A., Marston, A.P., Lamers, H.J.G.L.M., Clampin, M. & Schulte-Ladbeck, R.E. 2000b ApJ (in press)
- (47) Panagia, N. & Preite Martinez, A. 1975, A&A, 43, 93
- (48) Peimbert M. 1967, ApJ 150, 825
- (49) Pelupessy I., Lamers H.J.G.L.M. & Vink J.S. 1999, A&A, 359, 695
- (50) Reimers D. 1975, Mem. Soc. Roy. Sci. Liege, 6e Ser. 8, 369
- (51) Rolleston, W.R.J., Brown, P.J.F., Dufton, P.L. & Howarth, I.D. 1996, A&A 315, 95
- (52) Russell, S.C., Dopita, M.A., 1990, ApJS, 74, 93
- (53) Schaerer, D., de Koter, A., Schmutz, W., Maeder, A. 1996, A&A 310, 837
- (54) Schaller, G., Schaerer, D., Meynet, G. & Maeder, A. 1992, A&AS 96, 269
- (55) Schulte-Ladbeck, R.E., Clayton, G.C., Hillier, J.D., Harris, T.J. & Howarth, I.D., 1994, ApJ 429, 846
- (56) Schulte-Ladbeck et al. 2000 (in preparation)
- (57) Shaver P.A., McGee R.X., Newton L.M., Danks A.C. & Pottasch S.R. 1983, MNRAS 204, 53
- (58) Smith, K.C., Howarth, I.D., Siebert, K.W. 1998 in ASP Conf Ser. 131, Boulder-Munich II: Properties of Hot Luminous Stars, ed I.D. Howarth, 153
- (59) Smith, L.J., Stroud, M.P., Esteban, C. & Viĺchez 1997, MNRAS 290, 265
- (60) Smith, L.J., Nota, A., Pasquali, A., Leitherer, C., Clampin, M. & Crowther, P.A. 1998, ApJ 503, 278
- (61) Stothers, R.B. & Chin, C.-W. 1993, ApJ 408, 85
- (62) Stothers, R.B. & Chin, C.-W. 1996, ApJ 468, 842
- (63) Venn, K.A. 1996 PASP 108, 309
- (64) Venn, K.A. 1997, in ASP Conf. Ser. 120, Luminous Blue Variables: Massive Stars in Transition, ed. A. Nota & H.J.G.L.M. Lamers (San Francisco: ASP), 95
- (65) Venn, K.A. 1999, ApJ 518, 405
- (66) Vink, J.S., de Koter, A., Lamers, H.J.G.L.M., 2000 A&A (in press)
- (67) Voors R.H.M., Waters, L.B.F.M., de Koter, A., Bouwman, J., Morris, P.W., Barlow, M.J., Sylvetser, R.J., Trams, N.R., Lamers, H.J.G.L.M. 2000, A&A 356, 501
- (68) Walborn, N.R. 1988, in IAU Colloq. 108, Atmospheric Diagnostics of Stellar Evolution (Lecture Notes in Physics, vol 305), ed. K. Nomoto, (Berlin: Springer), 70
- (69) Waters, L.B.F.M., Morris, P.W., Voors, R.H.M., Lamers, H.J.G.L.M, 1997, in ASP Conf. Ser. 120, Luminous Blue Variables: Massive Stars in Transition, ed. A. Nota & H.J.G.L.M. Lamers (San Francisco: ASP), 326
- (70) Waters, L.B.F.M., Morris, P.W., Voors, R.H.M., Lamers, H.J.G.L.M, Trams, N.R. 1998, Ap & Space Sci 255, 179
- (71) Waters, L.B.F.M., Voors, R.H.M., Morris, P.W., Trams, N.R., de Koter, A., Lamers, H.J.G.L.M, 1999, in Variable and Non-spherical Stellar Winds in Luminous Hot Stars, eds B. Wolf et al., Lecture Notes in Physics Vol 523, (Berlin: Springer Verlag), 381
| Name | log | He/HaaThe ratios He/H, N/O, N/S and (N+O)/H are by number. | |||||
|---|---|---|---|---|---|---|---|
| kpc | phot | km s-1 | yrs | ||||
| AG Car | 6 | 6.0 | 0.42 | 4.2 | 70 | ||
| P Cyg | 1.8 | 5.8 | 0.40 | 0.01 | 140 | ||
| R 127 | 51.2 | 6.1 | 0.50 | 7.9 | 29 | 2 & 7x | |
| S 119 | 51.2 | 6.0 | 0.67 | 2.5 | 25 | 5 | |
| Name | [N/H]bbThe logarithmic over- and underabundance ratios are relative to the abundances of H II regions in the Galaxy (for AG Car and P Cyg) or the LMC (for R 127 and S 119). | [O/H]bbThe logarithmic over- and underabundance ratios are relative to the abundances of H II regions in the Galaxy (for AG Car and P Cyg) or the LMC (for R 127 and S 119). | N/OaaThe ratios He/H, N/O, N/S and (N+O)/H are by number. | N/SaaThe ratios He/H, N/O, N/S and (N+O)/H are by number. | (N+O)/HaaThe ratios He/H, N/O, N/S and (N+O)/H are by number. | ||
| cm-3 | K | ||||||
| AG Car | 820170 | 6350400 | 0.70.1 | 0.2 | |||
| P Cyg | 600 | 5300 | 0.75 | 33 | 0.4 to | ||
| R 127 | 72090 | 6400300 | 1.00.1 | 0.2 | 0.90.4 | ||
| S 119 | 680170 | 6200600 | 1.20.2 | 0.3 | 1.90.5 |
| Name | Ratio | He/H | He/H | ||||
|---|---|---|---|---|---|---|---|
| pred. | star | ||||||
| AG Car | 60 | N/O | 0.780.03 | 132 | 21 | 0.32 | 0.42 |
| P Cygni | 50 | N/S | 0.930.03 | 3.51.5 | 15 | 0.22 | 0.40 |
| R 127 | 75 | N/O | 1.00 | 0 | 25 | 0.10 | 0.50 |
| S 119 | 60 | N/O | 0.930.05 | 4.23.0 | 15 | 0.20 | 0.67 |
| Name | Ratio | P | He/H | He/H | ||||
|---|---|---|---|---|---|---|---|---|
| yrs | days | km s-1 | pred. | star | ||||
| AG Car | 70 | N/O | 6 | 100 | 0.33 | 0.42 | ||
| P Cygni | 50 | N/S | 8 | 70 | 0.18 | 0.40 | ||
| R 127 | 75 | N/O | 9 | 90 | 0.16 | 0.50 | ||
| S 119 | 65 | N/O | 8 | 100 | 0.18 | 0.67 |
a These are the rotation speeds on the main sequence that are required to produce the observed nebular abundances at the surface of the star by rotation induced mixing.