Galactic Bulge Pixel Lensing Events
Abstract
Gould & DePoy proposed a pixel lensing survey towards the Galactic bulge using a small aperture ( mm) camera with a large pixel size () detector and deliberately degraded optics achieving point spread function (PSF). In this paper, we estimate the event rate of this pixel lensing survey expected under various detection criteria, which are characterized by the threshold signal-to-noise ratio, , and event duration, , and investigate the characteristics of the detectable events. From this investigation, we find that the event rate varies significantly in the range – depending strongly on the imposed detection criteria, implying that to maximize event detections it will be essential to identify events by diligently inspecting light variations and to promptly conduct followup observations for the identified events. Compared to events detectable from classic lensing surveys, the events detectable from the pixel lensing survey will generally involve brighter source stars and have higher amplifications. For the pixel lensing events detectable under the criteria of and hr, we find that the baseline brightness of source stars will be in average mag brighter than those of classic lensing events and will have amplifications and will be extreme microlensing events (EMEs) with . Therefore, followup observations of the pixel lensing events will provide high quality data, which enable one to precisely determine the lensing parameters and obtain extra-information about the lenses and source stars. Especially, high amplifications events with will be important targets for high-efficiency planet detections and one can uniquely determine the mass, distance, and transverse speed of individual lenses for EMEs.
1 Introduction
The previous and the current microlensing surveys towards the Galactic bulge and the Magellanic Clouds (Alcock et al., 1993; Aubourg et al., 1993; Udalski et al., 1993; Alard & Guibert, 1997; Abe et al., 1997) have been and are being carried out by using the conventional photometric method based on the extraction of the individual source stars’ point spread function (PSF). With this method, the lensing-induced light variations can be measured only for events with resolved source stars, and thus events occurred to unresolved faint sources cannot be detected. Pixel lensing, on the other hand, detects and measures the variation of a source star flux by subtracting successive images of the same field from a normalized reference image (Tomaney & Crotts, 1996; Alard & Lupton, 1998; Alard, 1999), enabling one to measure the light variations even for unresolved source stars. The pixel lensing technique was originally proposed to search for lensing events towards the unresolved star field of M31 (Crotts, 1992; Baillion et al., 1993). Recently, pixel lensing searches have been conducted towards the resolved Galactic bulge field (Alcock et al., 1999a, b, 2000), but they are intended to make use of the additional sources lying below the detection threshold, and so to increase the sensitivity of the existing experiments.
Gould & DePoy (1998) proposed a radically different type of pixel lensing survey towards the Galactic bulge using a small aperture ( mm) camera with a large pixel-size () detector and deliberately degraded optics achieving PSF. With these instruments, the observations are analogous to the normal pixel lensing observations of the bulge of M31, but are carried out under conditions where the detected events can be followed up in detail. Since the proposed PSF set by the optics will not vary in time with atmospheric conditions, the data reduction process will be very simple. Compared to classic lensing surveys based on PSF photometry, the proposed pixel lensing survey has an advantage of the broad coverage of most or all of the () southern bulge field of interest with the large field of view ( with a 2K2K CCD camera). In addition, the instrumentation required to carry out the survey will be inexpensive. Gould & DePoy (1998) described the possibility of the Galactic bulge pixel lensing survey in general, but detailed estimation of the event rate and investigation about the characteristics of the detectable events have not been done.
In this paper, we estimate the event rate of the proposed Galactic pixel lensing survey expected under various detection criteria and investigate the characteristics of the detectable events.
2 Event Rate Estimation
2.1 Event Production
To estimate the event rate, we perform simulations of Galactic bulge pixel lensing events by producing a large number of artificial light curves. The light curve of a pixel lensing event is represented by
| (1) |
| (2) |
where is the baseline flux of the source star, is the amplification, is the lens-source separation (normalized by the angular Einstein ring radius ), is the Einstein ring radius crossing time (Einstein timescale), and is the impact parameter (also normalized by ). The Einstein timescale is related to the physical parameters of the lens system by
| (3) |
where is the Einstein ring radius, is the lens mass, is the lens-source transverse speed, and and represent the distances to the lens and source from the observer, respectively. Therefore, to produce a pixel lensing event light curve, it is required to define the lensing parameters of , , , , , and .
We produce light curves by selecting the lensing parameters so that the event rate, , becomes
|
|
(4) |
where and are the density distributions of the lens and source locations, are the two components of the transverse velocity, is their distribution, is the lens mass function, is the absolute luminosity function of source stars, and is the distribution of impact parameters. In eq. (4), the factors and are included because events with larger cross-sections (i.e. ) and higher transverse speeds have higher chances of being lensed.
For the source and lens density distributions, we adopt a barred bulge model of Dwek et al. (1995) and a double-exponential disk model of Bahcall (1986). The Dwek et al. bulge model is represented by
| (5) |
where , are the three axes of the triaxial bulge ( is the longest and is the shortest), and are the scale lengths. The normalization constant is set so that the total bulge mass becomes (Han & Gould, 1995). The Bahcall disk model is represented by
| (6) |
where and are the radial and vertical scale heights of the disk and is the galactocentric distance of the sun.
For the transverse velocity distribution, we adopt the model of Han & Gould (1995). In this model, the velocity distributions for both disk and bulge components have a Gaussian form, i.e.
| (7) |
where the means and the standard deviations of the individual velocity components are
| (8) |
| (9) |
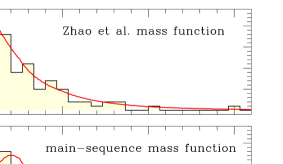
Unlike the models of the matter density and velocity distributions that are constrained by observations, our knowledge about the lens mass function is very poor. Therefore, we start with several proposed models of the lens mass function and compute the resulting distributions, , combined with the adopted models of the matter density and velocity distributions. Then the mass function model producing distribution that best matches the observed one is used for our simulation. We test three mass function models. These models are a main-sequence mass function of Kroupa, Tout & Gilmore (1993) (with three powers of for , for , and for ), a single power-law distribution of Han & Gould (1996) (with and a mass cutoff of ), and another power-law distribution of Zhao, Spergel, & Rich (1995) (with and ). In Figure 1, we present the distributions of Einstein timescales resulting from the model mass functions and they are compared with that of the latest data of the 97 events detected by the MACHO group (Alcock et al., 1999b, 2000). One finds that the distribution resulting from the Zhao et al. (1995) model is consistent with the observed one, while those resulting from the Han & Gould (1996) and Kroupa et al. (1993) models produce short timescale events that are more than and less than the observed one, respectively. Therefore, we adopt the Zhao et al. (1995) model for our simulation.
For the source brightness distribution, we adopt the -band absolute luminosity function determined by Kroupa (1995). We assume that photometry of the pixel lensing survey is carried out in band because more light can be obtained due to its large band width and small amount of extinction compared to other optical bands. Once the location of a source star and its absolute brightness, , are selected, the apparent source star brightness is obtained by calculating the corresponding distance modulus, , and extinction, , i.e. . Due to the patchy and irregular characteristics of the Galactic interstellar absorbing matter distribution, it is difficult to model its detailed distribution. Hence, we approximate that the interstellar matter is distributed similar to the Galactic disk matter distribution. With this approximation, the source flux is decreased from its de-reddened value by a factor , where represents the column density of the absorbing matter located between the observer and source star and is a normalization constant. Stanek (1996) determined that the extinction in band towards the Baade’s Window (BW) varies – with the most frequent value of . With the relation also provided by him, this corresponds to – with . Therefore, we set the value so that the average amount of extinction towards the BW becomes at a distance of . We discuss the effect of variable extinction with position on the sky in the following subsection.
Under the definition of a lensing event as ‘a close lens-source encounter within the Einstein ring of a lens’, the impact parameters are randomly chosen, i.e. , in the range .
2.2 Efficiency Determination
Once events are produced, we then determine the efficiency of pixel lensing event detection by imposing the following detection criteria.
First, we require detectable events should have high signal-to-noise ratios during their peak amplifications. Since the uncertainty of the light variation measurement of a pixel lensing event is almost totally dominated by the background flux, the signal-to-noise ratio is computed by
| (10) |
where min is the mean exposure time and is the average background flux. Determination of is described below.
Second, since event detection is also restricted by the duration of events, , we additionally require detectable events should last long enough for solid confirmation. We define the duration as ‘the length of the time period during which the signal-to-noise ratio exceeds a threshold value of ’ and it is computed by
| (11) |
where represents the maximum allowed impact parameter for an event to satisfy the threshold signal-to-noise ratio (Han, 1999). To compute , we first compute the threshold amplification corresponding to by numerically solving eq. (10). With the obtained value of , then, the threshold impact parameter is obtained by
| (12) |
With these detection criteria, the detection efficiency is determined by obtaining the ratio of the number of events satisfying the above detection criteria out of the total number of tested events.
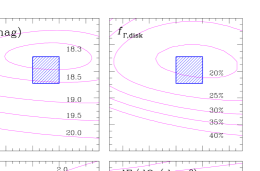
The proposed pixel lensing survey will be performed on a large area of the sky. Then, the event rate per unit angular area, , will be different for different regions of the sky because the stellar distribution is not uniform due to the variation both in geometric distance from the Galactic center and extinction. In addition, the spatial variation of the optical depth, , and the disk/bulge event ratio with the position on the sky also makes the event rate depend on the observed field. To consider this effect, we construct maps of the surface brightness, , optical depth, , and the disk event fraction, . The surface brightness map is constructed by using the matter density distribution and extinction models described in § 2.1. The map is normalized so that the de-reddened surface brightness of the BW field contributed by bulge stars becomes (Terndrup, 1998) and the amount of the extinction towards the same field becomes mag. With the additional flux from disk stars, which is of the flux from bulge stars, and the sky background flux, which contributes of the total stellar background flux, then the average background flux within the PSF (with an angular area of ) of the BW field becomes . The optical depth represents the average probability for a single source to be gravitationally amplified by a factor at a given moment and it is computed by
|
|
(13) |
The disk event fraction is approximated by , where represents the ratio of disk event contribution to the optical depth and is included because disk lensing events tend to have longer (Han & Gould, 1995) and thus is smaller than . In Figure 2, we present the maps of , , and .
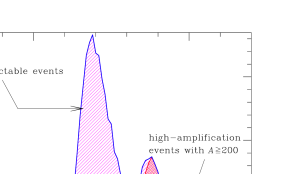
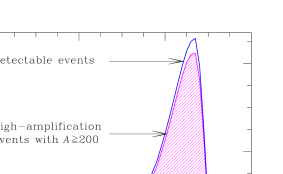
In Figure 3, we present the baseline source star brightness distribution for pixel lensing events (effective source luminosity function, ). The presented is for the source stars of the events detectable towards the BW under the criteria of and hr. It is normalized so that the surface flux contributed by all source stars matches the background stellar flux. In the figure, we also present the effective luminosity functions for events with high amplifications: light shaded region for events with and dark shaded region for events with (extreme microlensing events, EMEs).
2.3 Total Event Rate
With the obtained effective luminosity function, the total pixel lensing event rate is then calculated by
|
|
(14) |
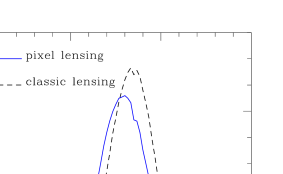
where is the total number of effective source stars of a field, is the mean value of the inverse Einstein timescales of the events detected towards the field, and is the pixel lensing optical depth. Compared to the source stars of events detectable from classic lensing surveys (classic lensing events), those of pixel lensing events will be systematically brighter, and thus closer. This can be seen in Figure 4, where we plot the distributions of the source locations for classic, , and pixel lensing events, . As a result, the pixel lensing optical depth will be smaller than the value determined by the classic lensing survey, . We, therefore, apply decreased from by a factor
|
|
(15) |
We set the mean value of the classic lensing optical depth towards the BW to be by adopting the determination of Alcock et al. (2000). In the lower right panel of Fig. 2, we present the distribution for the events detectable under the criteria of and hr. We assume that the total observation time per year is days and the total angular area of the monitored field is .
| detection criteria | event rate () | |||
|---|---|---|---|---|
| 7 | 119.9 | 113.4 (94.6%) | 63.8 (53.2%) | |
| – | 53.1 | 47.5 (89.4%) | 19.3 (36.3%) | |
| – | 29.8 | 25.0 (83.9%) | 8.1 (27.2%) | |
| – | 12.5 | 9.1 (72.8%) | 2.4 (19.2%) | |
| 10 | 70.1 | 66.8 (95.3%) | 38.8 (55.3%) | |
| – | 28.9 | 26.0 (90.9%) | 11.4 (39.4%) | |
| – | 13.9 | 11.5 (82.7%) | 4.4 (31.7%) | |
| – | 5.8 | 4.0 (69.0%) | 1.1 (19.0%) | |
Note. — The event rates expected from the proposed Galactic pixel lensing experiments expected to be detected under various detection criteria, which are characterized by the threshold signal-to-noise ratio, , and event duration, . The values in the columns of and represent the rates of high amplifications events with and and their fractions, respectively.
3 Results
In Table 1, we list the determined Galactic pixel lensing event rates expected under various criteria, which are characterized by and . The important results from the determined detection rates of pixel lensing events and their characteristics are summarized as follows.
First, the total event rate varies significantly in the range – depending strongly on the imposed detection criteria. As expected, the event rate increases as and decreases. The strong dependency of the detection rate on implies that majority of events will have short durations. Therefore, to maximize the event rate it will be essential to identify pixel lensing events by diligently inspecting light variations with signals as low as possible and to conduct followup observations for the identified events as promptly as possible. If events are identified for all signals with and followup observations are carried out within an hour (corresponding to hr) after the identification, we find that the event rate can reach up to .
Second, the majority of pixel lensing events will have high amplifications. For example, we estimate that of the pixel lensing events detectable under the criteria of and hr will have amplifications and will be EMEs. These fractions increase as the imposed becomes shorter. As will be discussed in § 4, events with are excellent followup monitoring targets for high efficiency extra-solar planet detections (Griest & Safizadeh, 1998; Han & Kim, 2001). In addition, followup observation of EMEs enables one to uniquely determine the masses, distances, and transverse speeds of the individual lenses (Gould, 1997; Sumi & Honma, 2000).
Third, compared to classic lensing events, the events detectable by the proposed pixel lensing experiment will generally involve brighter source stars, as predicted by Gould & DePoy (1998). Under the detection criteria of and hr, for example, we find that the baseline brightness distribution of the pixel lensing event source stars peaks at (see Fig. 3), which is mag brighter than that of the classic lensing events [cf. Fig. 7 of Alcock et al. (2000)]. The source star brightness becomes even brighter as one applies stricter detection criteria, i.e. higher and longer . Since pixel lensing events tend to have high amplifications, the source during its peak amplification will become even brighter. In Figure 5, we present the distribution of peak brightnesses of source stars for events expected to be detected under the conditions of and hr. One finds that the peak brightnesses of nearly all events are brighter than .
4 Discussion
Due to the difference in the characteristics of pixel lensing events from classic ones, the proposed pixel lensing experiment has both advantages and disadvantages. The greatest disadvantage is that the pixel lensing survey should be carried out in parallel with followup observations to obtain meaningful results. However, several groups (Albrow, et al., 1998; Rhie et al., 1999) are already conducting such followup observations, and thus the pixel lensing observations can be made in parallel with these existing observations. Once this problem is resolved, the proposed pixel lensing survey will be able to provide the following important scientific rewards.
First, one can determine the lensing parameters of events with improved precision and accuracy. Precise determination of the lensing parameters is achieved because high precision photometry is possible for pixel lensing events because they generally involve brighter source stars and have higher amplifications. The accuracy, on the other hand, is improved because the effect of blended light from unresolved nearby faint stars is minimized with the increased signal from the lensed source. With the reduced uncertainties in the determined lensing parameters, one can better constrain the nature of Galactic lenses.
Second, one can obtain various useful extra information both about the lens and source star by efficiently detecting lensing light curve anomalies. A lensing light curve deviates from the standard form due to various reasons, e.g. the extended source effect (Schneider, Ehlers, & Falco, 1992; Witt & Mao, 2000), parallax effect (Refsdal, 1966; Gould, 1994), binary lens effect (Schneider & Weiss, 1986; Witt, 1990), planetary lens effect (Mao & Paczyński, 1991; Gould & Loeb, 1992; Bolatto & Falco, 1994), and binary source effect (Griest & Hu, 1992; Han & Gould, 1997). However, the amount of these deviations is usually very small, and thus detecting them requires high-precision observations. Since better photometry is possible for pixel lensing events, the efficiency of detecting light curve anomalies will be increased.
Third, a significant fraction of high amplification pixel lensing events will be ideal monitoring targets of high-efficiency planet detections. Griest & Safizadeh (1998) pointed out that by intensively monitoring high amplification events, planets located in the lensing zone ( – ) can be detected with a nearly 100% efficiency. Since majority of Galactic pixel lensing events will have high amplifications, they will be ideal targets for intensive followup monitoring for high-efficiency planet detections. Covone et al. (2000) pointed out that monitoring the pixel lensing events detectable towards the M31 (Crotts & Tomaney, 1996; Ansari et al., 1997; Crotts et al., 2000) will also provide a channel for high efficiency planets detections via microlensing. We note, however, that since followup observations cannot be done for M31 pixel lensing events, although one might detect planet-induced anomalies in the light curves, it will be very difficult to determine the planet parameters (i.e. the mass ratio and separation) just based on the peak part of the light curve. By contrast, since one can perform high-precision followup observations for Galactic bulge pixel lensing events, one can accurately determine the planet parameters.
Another importance of the pixel lensing survey is that one can uniquely determine the physical parameters of individual lenses for EMEs, which will comprise a significant fraction of all pixel lensing events. Gould (1997) showed that followup observations of an EME enable one to measure both the lens proper motion and parallax that together would yield individual mass, distance, and transverse-speed of the lensing object. The proper motion is determined by analyzing the light curve anomalies induced by the extended source effect which occur when the lens approaches very close to the source star. The parallax is determined by observing the difference in the peak parts of the light curves as seen from two Earth observers separated by .
5 Conclusion
We estimate the event rate of the pixel lensing survey towards the Galactic bulge proposed by Gould & DePoy (1998) expected under various detection criteria and investigate the characteristics of the detectable events. From this investigation, we find that the event rate varies significantly in the range – depending strongly on the imposed detection criteria. This implies that to maximize event detections it will be essential to identify events by diligently inspecting light variations and to promptly conduct followup observations for the identified events. Compared to classic lensing events, the events detectable by the proposed pixel lensing survey will generally involve brighter source stars and have higher amplifications. For the pixel lensing events detectable under the criteria of and hr, for example, we find that the baseline source brightness will be mag brighter than those of classic lensing events and most of them () will have high amplifications with and a significant fraction of them () will be EMEs. The high amplification events will be especially important because they are excellent targets for effcient extra-solar planet detections. In addition, one can uniquely determine the mass, distance, and transverse speed of individual lensing objects for EMEs.
References
- Abe et al. (1997) Abe, F., et al. 1997, in Variable Stars and the Astrophysical Returns of the Microlensing Surveys, eds. R. Ferlet, J.-P. Milliard, & B. Raba (Cedex: Editions Frontieres), 75
- Alard (1999) Alard, C. 1999, A&A, 343, 10
- Alard & Guibert (1997) Alard, C., & Guibert, J. 1997, A&A, 326, 1
- Alard & Lupton (1998) Alard, C., & Lupton, R. H. 1998, ApJ, 503, 325
- Albrow, et al. (1998) Albrow, M. D., et al. 1998, ApJ, 509, 687
- Alcock et al. (1993) Alcock, C., et al. 1993, Nature, 365, 621
- Alcock et al. (1999a) Alcock, C., et al. 1999a, ApJ, 521, 602
- Alcock et al. (1999b) Alcock, C., et al. 1999b, ApJS, 124, 171
- Alcock et al. (2000) Alcock, C., et al. 2000, ApJ, 541, 734
- Ansari et al. (1997) Ansari, R., et al. 1997, A&A, 324, 843
- Aubourg et al. (1993) Aubourg, E., et al. 1993, Nature, 365, 623
- Baillion et al. (1993) Baillion, P., Bouquet, A., Giraud-Héraud, Y., & Kaplan, J. 1993, A&A, 277, 1
- Bahcall (1986) Bahcall, J. N. 1986, ARA&A, 24, 577
- Bolatto & Falco (1994) Bolatto, A. D., & Falco, E. F. 1994, ApJ, 436, 112
- Covone et al. (2000) Covone, G., de Ritis, R., Dominik, M., & Mirino, A. A. 2000, A&A, 357, 816
- Crotts (1992) Crotts, A. P. S. 1992, ApJ, 399, L43
- Crotts & Tomaney (1996) Crotts, A. P. S., & Tomaney, A.B. 1996, ApJ, 473, L87
- Crotts et al. (2000) Crotts, A., Uglesich, R., Gould, A., Gyuk, G., Sackett, P., Kuijken, K., Sutherland, W., & Widrow, L. 2000, in ASP Conf. Proc., Microlensing 2000: A New Era of Microlensing Astrophysics, eds. J. W. Menzies and P. D. Sackett, in press
- Dwek et al. (1995) Dwek, E., et al. 1995, ApJ, 445, 716
- Gould (1994) Gould, A. 1994, ApJ, 421, L75
- Gould (1997) Gould, A. 1997, ApJ, 480, 188
- Gould & DePoy (1998) Gould, A., & DePoy, D. L. 1998, ApJ, 487, 62
- Gould & Loeb (1992) Gould, A., & Loeb, A. 1992, ApJ, 396, 104
- Griest & Hu (1992) Griest, K., & Hu, W. 1992, ApJ, 397, 367
- Griest & Safizadeh (1998) Griest, K., & Safizadeh, N. 1998, ApJ, 500, 37
- Han (1999) Han, C. 1999, MNRAS, 309, 373
- Han & Gould (1995) Han, C., & Gould, A. 1995, ApJ, 449, 521
- Han & Gould (1996) Han, C., & Gould, A. 1996, ApJ, 467, 540
- Han & Gould (1997) Han, C., & Gould, A. 1997, ApJ, 480, 196
- Han & Kim (2001) Han, C., & Kim, Y.-G. 2001, ApJ, 546, 975
- Kroupa (1995) Kroupa, P. 1995, ApJ, 453, 358
- Kroupa, Tout & Gilmore (1993) Kroupa P., Tout C. A., & Gilmore G., 1993, MNRAS, 262, 545
- Mao & Paczyński (1991) Mao, S., & Paczyński, B. 1991, ApJ, 374, L37
- Refsdal (1966) Refsdal, S. 1966, MNRAS, 134, 315
- Rhie et al. (1999) Rhie, S. H., Becker, A. C., Bennett, D. P., Fragile, P. C., Johnson, P. R., King, L. J., Peterson, B. A., & Quinn, J. 1999, ApJ, 522, 1037
- Schneider, Ehlers, & Falco (1992) Schneider, P., Ehlers, J., & Falco, E. F. 1992, Gravitational Lenses (Springer: Berlin), 313
- Schneider & Weiss (1986) Schneider, P., & Weiss, A. 1986, A&A, 164, 237
- Stanek (1996) Stanek, K. J. 1996, ApJ, 460, L37
- Sumi & Honma (2000) Sumi, T., & Honma, M. 2000, ApJ, 538, 657
- Terndrup (1998) Terndrup, D. T. 1998, AJ, 96, 884
- Tomaney & Crotts (1996) Tomaney, A. B., & Crotts, A. P. S. 1996, AJ, 112, 2872
- Udalski et al. (1993) Udalski, A., et al. 1993, Acta Astron., 43, 289
- Witt (1990) Witt, H. J. 1990, A&A, 236, 311
- Witt & Mao (2000) Witt, H. J., & Mao, S. 1994, ApJ, 430, 505
- Zhao, Spergel, & Rich (1995) Zhao, H., Spergel, D. N., & Rich R. M. 2000, ApJ, 440, L13