The Expected Mass Function for
Low Mass Galaxies in a CDM Cosmology:
Is There a Problem?
Abstract
It is well known that the mass function for halos in CDM cosmology is a relatively steep power law () for low masses, possibly too steep to be consistent with observations. But how steep is the galaxy mass function? We have analyzed the stellar and gas mass functions of the first massive luminous objects formed in a CDM universe, as calculated in the numerical simulation described in Gnedin (2000ab). Our analysis indicates that, as suspected, the relationship between luminous or gaseous matter and total (primarily dark matter) mass is not a linear scaling relation — i.e., light does not trace mass. While the dark matter mass function is steep, the stellar and gas mass functions are flatter for low mass objects. The stellar mass function is consistently flat at the low mass end. Moreover, while the gas mass function follows the dark matter mass function until reionization at , between and , the gas mass function also flattens considerably at the low mass end. At , the gas and stellar mass functions are fit by a Schechter function with , significantly shallower than the dark matter halo mass function and consistent with some recent observations. The baryonic mass functions are shallower because (a) the dark matter halo mass (differential) function is consistent with the Press-Schechter formulation at low masses and (b) heating/cooling and ionization processes appear to cause baryons to collect in halos with the relationship at low masses. Combining (a) and (b) gives , comparable to the simulation results. Thus, the well known observational fact that low mass galaxies are underabundant as compared to expectations from numerical dark matter simulations or Press-Schechter modeling of CDM universes emerges naturally from these results, implying that perhaps no “new physics” beyond the standard model is needed.
1 Introduction
Recent interest in modifying the standard CDM theory of the origin of structure in the universe has been motivated largely by observations on sub-galactic scales. In particular, the most straight-forward interpretation of the results of theoretical calculations appear to be in conflict with the observed characteristics of spheroidal galaxies (i.e., bulges of spirals and small to moderate ellipticals) with respect to their individual physical properties, luminosity function, and clustering properties (Sellwood and Kosowsky 2000, Klypin et al. 2000, Navarro and Steinmetz 2000). These facts have led some authors to turn to alternative models such as quantum isocurvature (Peebles 1999ab), Self-Interacting Dark Matter (Spergel and Steinhardt, 2000), and Warm Dark Matter (Bode et al., 2001).
However, while measurements such as those of the cosmic microwave background radiation can be directly computed from theory in a relatively straight-forward manner, the abundance and clustering of luminous galaxies cannot at the present time be directly calculated with any certainty. Such calculations are hampered by the classic problem of relating light to mass. The simplest way to relate dark matter density to galaxy counts is to assume a proportionality in the fluctuations. This has led to the invention of the “spatial bias parameter .” With the increasing sophistication of both theory and observations, we have discovered that bias must depend on both length scale and galactic type (because different types of galaxies have different clustering properties) and possibly on both local density and temperature (Blanton et al., 2000a).
But what is the relation between dark matter halos and galaxies as a function of mass? Is it plausible to assume that each dark matter halo contains a galaxy having stellar mass and light proportional to the dark matter mass? The earliest phenomenological treatments explored this possibility, but observationally it is clearly false. For example, the most massive () identifiable dark matter halos — found from large angle arcs and multiply imaged galaxies — correspond to clusters of distinct galaxies and do not contain supergiant galaxies of corresponding baryonic mass ().
For dark matter halos less than or comparable to , the prevailing belief is that they will typically contain one “galaxy” and several satellites, but whether this description is accurate (and informative rather than definitional) is not known very securely. In the semianalytic treatment of galaxy formation (Somerville and Primack 1999, Lobo and Guiderdoni 1999, Chiu and Ostriker 2000) halos are identified with galaxies by a set of prescriptions that, overall, appears to correspond to reality. But, hydrodynamic simulations tend in this mass range to find several galaxies orbiting within a common halo (Cen and Ostriker, 2000).
For still lower mass galaxies (and presumably lower mass halos), we know that the mass/light ratio becomes large, implying that galaxy formation was inefficient for small systems. Thus, we are led to ask, could the physical bias against low mass systems naturally produce a mass function for galaxies significantly flatter than that of the dark matter halo mass function? If so, some of the apparent discrepancies between CDM cosmologies and observations might disappear.
It may be that some of the other discrepancies, such as those that depend on lensing (Li and Ostriker, 2000), shape (Moore et al. 1999b, Miralda-Escudé 2000, Navarro and Steinmetz 2000), or small scale potential fluctuations (Moore et al., 1999a), will remain and require serious reexamination of the CDM paradigm. But the driving reason for reexamination — the much smaller than expected number density of small galaxies — might simply be a result of well understood physical properties. This has been suggested already (Silk 1977, Lobo and Guiderdoni 1999) on the basis of semianalytical arguments. The purpose of this paper is to see if the mass function of low mass galaxies (“faint” galaxies) is significantly flatter than that for low mass halos, and the evidence from the hydrodynamic simulation examined (Gnedin 2000ab) is yes.
2 The Hydrodynamical Simulation
The simulation code used here is based on Smoothed Lagrangian Hydrodynamics and is fully described in Gnedin (2000a). It is an extension of that reported on in Gnedin (1995, 1996), Gnedin and Bertschinger (1996), and Gnedin and Ostriker (1997). In brief, this simulation contains dark matter particles, a baryonic mesh of the same size, has a spatial resolution of 1.0 kpc/, and a box size of (Mpc/)3. The baryonic mass resolution is . In addition, the code includes heuristic star formation, with the creation of stellar “particles” whose dynamics only depends on gravity. Finally, reionization by these “stars” is modeled with the local optical depth approach which is able to approximately follow three-dimensional radiative transfer. Because the present day nonlinear scale is larger than the box size, the simulation can not be continued to the present, and was stopped at a redshift . Bound objects at each epoch are identified through use of the DENMAX (Bertschinger and Gelb, 1991) algorithm. The simulation run analyzed here is the same as the “production run” analyzed in Gnedin (2000ab). The cosmological parameters are , , , , , and (COBE normalized).
Using results of a similar code, Gnedin and Ostriker (1997) showed that ionization is largely complete for a standard CDM model at . In addition, Gnedin, Norman, and Ostriker (2000) recently showed that when the effects of gas cooling and star formation are included, massive bulges are able to collapse to densities exceeding that of the dark matter, resulting in structures that resemble observed objects in their sizes, shapes, and density profiles.
3 Mass Functions of Spheroidal Galaxies
Here, we examine the mass functions of the dark and baryonic components of the bound objects formed in our hydrodynamical simulation. From the simulation results, we calculate the mass function the number of objects with mass in component , where dark matter (d), gas (g), or stellar particles (s). If dark matter, gas, and stellar particles all trace each other, then
| (1) |
with the mass scaling
| (2) |
where is the fraction of the mass of the universe in species . The dark matter fraction is universal. Baryons are either in the form of gas or stellar particles, so that . The fraction of mass in stellar particles is given in Table 1 as a function of redshift. At all times, less than 4% of the baryons are in the form of stellar particles, so remains approximately constant.
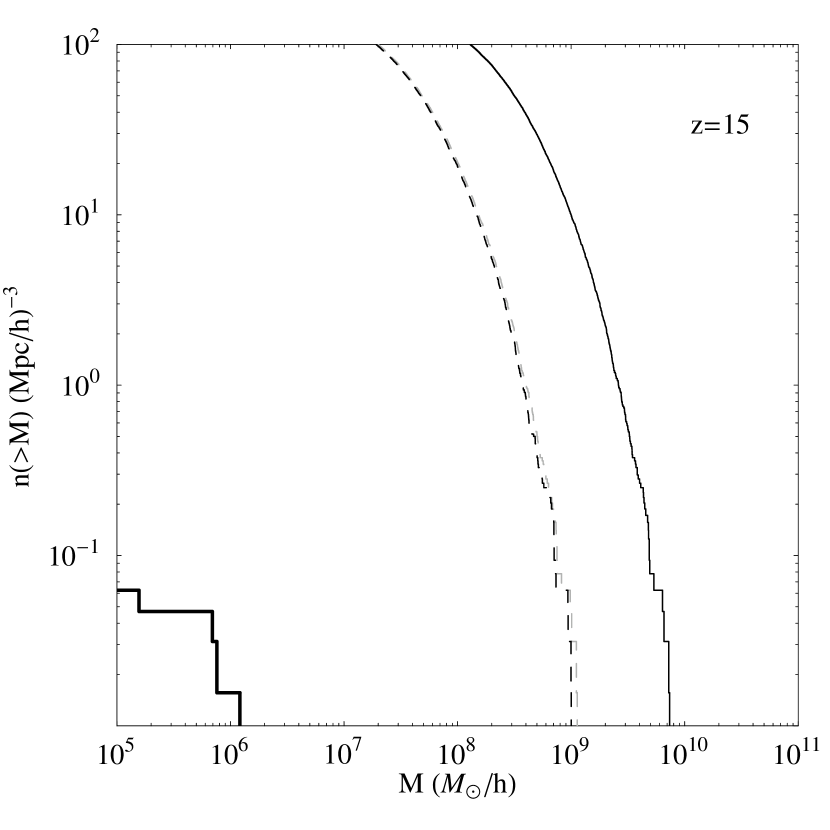
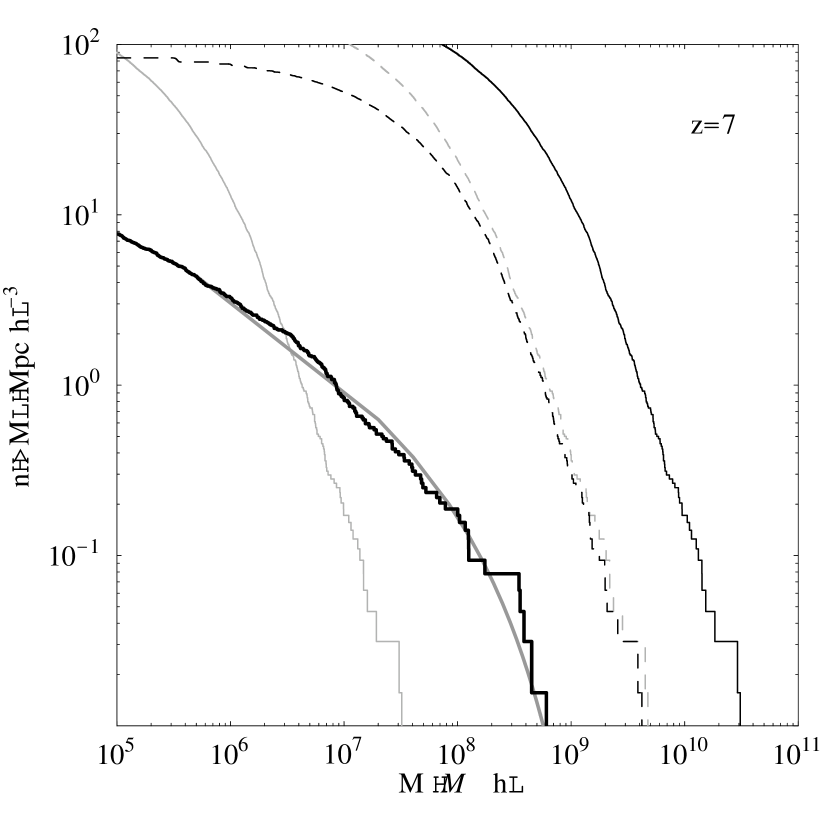
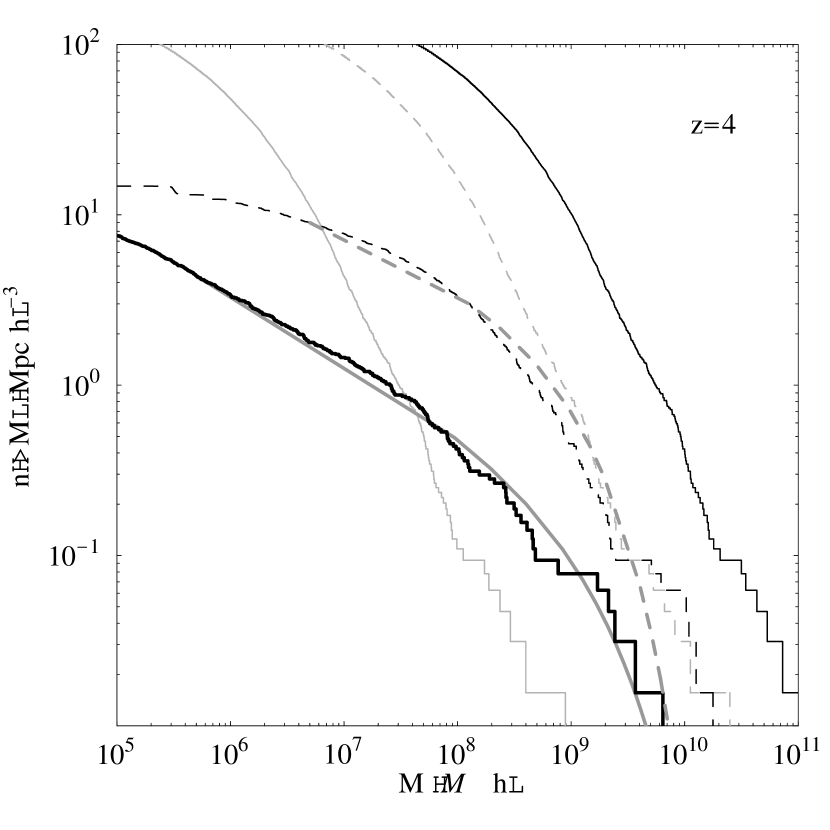
The results of the comparison of the mass functions are given in Figures 1–3. The dark lines are measured from simulations, whereas the gray lines are various fits. The thin grey lines are the dark matter mass functions scaled via equations (1)–(2). The thick gray lines are fits with a Schechter function for the stellar ( and ) and gas ( only) components. The fits consistently give values of when fit for objects with () or (). These mass cutoffs were chosen due to numerical resolution considerations ( and baryonic mass resolution for stellar mass and gas mass respectively). The exponential cutoff may not be very accurate, since there is a lack of large scale power due to the small box size of the simulation.
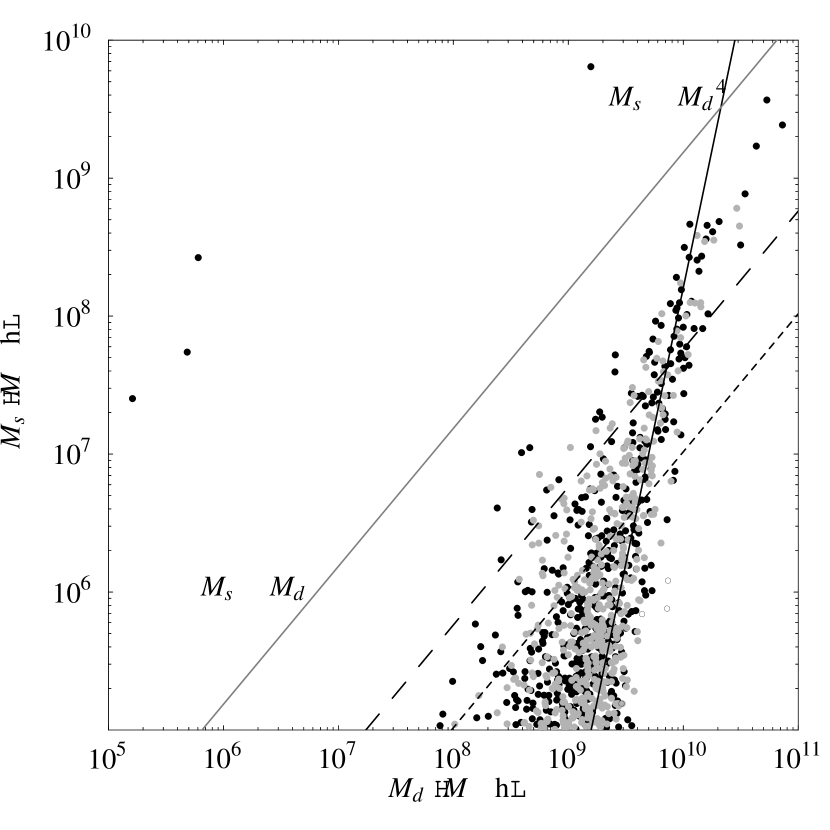
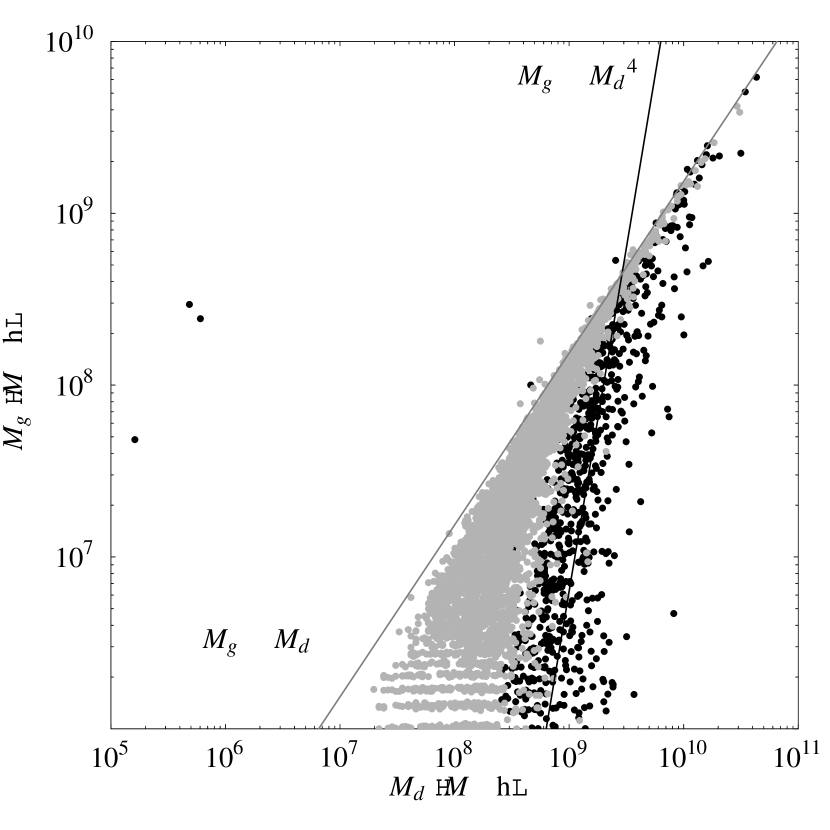
As an additional check, we compared the bound objects’ dark and stellar masses as shown in Figure 4. Also shown are power laws and . The motivation for this power law is the finding by Gnedin (2000b) that in low mass objects, heating consequent to reionization leads to a filtering of the baryonic mass resulting with such a relationship. The power law is a generally a good fit, while clearly fails.
Figure 4 also shows that the “tail” of the distribution around the relationship is skewed so that for a given stellar mass , the dispersion towards lower is greater than the dispersion towards greater . Even given this skewed distribution, there are several significant outliers in the tail. In particular, four bound objects with stellar mass have significantly enhanced stellar mass fractions. For these objects, the fraction of mass in stellar particles is greater than even the universal baryon/dark matter mass ratio (shown in gray).
Shown in Figure 5 is the gas mass as a function of the dark matter mass. While the stellar mass showed a clear dependence for all values of for all relevant epochs, the gas mass (consistent with Gnedin 2000b) shows an evolving relationship. The gas starts out following the dark matter mass . After reionization, a relation develops at low masses, with the mass at which there is a transition to increasing with time.
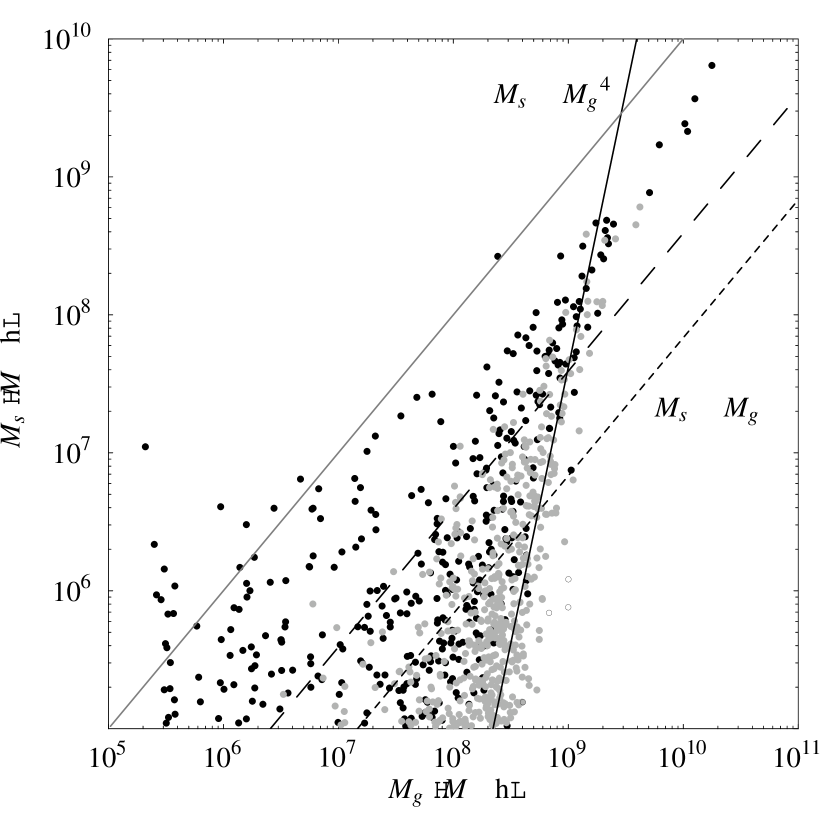
Finally, shown in Figure 6 is the stellar mass as a function of the gas mass of bound objects. Because the gas and dark matter are closely correlated up until , at these epochs, the relationship between stellar mass and gas mass is similar to that between the stellar mass and the dark mass . However, between and , gas “ejection” from low mass halos is clearly evident. This reduction in the gas mass fraction was noted in the analysis of Gnedin (2000b). In some cases, the mass in gas is less than the mass in stellar particles — i.e., most of the gas in the halo has been converted to stars or ejected.
4 Discussion: Why Is the Galaxy Mass Function Flatter Than the Dark Matter Mass Function?
The logarithmic slope of the galaxy mass function is significantly shallower than the dark matter halo mass function, particularly for low baryonic masses ( or ). Therefore identification of low mass halos with low mass galaxies is incorrect. For instance, a one-to-one mapping of dark matter halos to galaxies normalized to high baryonic mass halos would result in an overestimate of the number of low baryonic mass systems by several orders of magnitude. In particular, this slope is comparable to that observed for low mass galaxies (Cross et al. 2000, Blanton et al. 2000b).
The explanation of the value of is easy to explain as a combination of the dark matter halo mass function and the relationship between baryonic mass and dark matter mass in halos. The dark matter mass function follows the steep slope expected from the Press-Schechter (Press and Schechter, 1974) approximation
| (3) | |||||
where is the comoving number density per unit mass, is the mean mass density today, is the critical linear density for collapse, is the rms mass fluctuation, and we are considering small scale fluctuations where and is a very weak function of mass. From Figures 4 and 5, is it clear that
| (4) |
for and
| (5) |
for at low masses. Combining equation (3) with equations (4)-(5) gives
| (6) | |||||
| (7) |
for low masses. Thus this simple analytic derivation explains the simulation results: the stellar mass function appears to be flat by while the gas mass function evolves from simple scaling with the dark matter for redshifts of to a gradual flattening to look like the stellar mass function from .
Without additional analysis, it is difficult to determine whether the similarity in the two mass functions is (a) coincidental — two different mechanisms, (b) correlational — same mechanism of both, or (c) causal — stars gas. Clearly, though, the key to this question is understanding the origin of the behavior for both stars and gas, and how they are related. Whatever its origin, the result reported above appears to be robust, since Nagamine et al. (2001) found the same flattening in the stellar mass function in a simulation using a completely different numerical treatment of gas (e.g., Eulerian rather than Lagrangian), radiation, and star formation. This work, using very different numerical techniques (but a comparable mass resolution) also found for the baryonic mass function.
Let us also consider the sensitivity to the star formation efficiency. If the star formation prescription underestimates star formation and all the remaining gas should have turned into stars by , the stellar mass function would retain largely the same shape, but with a higher normalization. Only if the prescription overestimates star formation would the shape change significantly. In this case, the mass function would be even flatter, and CDM could have the opposite problem of underproducing low mass galaxies!
In fact, assuming that all the gas in halos at turns into stars by (and neglecting the effects of merging) gives a “turnover” at a circular velocity of km/s. That is, the stellar mass function would follow the dark matter for km/s, and would have a logarithmic slope of for km/s. This corresponds closely to the observed circular velocity distribution of galactic satellites as determined by Klypin et al. (2000). Thus, if additional gas ejection is significant between and , CDM could indeed underproduce low mass galaxies!
5 Conclusions
We have analyzed the properties of the first bound luminous objects formed in a CDM universe, as calculated in the numerical simulation described in Gnedin (2000ab). This simulation is one of only a few full-scale, non-equilibrium hydrodynamical simulations to date which can individually resolve the components of spheroids in the low mass range comparable to low mass galaxies (see also Nagamine et al. 2001).
We have found that the galaxy mass function at is significantly flatter than the dark matter mass function, whether one considers “galaxies” identified by halos’ stellar particles or gas mass. A flattened low mass end is found for the stellar mass function from , and for the gas mass function at . Taking into account the uncertainties due to the prescription for star formation, at the stellar mass function in a CDM universe is predicted to have a low mass logarithmic slope of or flatter. The reason for these shallower baryonic mass functions is a combination of two effects: (a) the dark matter halo (differential) mass function is consistent with the Press-Schechter formulation at low masses of and (b) heating/cooling and ionization processes appear to cause baryons to collect in halos with the relationship at low masses. Combining (a) and (b) gives , comparable to the simulation results. Thus, the “underabundance” of low luminosity galaxies relative to halos emerges naturally from these results, implying that no “new physics” is necessarily required to understand the low mass end of the galactic mass function. However, because gravitational clustering is still evolving between , when the simulation ends, and the present epoch, it remains to be seen whether CDM with the appropriate astrophysics can be reconciled with the observed clustering properties of low mass galaxies.
References
- Bertschinger and Gelb (1991) Bertschinger, E. and Gelb, J. 1991, Comput. Phys., 5, 164
- Blanton et al. (2000a) Blanton, M., Cen, R., Ostriker, J. P., Strauss, M. A., and Tegmark, M. 2000a, ApJ, 531, 1
- Blanton et al. (2000b) Blanton, M. R. et al. 2000b, preprint (astro-ph/0012085)
- Bode et al. (2001) Bode, P., Ostriker, J. P., and Turok, N., preprint (astro-ph/0010389)
- Bond et al. (1991) Bond, J. R., Cole, S., Efstathiou, G., and Kaiser, N. 1991, ApJ, 379, 440
- Cen and Ostriker (2000) Cen, R. and Ostriker, J. P. 2000, ApJ, 538, 83
- Chiu and Ostriker (2000) Chiu, W. A. and Ostriker, J. P. 2000, ApJ, 534, 507
- Cross et al. (2000) Cross, et al. 2000, preprint (astro-ph/0012165)
- Gnedin (1995) Gnedin, N. Y. 1995, ApJS, 97, 231
- Gnedin (1996) Gnedin, N. Y. 1996, ApJ, 456, 1
- Gnedin and Bertschinger (1996) Gnedin, N. Y. and Bertschinger, E. 1996, ApJ, 486, 581
- Gnedin and Ostriker (1997) Gnedin, N. Y. and Ostriker, J. P. 1997, ApJ, 486, 581
- Gnedin, Norman, and Ostriker (2000) Gnedin, N. Y., Norman, M. L., and Ostriker, J. P. 2000, ApJ, 540, 32
- Gnedin (2000a) Gnedin, N. Y. 2000a, ApJ, 535, 530
- Gnedin (2000b) Gnedin, N. Y. 2000b, ApJ, 542, 535
- Katz (1992) Katz, N. 1992, ApJ, 391, 502
- Katz, Weinberg, and Hernquist (1996) Katz, N., Weinberg, D. H., and Hernquist, L. 1996, ApJS, 105, 1
- Katz, Hernquist, and Weinberg (1999) Katz, N., Hernquist, L., and Weinberg, D. H. 1999, ApJ, 523, 463
- Klypin et al. (2000) Klypin, A. A., Kravtsov, A. V., Valenzuela, O., and Prada, F., ApJ, 522, 82
- Lacey and Cole (1993) Lacey, C. G. and Cole, S. 1993, MNRAS, 262, 627
- Lacey and Cole (1994) Lacey, C. G. and Cole, S. 1994, MNRAS, 271 676
- Li and Ostriker (2000) Li, L.-X. and Ostriker, J. P. 2000, preprint (astro-ph/0010432)
- Lobo and Guiderdoni (1999) Lobo, C. and Guiderdoni, B. 1999, A&A, 345, 712
- Miralda-Escudé (2000) Miralda-Escudé, J. 2000, preprint (astro-ph/0002050)
- Mo and White (1996) Mo, H. J. and White, S. D. M. 1996, MNRAS, 282, 347
- Moore et al. (1999a) Moore, B., Ghigna, S., Governato, F., Lake, G., Quinn, T., Stadel, J., and Tozzi, P. 1999a, ApJ, 524, L19
- Moore et al. (1999b) Moore, B., Quinn, T., Governato, F., Stadel, J., and Lake, G. 1999b, MNRAS, 210, 1147
- Navarro and White (1994) Navarro, J. F. and White, S. D. M. 1994, MNRAS, 267, 401
- Navarro and Steinmetz (1997) Navarro, J. F. and Steinmetz, M. 1997, ApJ, 478, 13
- Navarro and Steinmetz (2000) Navarro, J. F. and Steinmetz, M. 2000, ApJ, 528, 607
- Nagamine et al. (2001) Nagamine, K., Fukugita, M., Cen, R., and Ostriker J.P. 2001, preprint (astro-ph/0102180)
- Ostriker and Gnedin (1996) Ostriker, J. P. and Gnedin, N. Y. 1996, ApJ, 472, L63
- Ostriker and Steinhardt (1995) Ostriker, J. P. and Steinhardt, P. 1995, Nature, Phys. Sci., 377, 600
- Peebles (1999a) Peebles, P. J. E. 1999a, ApJ, 510, 523
- Peebles (1999b) Peebles, P. J. E. 1999b, ApJ, 510, 531
- Press and Schechter (1974) Press, W. H. and Schechter, P. 1974, ApJ, 187, 425
- Sellwood and Kosowsky (2000) Sellwood, J.A. and Kosowsky, A. 2000, preprint (astro-ph/0009074)
- Silk (1977) Silk, J. 1977, ApJ, 211, 638
- Somerville and Primack (1999) Somerville, R. S. and Primack, J. R. 1999, MNRAS, 310, 1087
- Spergel and Steinhardt (2000) Spergel, D. N. and Steinhardt, P. J. 2000, Phys. Rev. Lett., 84, 3760
- Steinmetz and Mueller (1994) Steinmetz, M. and Mueller, E. 1994, A&A, 281, 97
| Redshift | |
|---|---|
| 15 | |
| 7 | |
| 6 | |
| 5 | |
| 4 |