The Stellar Composition of the Star Formation Region CMa R1 – II. Spectroscopic and Photometric Observations of 9 Young Stars††thanks: Based on observations collected at the European Southern Observatory, La Silla, Chile
Abstract
We present new high and low resolution spectroscopic and photometric data of nine members of the young association CMa R1. All the stars have circumstellar dust at some distance as could be expected from their association with reflection nebulosity. Four stars (HD 52721, HD 53367, LkH 220 and LkH 218) show H emission and we argue that they are Herbig Be stars with discs. Our photometric and spectroscopic observations on these stars reveal new characteristics of their variability. We present first interpretations of the variability of HD 52721, HD 53367 and the two LkH stars in terms of a partially eclipsing binary, a magnetic activity cycle and circumstellar dust variations, respectively. The remaining five stars show no clear indications of H emission in their spectra, although their spectral types and ages are comparable with those of HD 52721 and HD 53367. This indicates that the presence of a disc around a star in CMa R1 may depend on the environment of the star. In particular we find that all H emission stars are located at or outside the arc-shaped border of the H ii region, which suggests that the stars inside the arc have lost their discs through evaporation by UV photons from nearby O stars, or from the nearby ( 25 pc) supernova, about 1 Myr ago.
keywords:
circumstellar matter – stars: early type – stars: evolution – stars: pre-main sequence – stars: variables – open clusters and associations: CMa R11 Introduction
Herbst & Assousa (1977) and Herbst, Racine & Warner (1978) found convincing evidence for a scenario in which the formation of the CMa R1 association was induced by a supernova explosion about 1 Myr ago. More recently, Comerón, Torra & Gómez (1998) argued that the star formation was triggered in pre-existing clouds and that it was only accelerated by the supernova shock.
In a preceeding paper (Shevchenko et al. 1999; paper I) we have confirmed that most stars of CMa R1 have not been formed at the same occasion. Our objective of this paper is to present and discuss new optical and ultraviolet spectroscopic and photometric data for nine of its members. A tenth object, Z CMa (HD 53179), has also been observed, but since the interpretation of these data is more complicated, we will present the results separately (paper III). Apart from LkH 220 (B5e) and LkH 218 (B7e), which are close to ZAMS, the observed stars are of spectral type early B and on or above the Main Sequence (MS) with ages much larger than 1 Myr (paper I). It therefore seems useful to inspect their spectroscopic and photometric features in order to detect common characteristics in their atmospheric and circumstellar envelopes.
While most of the stars have been observed before photometrically and spectroscopically (e.g. Herbst et al. 1978; Finkenzeller & Jankovics 1984; Hamann & Persson 1992), the present optical spectra have a resolution which is seven times larger than in the earlier observations and for several stars a large amount of photometric observations has been made during the last decades. In addition we have surveyed information from the high and low resolution UV spectra, obtained by the International Ultraviolet Explorer (IUE). In section 2 we give a survey of the observations. Section 3 describes the results of these and earlier observations. The photometric and spectral variability data of the four emission line stars are discussed and interpreted in section 4. Section 5 summarizes the results and in this section we also make an attempt to understand these results in terms of the location of the stars in the CMa R1 association.
| ESO | |||||
| Star | Range [Å] | Date | JD+2400000 | [mÅ] | [min] |
| HD 52721 | 4200–7800 | 11 Dec. 92 | 48967.7653 | 1076 | 2 |
| 6522–6602 | 11 Dec. 96 | 50428.2279 | 65.6 | 15 | |
| 5849–5920 | 13 Dec. 96 | 50430.1797 | 58.8 | 15 | |
| 3912–3955 | 14 Dec. 96 | 50431.3548 | 39.3 | 15 | |
| 8466–8572 | 15 Dec. 96 | 50432.2681 | 85.2 | 20 | |
| HD 53367 | 4200–7800 | 11 Dec. 92 | 48976.7722 | 1076 | 2 |
| 6536–6590 | 16 Dec. 94 | 49702.3472 | 65.6 | 15 | |
| 6540–6590 | 15 Jan. 95 | 49732.2750 | 65.6 | 20 | |
| 5860–5910 | 16 Dec. 94 | 49702.2125 | 58.8 | 20 | |
| 5860–5910 | 16 Jan. 95 | 49733.2887 | 58.8 | 15 | |
| 3912–3955 | 14 Dec. 96 | 50431.3561 | 39.3 | 15 | |
| 8466–8572 | 15 Dec. 96 | 50432.2354 | 85.2 | 20 | |
| LkH 220 | 6400–8950 | 1 Jan. 94 | 49353.2103 | 1245 | 25 |
| 3600–6800 | 2 Jan. 94 | 49354.3145 | 1563 | 15 | |
| HD 53623 | 5849–5920 | 13 Dec. 96 | 50430.1921 | 58.8 | 20 |
| 6522–6602 | 12 Dec. 96 | 50429.2371 | 65.6 | 20 | |
| HD 53755 | 5849–5920 | 13 Dec. 96 | 50430.1921 | 58.8 | 20 |
| 6522–6602 | 12 Dec. 96 | 50429.2013 | 65.6 | 15 | |
| HD 52942 | 5849–5920 | 14 Dec. 96 | 50431.1600 | 58.8 | 15 |
| 6522–6602 | 12 Dec. 96 | 50429.2208 | 65.6 | 20 | |
| HD 53974 | 5849–5920 | 14 Dec. 96 | 50431.1445 | 58.8 | 20 |
| 6522–6602 | 12 Dec. 96 | 50429.2139 | 65.6 | 7 | |
| HD 54439 | 5849–5920 | 14 Dec. 96 | 50431.1719 | 58.8 | 10 |
| 6522–6602 | 12 Dec. 96 | 50429.1852 | 65.6 | 20 | |
| 5849–5920 | 14 Dec. 96 | 50431.1807 | 58.8 | 25 | |
| SAO | |||||
| Star | Range [Å] | Date | JD+2400000 | [mÅ] | |
| HD 52721 | 3700–4900 | 14 Oct. 89 | 47814. | 200 | |
| 3700–4900 | 15 Oct. 89 | 47815. | 200 | ||
| HD 53367 | 3700–4900 | 15 Oct. 89 | 47815. | 200 | |
| 3700–4900 | 02 Mar. 91 | 48318. | 200 | ||
| IUE high res. | ||||
|---|---|---|---|---|
| Star | SWP | Date | LW | Date |
| HD 52721 | 10592 | 12 Nov. 1980 | R09283 | 12 Nov. 1980 |
| HD 53367 | 38686 | 27 Apr. 1990 | P17816 | 27 Apr. 1990 |
| HD 53755 | 27974 | 21 Mar. 1986 | R02166 | 24 Aug. 1978 |
| HD 53974 | 10580 | 10 Nov. 1980 | R09272 | 10 Nov. 1980 |

2 Observations
High resolution profiles of H, Na i D, He i (5876 Å), Ca ii K and two lines of the Ca ii (2) red triplet for HD 52721 and HD 53367 and of H, Na i D and He i (5876 Å) for HD 52942, HD 53623, HD 53755, HD 53974 and HD 54439 have been secured in 1994, 1995 and 1996 at the European Southern Observatory (ESO), La Silla, Chile with the 1.4 m Coudé Echelle Spectrograph (CES) on the Coudé Auxiliary Telescope (CAT). Low resolution spectra of HD 52721, HD 53367 and LkH 220 were taken in 1992 and 1993 with the Boller and Chivens spectrograph on the 1.5 m telescope at ESO. All spectra were reduced with the usual steps of bias subtraction, flatfielding, background subtraction and spectral extraction, and wavelength and flux calibration. Additional high resolution optical spectra of HD 52721 and HD 53367 were obtained in October 1989 and November 1991 at the Special Astrophysical Observatory (SAO) of the Russian Academy of Sciences with the Main Stellar Spectrograph (MSS) on the 6-m reflector telescope. These spectra were processed on the automatic spidometer and microdensitometer at the Crimean Astrophysical Observatory. Details of all observations are given in Table 1.
Photometric observations of the stars have been made at ESO in various pass-bands ( and Walraven ; optical photometry not published before is given in Table 5) which, together with the IRAS point source fluxes (paper I) and UV fluxes from the ANS and TD1 catalogues (Wesselius et al. 1982; Thompson et al. 1978), permitted us to determine the spectral energy distribution (SED) of each star. For HD 52721 (GU CMa), HD 53367 (V570 Mon), LkH 218 (HT CMa) and LkH 220 (HU CMa) we also constructed the light curves and colour-magnitude diagrams from the photometric sequences obtained by the observers at Van Vleck Observatory (Herbst et al. 1994), at Mt. Maidanak Observatory (Kilyakov & Shevchenko 1976) and at Corralitos Observatory (Halbedel 1989, 1991, 1999). High and low resolution ultraviolet spectra were taken from the Final Reduction Archive of the IUE (processed by NEWSIPS) at the ESA Satellite ground station in Villafranca del Castillo (Madrid).
| Star | Var. Name | Sp. T. | ||||
|---|---|---|---|---|---|---|
| [pc] | [mag] | [km s-1] | [km s-1] | |||
| HD 52721 | GU CMa | B1 Ve | 600 | 6.40–6.80 | 350–450 | +9–+22 |
| B1 IVe | 800 | |||||
| HD 53367 | V750 Mon | B0 IVe | 775 | 6.90–7.20 | 25–50 | +11–+24 |
| B0 IIIe | 1050 | |||||
| LkH 218 | HT CMa | B6 Ve | 900 | 11.61–12.05 | 50 | |
| LkH 220 | HU CMa | B5 Ve | 1090 | 11.60–12.19 | 75 | |
| HD 52942 | FZ CMa | B2 IV | 950 | 8.05–8.44 | 370 | |
| HD 53623 | B1 V | 1150 | 7.93–8.01 | +30 | ||
| HD 53755 | V569 Mon | B0.5 IV | 1010 | 6.40–6.53 | 410 | +16 |
| HD 53974 | FN CMa | B0 II | 1025 | 5.38–5.43 | 150 | +31 |
| HD 54439 | B1 V | 960 | 7.68 | 260 |
3 Spectroscopic Results
3.1 The Photospheres
Spectroscopic classifications from the visual spectral range of the nine stars have been published frequently and are collected in Table 2. For the early B-type stars the photospheric information from the visual spectrum is limited to some lines of Mg ii and He i, which may have resulted in some uncertainties in the spectral classifications. In the UV, however, more purely photospheric lines can be found: He ii (1640 Å), C iii (1247 Å), N iii (1747, 1751 Å), Si iii (1299, 1417 Å) and many lines of Fe iii, Fe iv and Fe v (see e.g. Prinja 1990). In the IUE archive high resolution spectra of four members of CMa R1 are available: HD 52721, HD 53367, HD 53755 and HD 53974. We have compared these spectra with those in the UV spectral atlasses for B star classification by Rountree & Sonneborn (1993) and Snow et al. (1994).
From this comparison we derive the types B1 IV–V for HD 52721 (comp. stars: HD 37303 B1 V with = 260 km s-1 and HD 108483 B2 V with = 245 km s-1), B0 IV,V for HD 53367 (comp. stars: HD 36512 B0 V with = 20 km s-1 and HD 34816 B0.5 IV with = 67 km s-1) and B0.5 III,IV for HD 53755 and HD 53974 (comp. stars: HD 219188 B0.5 III with = 265 km s-1 and Sco (HD 143275) B0.3 IV with = 180 km s-1). In this procedure approximate values of = 400, 30, 410 and 150 km s-1 have been taken into account for the stars HD 52721, HD 53367, HD 53755 and HD 53974 respectively (Uesugi & Fukuda 1976; Finkenzeller 1985; Böhm & Catala 1995). From the high ionization lines in the comparison spectra it also becomes clear that HD 53755 and HD 53974 have fast outflows. Our classifications from the UV spectra are close to those of the spectral and luminosity types from the visual spectra which were obtained earlier. Note that when we use the values of Schmidt-Kaler (1982), these classifications are consistent with a distance of 1 kpc (close to the value of 1050 pc, derived for CMa R1 in paper I).


3.2 The Outer Circumstellar Regions
Let us now inspect the information on the circumstellar dust and gas of the nine stars. Fig. 1 shows the spectral energy distributions (SEDs) of the stars. These distributions are fitted by the calculated Kurucz (1991) model distributions for the spectral and luminosity class of each star, together with the observed . In order to get a good agreement in the visual and UV interval, one has to vary the extinction law, characterised by the value of (the ratio of total absorption in the photometric -band over the colour excess ). The best fitting values of , as well as the stellar parameters used for these fits, are included in Fig. 1.
The colour excess of HD 53367 is exceptionally large compared to those of the other stars in CMa R1. This is also expressed by the 2200 Å absorption in the low resolution UV spectrum of this star, which is much stronger then those in the corresponding spectra of the other stars (Fig. 2). From Fig. 1 it is clear that only for the four H emission line stars HD 52721, HD 53367, LkH 218 and LkH 220 the extinction corrected SED has an excess flux at wavelengths longward 1.58 m. Longward about 4 m, the excess for LkH 218 and LkH 220 increases strongly and can only be explained by thermal re-emission from nearby hot circumstellar dust. For HD 52721 and HD 53367 the infrared excesses longward 4 m are smaller and could be due to the presence of cooler circumstellar dust at larger distances from these stars, or to the contribution of cool stellar companions (see Sect. 4.2). The excesses at shorter wavelengths are much smaller and could be contributed by free-free emission in the inner circumstellar regions (see Sect. 3.3).
In order to find more information about the gas component of the circumstellar medium of the stars we will first discuss the high resolution profiles of the Na i D (Fig. 3) and Ca ii K lines (Fig. 4c). For HD 52721 we find equal displacements (+19 km s-1) and FWHM’s (22 km s-1) for the Ca ii K and Na i D lines. For HD 53367 we find similar values (displaced +17 km s-1 and 24 km s-1) for Ca ii K and Na i D. This indicates that the resonance line of Ca ii is formed in the same region as those of Na i. The shape of the Na i D profiles (Fig. 3) shows the presence of more than one component, which could be contributed by interstellar clouds in the CMa association or else from circumstellar gas. The redshifts of HD 52721 and HD 53367 are within the range of their radial velocity variations (Abt & Biggs 1972). The main components are redshifted by about 19 km s-1 for HD 53974, HD 53755 and HD 54439, which is within the range of the radial velocities measured for the double stars HD 53974 and HD 53755 (Abt & Biggs 1972). For HD 53623 we measure +12 km s-1 for the main (blue) components and +27 km s-1 for the second component. The radial velocity from the literature (Abt & Biggs 1972) is +30 km s-1. There are no indications that this star is a binary. HD 52942 is a double line eclipsing binary with equal mass companions (Moffat & Vogt 1974), but we see only one Na i D doublet in our (noisy) spectrum. The difference in redshift may be hidden by the noise, but the average value (+15 km s-1) can only be understood if the absorption is formed at some distance of the binary system. From the general agreement between the Na i D redshifts and the stellar radial velocities we conclude that the Na i D doublet is formed in the (wide) circumstellar region of the stars. From the EWs of the Na i D doublet lines we can evaluate the column density of the foreground gas with the Strömgren (1948) doublet-ratio method. In Table 3 we give the EWs of the Na i D lines and the derived column densities of Na i D. From (Na i) and by assuming a galactic abundance ratio (H)/(Na i) of we can derive colour excesses for an average interstellar dust/gas ratio with the empirical relation of Hobbs (1974): (Na i) = . The results are listed in column 5 of Table 3 and can be compared with the values of (column 6), derived from the photometric observations by fitting the SEDs. From this comparison it is clear that the interstellar dust gives significantly lower colour excesses than those obtained directly from the photometry (see also Paper I Sect. 3.1). This can be understood if the dust/gas ratio in the circumstellar and intra-association cloud regions is higher than in the general interstellar foreground. From Table 3 we see that this ratio will be especially high for HD 53367.
| Star | EW (Na D1) | EW2/EW1 | |||
|---|---|---|---|---|---|
| HD 52721 | 0.308 | 1.32 | 12.72 | 0.145 | 0.28 |
| HD 52942 | 0.393 | 1.18 | 13.05 | 0.222 | 0.42 |
| HD 53367 | 0.461 | 1.17 | 13.18 | 0.259 | 0.72 |
| HD 53623 | 0.375 | 1.30 | 12.84 | 0.170 | 0.22 |
| HD 53755 | 0.311 | 1.24 | 12.85 | 0.171 | 0.21 |
| HD 53974 | 0.410 | 1.22 | 13.07 | 0.226 | 0.34 |
| HD 54439 | 0.399 | 1.21 | 13.00 | 0.207 | 0.31 |
| LkH 218† | 0.117 | 1.23 | 12.42 | 0.098 | 0.57 |
| LkH 220† | 0.141 | 1.03 | 13.71 | 0.513 | 0.43 |
We have inspected the high resolution IUE spectra of HD 52721, HD 53367, HD 53755 and HD 53974. In these spectra one finds a large number of narrow lines with zero excitation energy of their lower levels, which will be formed in the interstellar foreground: e.g. at 2851 Å (Mg i (1)), 2026 Å (Mg i (2)), 2795 Å, 2802 Å ((Mg ii (1)), 2593 Å (Mn ii (1)), 2585 Å (Fe ii (1)), 2382 Å (Fe ii (2)), 1526 Å (Si ii (2)). In contrast, the number of low excitation lines in these spectra is small and these lines are very weak. We note that only a few lines (2550.8 Å of Fe ii (240), 2556.6 Å of Mn (20), 2666.6 Å of Fe ii (263) and 2724.5 Å of Mn ii (33)) with lower levels up to 3.5 eV are present in the spectra of HD 52721 and HD 53974 but are missing in those of HD 53367 and HD 53755. Since the latter two stars are not far apart from each other in CMa R1, their common lack of these low excitation lines could be due to the conditions in their common foreground interstellar clouds. The scarceness and weakness of the low excitation lines indicate that the four stars which we inspected in the UV have only a very small amount of circumstellar gas, which is consistent with the high dust/gas ratio in the circumstellar region. Only one of the stars, HD 53367, shows the possible presence of the Mg ii (3) doublet (2790.77 and 2797.99 Å) in one of its spectra.

| Star | [Å] | Line | EW [Å] | Error [Å] | FWHM [km s-1] | Date | Ref. |
|---|---|---|---|---|---|---|---|
| HD 52721 | 3933.6 | Ca ii K | +0.14 | 0.03 | 25 | 14 Dec. 1996 | This paper |
| 5875.6 | He i | +0.67 | 0.10 | 490 | 13 Dec. 1996 | This paper | |
| 6562.8 | H | 5.2 | 330 | 14 Nov. 1981 | Finkenzeller & Mundt (1984) | ||
| 6562.8 | H | 9.4 | 31 Jan. 1983 | Andrillat (1983) | |||
| 6562.8 | H | 10–14 | 300 | 4–9 Mar. 1985 | Praderie et al. (1991) | ||
| 6562.8 | H | 8.8 | 23 Dec. 1991 | Corcoran & Ray (1998) | |||
| 6562.8 | H | 14 | 11 Jan. 1995 | Oudmaijer & Drew (1999) | |||
| 6562.8 | H | 9.9 | 0.15 | 11 Dec. 1996 | This paper | ||
| 7773 | O i | 0.24 | 311 | Dec. 1987 | Hamann & Persson (1992) | ||
| 8446.5 | O i | 2.06 | Dec. 1987 | Hamann & Persson (1992) | |||
| 8465 | P17 | 0.35 | 335 | 22 Jan. 1983 | Andrillat et al. (1988) | ||
| 8498.02 | Ca ii (2) | 0.46 | 0.07 | 225 | 15 Dec. 1996 | This paper | |
| 8502.49 | P16 | 0.34 | 0.06 | 225 | 15 Dec. 1996 | This paper | |
| 8500 | Ca ii + P16 | 0.72 | 22 Jan. 1983 | Andrillat et al. (1988) | |||
| 8542.09 | Ca ii (2) | 0.75 | 0.10 | 225 | 15 Dec. 1996 | This paper | |
| 8548.39 | P15 | 0.37 | 0.07 | 225 | 15 Dec. 1996 | This paper | |
| 8545 | Ca ii + P15 | 0.55 | 22 Jan. 1983 | Andrillat et al. (1988) | |||
| 8598 | P14 | 0.35 | 22 Jan. 1983 | Andrillat et al. (1988) | |||
| HD 53367 | 3933.6 | Ca ii K | +0.19 | 0.06 | 25 | 14 Dec. 1996 | This paper |
| 5875.6 | He i | +0.34 | 0.03 | 121 | 16 Dec. 1994 | This paper | |
| 5875.6 | He i | 0.03 | 0.01 | 70 | 16 Dec. 1994 | This paper | |
| 5875.6 | He i | +0.37 | 0.04 | 91 | 16 Jan. 1995 | This paper | |
| 5875.6 | He i | 0.07 | 0.03 | 66 | 16 Jan. 1995 | This paper | |
| 5875.7 | He i | +0.42 | 70: | 14 Nov. 1981 | Finkenzeller & Mundt (1984) | ||
| 6562.8 | H | 19.4 | 300 | 1974 | Garrison & Anderson (1977) | ||
| 6562.8 | H | 14 | 22 Oct. 1981 | Andrillat (1983) | |||
| 6562.8 | H | 11 | 210 | 14 Nov. 1981 | Finkenzeller & Mundt (1984) | ||
| 6562.8 | H | 14.3 | 340 | 20 Nov. 1987 | Halbedel (1989) | ||
| 6562.8 | H | 16.2 | 325 | Dec. 1987 | Hamann & Persson (1992) | ||
| 6562.8 | H | 5.0 | 1 Jan. 1992 | Corcoran & Ray (1998) | |||
| 6562.8 | H | 6.1 | 0.12 | 250 | 16 Dec. 1994 | This paper | |
| 6562.8 | H | 6.1 | 0.12 | 250 | 15 Jan. 1995 | This paper | |
| 6562.8 | H | 14 | 1 Jan. 1997 | Oudmaijer & Drew (1999) | |||
| 7773 | O i | 0.37 | 424 | Dec. 1987 | Hamann & Persson (1992) | ||
| 8446.5 | O i | 2.68 | Dec. 1987 | Hamann & Persson (1992) | |||
| 8465 | P17 | 1.11 | 22 Jan. 1983 | Andrillat et al. (1988) | |||
| 8498.02 | Ca ii (2) | 0.83 | 0.08 | 210 | 15 Dec. 1996 | This paper | |
| 8502.49 | P16 | 0.53 | 0.05 | 210 | 15 Dec. 1996 | This paper | |
| 8500 | Ca ii + P16 | 1.58 | 22 Jan. 1983 | Andrillat et al. (1988) | |||
| 8542.09 | Ca ii (2) | 1.16 | 0.12 | 210 | 15 Dec. 1996 | This paper | |
| 8548.39 | P15 | 0.74 | 0.07 | 210 | 15 Dec. 1996 | This paper | |
| 8545 | Ca ii + P15 | 1.34 | 22 Jan. 1983 | Andrillat et al. (1988) | |||
| 8598 | P14 | 1.54 | 22 Jan. 1983 | Andrillat et al. (1988) | |||
| LkH 218 | 6562.8 | H | 24.4 | 14 Jan. 1977 | Cohen & Kuhi (1979) | ||
| 6562.8 | H | 19 | 0.5 | 300 | 14 Nov. 1981 | Finkenzeller & Mundt (1984) | |
| 6562.8 | H | 26 | 1.3 | 30 Jan. 1986 | Böhm & Catala (1995) | ||
| 6562.8 | H | 32 | 25 Dec. 1991 | Corcoran & Ray (1998) | |||
| 6562.8 | H | 20 | 31 Dec. 1996 | Oudmaijer & Drew (1999) | |||
| 8545 | Ca ii + P15 | 2.1 | 0.4 | 30 Jan. 1986 | Böhm & Catala (1993) | ||
| LkH 220 | 6562.8 | H | 52.5 | 14 Jan. 1977 | Cohen & Kuhi (1979) | ||
| 6562.8 | H | 35 | 0.5 | 280 | 14 Nov. 1981 | Finkenzeller & Mundt (1984) | |
| 6562.8 | H | 67 | 3.3 | 30 Jan. 1986 | Böhm & Catala (1995) | ||
| 6562.8 | H | 74 | 0.7 | 300 | 1 Jan. 1994 | This paper | |
| 8446.5 | O i | 3.3 | 0.3: | 250: | 1 Jan. 1994 | This paper | |
| 8465 | P17 | 0.70 | 0.3: | 330: | 1 Jan. 1994 | This paper | |
| 8500 | Ca ii + P16 | 0.98 | 0.3: | 350: | 1 Jan. 1994 | This paper | |
| 8545 | Ca ii + P15 | 1.80 | 0.3: | 350: | 1 Jan. 1994 | This paper | |
| 8598 | P14 | 1.28 | 0.3: | 350: | 1 Jan. 1994 | This paper | |
| 8662 | Ca ii + P13 | 1.75 | 0.3: | 400: | 1 Jan. 1994 | This paper | |
| 8750 | P12 | 1.50 | 0.3: | 420: | 1 Jan. 1994 | This paper | |
| 8862 | P11 | 2.00 | 0.3: | 430: | 1 Jan. 1994 | This paper |
3.3 The Inner Circumstellar Regions
3.3.1 The B-emission line stars: HD 52721, HD 53367, LkH 218 and LkH 220
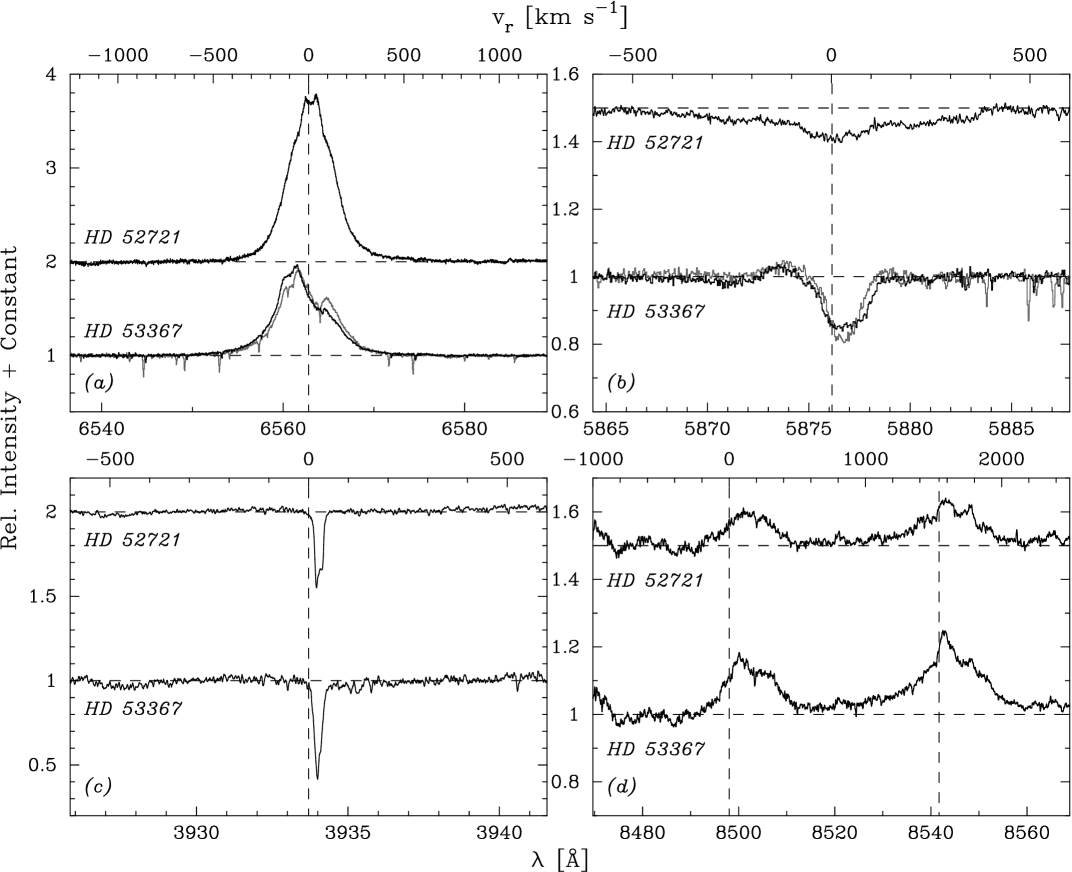
Of special interest are the emission lines of H (Fig. 4a), the red Ca ii (2) lines (Fig. 4d) and the emission component in the He i lines in the visual range of the spectra of HD 52721 and HD 53367 (Fig. 4b). In high resolution, H shows emission profiles (Fig. 4a) which are symmetrical for HD 52721 and asymmetrical (distorted by a red-shifted absorption component) for HD 53367. For the first star the shape does not vary much on short (days) and long (yrs) timescales (see Sect. 4). For HD 53367 small shape variations in the red wing occur on time-scales of one month or less (Fig. 4a) and large shape variations over the whole profile occur over time-scales of years. Because of its very low ( 30 km s-1) we could correct the H profile of HD 53367 for its underlying photospheric profile (assumed to be that of a Kurucz model H profile for = 30,000 K and = 3.5) and conclude that the outflow velocity is 100–150 km s-1.
For HD 52721 with its large (350–400 km s-1) we have no comparison profile, but the observed profile indicates that the outflow velocity of this star is less than 100 km s-1. The parameters of H of the four stars are given in Table 4, which shows that they are variable in time. For HD 53367 we measured an EW of 6.1 Å, which strongly differs from 14.0 Å (Andrillat 1983) and 16.2 Å (Hamann & Persson 1992), but is close to the 5.0 Å, measured by Corcoran & Ray (1998) for their profile of Jan. 1, 1992. We measure a FWHM of 260 km s-1 for HD 52721 and 280 km s-1 (or 310 km s-1 if we account for the presence of an absorption component) for HD 53367. For LkH 218 and LkH 220, emission profiles of H on Nov. 15, 1981 have been presented by Finkenzeller & Mundt (1984). These profiles have double peaked shapes with blue-shifted ( 70 km s-1) absorptions. The variability of H is further discussed in Sect. 4.
For HD 52721 and HD 53367 we have derived volume emission measures from the fill-in of the Balmer discontinuity by bound-free and free-free emission in the circumstellar envelope. This fill-in could be determined by comparing the Balmer jump, derived from photometric observations on the Walraven system (which has two pass bands shortward and two passbands longward the Balmer limit at 3704 Å), with the model-predicted Balmer discontinuity (e.g. from the non-LTE models of Mihalas). The observed Walraven magnitudes and the derived Balmer fill-in are given in Table 5. With the method of Garrison (1978) and the assumption that 10,000 K, we then derive volume emission measures = of cm-5 for HD 52721 and cm-5 for HD 53367. If we assume an electron density of cm-3 in the circumstellar envelope region close to the stars we estimate with the formula of Garrison (1978) that the mass outflow in the circumstellar envelope close to the star is M⊙ yr-1 for HD 52721 and M⊙ yr-1 for HD 53367.
| HD 52721 | HD 53367 | |
| Date | May 1990 | 25 Jan. 1981 |
| 0.153 0.002 | 0.002 0.002 | |
| 0.036 0.002 | 0.202 0.002 | |
| 0.018 0.002 | 0.055 0.002 | |
| 0.016 0.003 | 0.043 0.003 | |
| 0.027 0.003 | 0.146 0.003 | |
| [mag] | 6.48 | 6.90 |
| [mag] | 0.24 | 0.30 |
| EM [cm5] | ||
| [km s-1] | 100 | 140 |
| [M⊙ yr-1] |
The high resolution profiles of the emission lines at 8500 and 8543 Å (Fig. 4d) allow us to separate the 8498.02 and 8542.09 Å lines of the Ca ii (2) triplet from the partly blended Paschen lines P16 (8502.49 Å) and P15 (8548.39 Å). As a result of the blending, the peaks are slightly shifted. For HD 52721 we have decomposed the profiles into two components with a FWHM of 225 km s-1 each, which gives us EW(P16) = 0.34 Å, EW(Ca ii 8498) = 0.46 Å, EW(P15)= 0.37 Å and EW(Ca ii 8542) = 0.75 Å. Together we have 0.80 Å for the 8500 profile and 1.12 Å for the 8543 profile, compared with 0.72 Å and 0.55 Å determined by Andrillat, Jaschek & Jaschek (1988). Note that these authors give an EW of 0.35 Å to both unblended P14 (8598 Å) and P17 (8465 Å) lines. We therefore may expect a similar EW for P15 and P16, which is very close to our results above. The EWs of the blended lines quoted by Andrillat et al. differ from our values in Table 4, which may indicate a variability of the Ca ii (2) fluxes.
For HD 53367 we made similar decompositions with FWHM values of 205 km s-1. This gives EW(P16) = 0.56 Å, EW(Ca ii 8498) = 0.83 Å, EW(P15) = 0.74 Å and EW(Ca ii 8542) = 1.16 Å. Andrillat et al. (1988) give EW(P14) = 1.54 Å and EW(P17) = 1.11 Å for this star. This is consistent with our result above that the EW of H in 1992 was very low (much smaller than in Oct. 1981). The blended lines at 8500 and 8543 Å were observed by Andrillat et al. in Jan. 1983. Our most important conclusion from the high resolution profiles of HD 52721 and HD 53367 is that the emission of the Ca ii (2) lines is significant and has a FWHM of the order of 210 km s-1. Parameters of the Ca ii lines are collected in Table 4.
Since Ca ii cannot exist at the stellar photosphere the emission of Ca ii (2) must originate from the envelope region. Hamann & Persson (1992) have given arguments for the presence of discs around Herbig Ae/Be stars with H and Ca ii emission. For early B-type stars these discs are probably very similar to those of classical Be stars. The FWHM’s of the Ca ii (2) lines suggest that Ca ii (2) is emitted in an outer region of a circumstellar disc (at a Kepler radius of 29 R⋆ for HD 53367 and 17.2 R⋆ for HD 52721), whereas the H emission could come from a region of the disc which is somewhat closer to the star (at a Kepler radius of 13.5 R⋆ for HD 53367 and 12.4 R⋆ for HD 52721). Here we have implicitly assumed that both star-discs are being observed more or less edge-on. It is interesting to note that the low resolution red spectrum of LkH 220 (Fig. 5) also shows the presence of strong emission in the Ca ii (2) triplet.
The profiles of the O i emission lines for HD 52721 and HD 53367 in the red part of the spectrum have been observed by Hamann & Persson (1992). The emission profiles of these lines are weak and broad (Fig. 3 in their paper) and only the widths of the blended 8446 Å Oi (4) line could be estimated (FWHM of 300 km s-1). The authors report EWs of 0.24 Å and 0.37 Å for the unblended triplet O i (1) line (7773 Å) of HD 52721 and HD 53367 respectively and 2.06 Å and 2.68 Å for the blended O i (4) line (8446 Å) of HD 52721 and HD 53367 respectively. The 8446 Å O i (4) emission is much stronger than that of the 7773 Å line, which cannot completely be explained by the blend with P18 (8437 Å). This O i (4) emission is common in classical Be stars and probably due to pumping of the state of O i by Ly (Bowen 1947). The fact that the 1302 Å O i (2) line is in absorption, while for the same stars the O i (4) transition, which feeds the 1302 Å transition, is in emission has led Oegerle, Peters & Polidan (1983) to argue that because the optical depth of line scattering in the resonance 1302 Å line is much larger than in the subordinate 8446 Å line, the 1304 Å photons could be scattered out the line-of-sight in equatorially viewed flattened Be envelopes. It would suggest that the O i emission is coming from flattened discs around HD 52721 and HD 53367 and that both discs are viewed edge-on. This suggestion seems to be confirmed by recent H polarization measurements (Oudmaijer & Drew 1999) of HD 53367 which indicate that this star is not observed pole-on. In the low resolution red spectrum of LkH 220 (Fig. 5) we can distinguish the emission in O i (1) at 7773 Å, and that in O i (4) at 8446.5 Å, slightly blended with P18.
The He i (5876 Å) absorption profile of HD 52721 (Fig. 4b) is very broad with a FWHM of 450 km s-1, approximately the same as for the He i lines at 4026 and 4471 Å in the spectrum of this star, obtained by Finkenzeller & Mundt (1984). This large width probably reflects the photospheric origin of these He i lines in this fast rotating star. Inside the line profile of the 5876 Å line a weak emission component can be seen at both sides of the line centre.The He i 6678 Å profiles of this star (Corporon & Lagrange 1999) also have such an emission component, which shows variability in strength on a time-scale of less than one day. Such emission components have been observed more often in the He i lines of B and Be stars and have been interpreted as CQE’s (central quasi-emission peaks), reduced absorption which can occur when the stellar disc is occulted by circumstellar gas moving in Kepler rotation around the star and when we observe the circumstellar disc edge-on (Hanuschik 1995). It has been emphasized by Rivinius, Stefl & Baade (1999) that such features develop in the inner regions of circumstellar discs and are an indication of gas transfer from the star to the disc. In HD 52721 the high rotational line broadening will prevent that such CQE’s are observed in the weaker metal lines. For this star, however, an interpretation of the feature in terms of a tidal effect due to the nearby companion (see Sect. 4) should also be considered. This should be checked by taking spectra at different phases of the binary motion.
The He i lines of HD 53367 have photospheric absorption profiles with an average FWHM of 150 km s-1. In the 5876 Å line profiles (Fig. 4b) we observe the presence of an emission component, with a blue-shift of 150 km s-1 with respect to the line centre. The profile of Jan. 16, 1995 shows somewhat larger emission and deeper absorption components than that, taken 31 days before. These components are also clearly present in the corresponding profiles for HD 53367 and perhaps LkH 220 obtained by Finkenzeller & Mundt (1984) in Nov. 1981. The emission and absorption components of this line seem to vary in time (see Table 4). Inspection of the He i 6678 Å profiles of HD 53367 (Corporon & Lagrange 1999) show variability on time-scales of less than 26 days, which could partly be due to radial velocity variations with a probable (binary) period of 166 days but changes in the width of this absorption profile suggest also here the presence of a variable emission component. Because the binary parameters suggest a large separation of the companions the variations can not be due to tidal interactions. Since the emission feature in the profile of the 5876 Å line is not in the centre of the line we think it cannot be interpreted as a CQE, but the blue-shift of the emission suggests a hot plasma flowing from the photosphere to the inner circumstellar disc. We should add here that the profile of the photospheric He ii 1640 Å line also shows indications for the presence of blue-shifted ( 150 km s-1) emission. The parameters of the profiles of the H, He i (5876 Å), Na i D and Ca ii (2) lines of HD 52721 and HD 53367 are collected in Table 4.
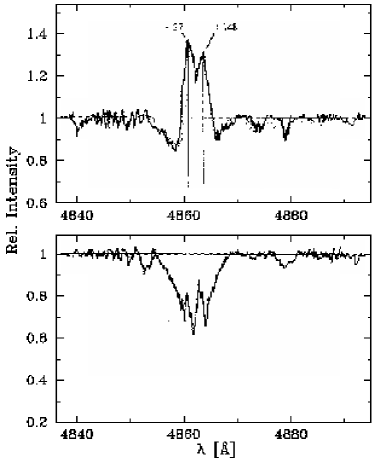
The profiles of several other lines in the spectrum of HD 52721 (H, He i (3888.6, 3964.7, 4437.9, 4471.5 Å), H, and Ca ii H and Ca ii K) are shown in Fig. 6. For H we find an EW of 3.60 0.06 Å, or 3.96 0.04 Å, if we correct for a small contribution of emission in the line centre. This can be compared with an EW of 3.0 Å, estimated from the spectrum of Finkenzeller & Jankovics obtained on Feb. 18, 1981. The value of the EW of H is consistent with the prediction of the Kurucz model for = 25,000 K and = 4.0 (B1 IV), which supports the classification of Table 2.
In Fig. 5 we show the low resolution spectra of the H emission stars HD 52721, HD 53367 and LkH 220. The latter star has the strongest emission in H and H, but a good comparison is difficult, since the three stars are variable in emission. The blue low resolution spectra of HD 52721 and HD 53367 are similar to the spectra of these stars which were obtained by Finkenzeller & Jankovics (1984) with higher resolution. Their main absorption lines are those of He i as expected for these early B spectral types. Comparison of the higher resolution blue spectrum of HD 53367 published by Finkenzeller & Jankovics (1984) with that of the spectrum of Sco (B0 V) in the same paper, shows faint absorption lines of O ii (2), (5), (6), (10) and a faint line of Si iv (1) at 4116 Å, which also occur in the spectrum of Sco, and therefore probably are formed in the photosphere. The presence of such faint lines cannot be verified in the spectrum of HD 52721, because of the broadening of these lines in this fast-rotating star. In contrast to the blue spectra of HD 52721 and HD 53367, that of LkH 220 (B5 V) shows emission in the photospheric Fe ii (42) lines at 4923.9, 5018.4 and 5169.0 Å (B0 with 30,000 K is too hot for Fe ii). The He i lines at 5876 and 6678 Å and the Na i D lines are dominated by absorption, as well as the Ca i lines at 4026 and 4435 Å and those of probably Mg ii (4481 Å) and Ti ii (4469 Å). There is a weak indication of emission of [O i] (6300 Å), also observed by Böhm & Catala (1995). The low resolution blue spectra of LkH 220 and LkH 218, taken by Cohen & Kuhi (1979) on Jan. 14, 1977 show no clear lines except the Balmer and Na i D lines. In these spectra the H emission of LkH 220 is stronger than that of LkH 218. In the red spectrum of LkH 220 (Fig. 5) one can distinguish the 7774 Å and 8446 Å lines of O i (1) in emission. The EW of the unblended 7774 Å line is 0.6 Å, compared with +0.6 Å for a standard B5 IV–V star (Fig. 2 of Slettebak 1986). As for HD 52721 and HD 53367, the red triplet of Ca ii (2) of LkH 220 is in emission and blended with emission from P13, P15 and P16 (see insert of Fig. 5). In this spectrum the emission flux of the unblended Paschen lines is decreasing from a strong P11 emission at 8863 Å to a very weak emission in the P17 line.

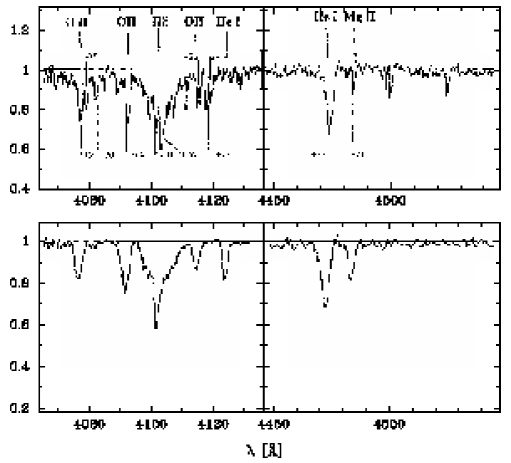
In the high resolution IUE spectra most of the UV lines are formed in the photospheres and the cooler parts of the inner circumstellar region. The profiles of the Si iv resonance lines have blue wings extending up to 530 km s-1 for HD 52721 and up to 470 km s-1 for HD 53367 (Fig. 8). Those of the C iv resonance lines extend up to 340 km s-1 for HD 52721 and to 370 km s-1 for HD 53367. These lines are formed in outflowing winds, accelerated in the circumstellar envelope.
3.3.2 The B stars: HD 52942, HD 53623, HD 53755, HD 53974 and HD 54439
From the Walraven photometry (Thé, Wesselius & Janssen 1986) we measured the fill-in of the Balmer discontinuity of HD 53755 and HD 53974 and found values of of 0.15 and 0.20 mag respectively. The lack of H emission in the former two stars must therefore be due to a much lower ( 10,000 K) and consequently a much lower emission measure for the inner circumstellar envelope of the stars. This temperature may be too low to populate the upper level of the Balmer series.
For the five B stars, in which H is in absorption, there is a certain similarity in profile shape between H (Fig. 9a) and He i (5867 Å) (Fig. 9b). This suggests that H, similar to He i (5867 Å), is formed in the photosphere of these stars. The profile parameters (EW and FWHM) of H and He i for the five stars are given in Table 6. A comparison with the EWs of H predicted by Kurucz models shows a general agreement with the UV spectral classification of Table 2. In the spectrum of HD 53623 both lines show a narrow, deep and symmetrical central absorption core. Since this object is a single star, it suggests that this central component is formed in a shell. The FWHM of the shell component of H is 40 km s-1 and that of the He i line is 60 km s-1.
Apart from this shell component in the H and He i profiles of HD 53623 there is a similarity between the He i profiles of HD 53623, HD 53755 and HD 52721 and also between the H profiles of the first two stars. This is especially expressed by the similarity in their half-widths and probably also by their values of . If we lay the corresponding profiles on top of each other we observe differences in central depth. Since the spectral types of these stars are comparable it is conceivable that (similar to HD 52721) the H and He i profiles of HD 53623 have emission components with respect to those of HD 53755. There is also some similarity between the line profiles of HD 53974 (FN CMa) and HD 54439, but the centre of the He i line of HD 53974 is deeper than that of HD 54439, which could be due to a difference in luminosity type or in the contribution of an emission component for HD 54439. We shall return to this point in the discussion (Sect. 5).
The H profile of HD 52942 (FZ CMa) is very broad and has a core which can either be double or filled in by emission. The double nature of the profile seems most probable, since the object is a double-line eclipsing binary with a period of 1.27 days (Moffat & Vogt 1974) with a maximum radial velocity separation of 342 km s-1 (at phase 0.25 and 0.75). From the ephemeris of Moffat & Vogt we conclude that our spectrum was taken at phase 0.635 from the primary minimum. The separation of the H components in our spectrum is 200 km s-1, which is compatible with this phase.
Most of the UV lines are formed in the photospheres and cool circumstellar regions of these stars. The profiles of the Si iv and C iv resonance lines are asymmetrical and their blue wings extend to velocities of 1600 km s-1 (Fig. 8; for HD 53974 see also Friend, 1990). This gives evidence for fast outflowing winds from these stars. Accretion discs can not accelerate the winds to such high velocities so that there must be a different driving mechanism for the winds of these stars.
4 Variability


| Line | HD 53755 | HD 53974 | HD 54439 | HD 53623 | HD 52942 |
|---|---|---|---|---|---|
| H | |||||
| EW [Å] | 3.02 0.11 | 2.54 0.18 | 3.56 0.10 | 4.75 0.06 | 3.71 0.12 |
| EW* [Å] | 3.21 0.09 | 3.70 0.19 | |||
| EW** [Å] | 4.34 0.12 | ||||
| FWHM [km s-1] | 480 | 280 | 320 | 460 | 807 |
| FWHM* [km s-1] | 420 | 285 | |||
| -mod. | 25,000 | 30,000 | 25,000 | 25,000 | 20,000 |
| -mod. | 3.9 | 4.0 | 4.14 | 4.43 | 3.59 |
| Sp. class | B1 IV | B0 IV | B1 IV/V | B1 V | B2 IV |
| He i (5875.6 Å) | |||||
| EW [Å] | 1.03 0.10 | 1.06 0.07 | 0.76 0.05 | 0.84 0.05 | – |
| EW* [Å] | 1.22 0.07 | ||||
| EW** [Å] | 0.37 0.06 | ||||
| FWHM [km s-1] | 400 | 200 | 210 | 250: | |
| FWHM* [km s-1] | 435 |
We shall discuss here the photometric variability of the four Be stars and some first attempts to interpret the variations.
4.1 HD 52721 (GU CMa)
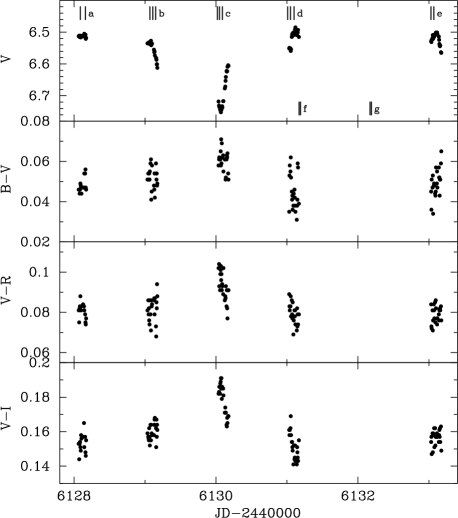
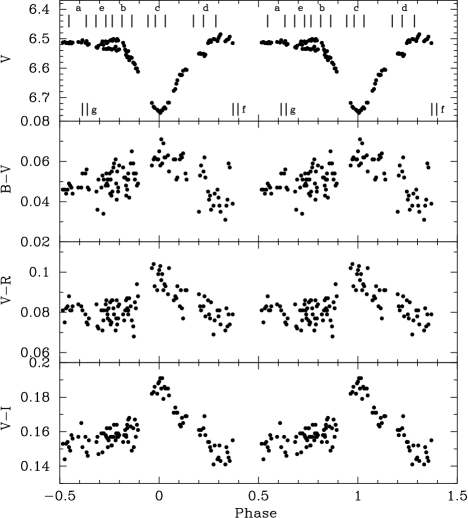
This star is a visual binary (ADS 5713) with a separation of 0.65′′ and = 0.95 mag. The Hipparcos photometry (ESA 1997) is consistent with a period of 1.61037 days. During the period 1987–1998 extensive photometry (320 observations over 12 seasons) of this star was collected at Mt. Maidanak (Uzbekistan) in the framework of the ROTOR photometric program. The light-curve over 10 years does not show clear ( 0.1 mag) indications of long-term variations of upper and lower limits in . The results of a period search on these data has recently been published (Ezhkova 1999). Two periods with equal probability were found: 1.610158 and 0.80508 days. For the shortest period the date of the minimum is given by: = 2447018.115 + 0.80508 E days. Earlier monitoring of HD 52721 in during 5 nights (107 observations) in 1985 (Praderie et al. 1991) appear to be in excellent agreement with these results (Fig. 10). From the photometric data of 1985 we derived the extinction corrected fluxes at maximum and minimum brightness and compared the variations with the corresponding intrinsic fluxes of the Kurucz model. It appears that the flux variations from maximum to minimum brightness correspond roughly with a change in from 25,000 K (B1 V) to 22,500 K (B1.5 V). The simultaneously obtained high resolution H profiles (at phases a, b, c, d and e in Fig. 10) show no difference in shape but a 40% increase in EW at photospheric minimum c (Praderie et al. 1991). Several interpretations of this periodicity may be considered:
a. An eclipsing binary system. The light curve for the longest period is consistent with a binary system with two components with equal radii and effective temperatures. However, the radial velocities of the He i 5875Å line in a sequence of 0.7 Å resolution spectra of HD 52721, taken in 1991 over a period of several weeks with the main spectrograph on the 6-m SAO telescope, show variations with an amplitude not larger than 20 km s-1, which is 10–15 times smaller than expected for such a system with components of equal mass (5–10 M⊙). The radial velocity variations in the profiles of He I 6678 Å, observed by Corporon & Lagrange (1999) are consistent with the SAO data. However, if the mass of the secondary is at least five times smaller than that of the primary component, an upper limit of 30 km s-1 is not in conflict with the shorter period of 0.80508 days. In this case we do not observe a secondary minimum in the visual light curve because the eclipse is only partial. Further support for the hypothesis that we are dealing with a secondary that is much less massive than the primary comes from the observation that the colours of the system become slightly redder at minimum brightness (Fig. 10). With a distance of 1050 pc and = 25,000 K we derive a luminosity of L⊙ and a radius of 7.1 R⊙ for HD 52721. From theoretical evolutionary models (Schaller et al. 1992) we then estimate that the mass of the primary should be close to 12 M⊙. The orbital distance is then 9 R⊙, which is large enough to accommodate a 1 M⊙ secondary star. We estimate that the secondary could be a K0 star (if its age is not much larger then that of the primary).
b. A pulsation instability. In the HR diagram HD 52721 is situated close to the predicted border of the Cep instability zone for masses 10–12 M⊙ (Pamyatnykh 1999). The pulsation periods predicted by the model depend on various input surface parameters such as hydrogen and metal abundances and rotation. For a mass of 12 M⊙ and = 4.35 (B1.5 V), solar abundances and no rotation, pulsations with periods between 0.4 and 1.6–2.0 days are possible in the second order mode ( = 2). For = 4.3 (B2 V), the period can range from 0.8 up to 2.4 days. Both measured periods are in this range. It is not clear if the magnitude of the photometric and line profile (H and He i) variations can be explained by these pulsation models.
4.2 HD 53367 (V750 Mon)
HD 53367 is a visual binary with a separation of 065, a magnitude difference of 1.41 mag and a position angle of 298∘ (ESA 1997). HD 53367 is also a spectroscopic binary (Finkenzeller & Mundt 1984). The main component shows radial velocity variations in the He i 4471, 5876 and 6678 Å lines, which can be fitted with a period of 166 days and an amplitude of about 20 km s-1 around an average velocity of +48.2 km s-1. A possible orbital solution has = 0.18 and = 303∘ (Corporon & Lagrange 1999).
HD 53367 shows a low (20–40 km s-1). There are several indications that this is not due to a small inclination, i.e. that we are not observing the star pole-on. One indication is the observation by Oudmaijer & Drew (1999) of the variation of the linear polarization percentage over the H profile of HD 53367, which suggests that the ionized envelope, projected on the sky, is not observed as a circular disc as expected in case the star is observed pole-on. Another indication against a pole-on view of HD 53367 has been given by Oegerle et al. (1983). These authors argued that the simultaneous occurrence of emission in the 8446 Å O i line and absorption in the 1302 Å O i line can only be understood if the star has an envelope, which is observed at large inclination with the polar axis (see also Sect. 3.3.1).
Apart from its velocity variations, HD 53367 also shows photometric variability. Hipparcos observed an amplitude of 0.24 mag, but no period is given (ESA 1997). However, over a longer interval than these Hipparcos observations, the photometry of the ROTOR group, the Wesleyan Observatory and the Corralitos Observatory suggests a mean periodic variation with a period of about 9 years with an amplitude of about 0.3 mag (Fig. 11). The colour-magnitude diagram of HD 53367 shows that the colours are bluer at minimum brightness. Nevertheless after correction of the fluxes for extinction it appears that in the minimum phase the photospheric temperature has decreased from 30,000 K to about 25,000 K.
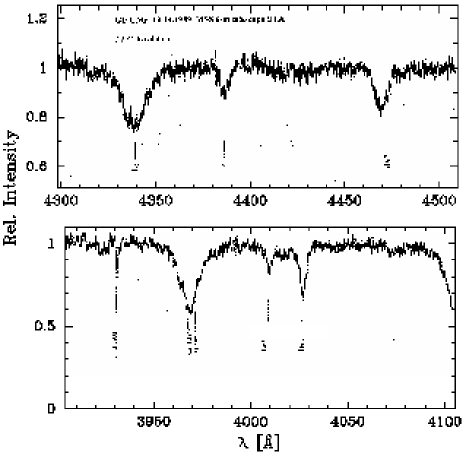
At minimum brightness (Oct. 15, 1989) and at maximum brightness (March 2, 1991) high resolution spectra have been taken with the Main Stellar Spectrograph on the 6-m BTA telescope of the SAO (Fig. 7). They show that in the minimum phase the emission component in all the lines is weaker than in the maximum brightness phase. The emission of H at minimum brightness is very faint. This could be related with variations in the H profile, reported by Halbedel (1989), but the time-scale of these profile variations is not known yet, except for small changes in H after 1 month (Fig. 4a). H profiles of May–Dec. 1974 (Garrison & Anderson 1977), July 1981 (Finkenzeller & Mundt 1984), 1983 (Andrillat 1983), June 1986 (Hamann & Persson 1992), Nov. 1987 (Halbedel 1989) and our observations of Dec. 1994 and Jan. 1995 (Fig. 4a) show differences, although they are small. However, the EWs of H show a strong decrease between Dec. 1987 and Jan. 1992 (Table 4), a period for which no H line profile information is available. For H (Fig. 5), the contribution of emission to the profile is small. We find an EW of 3.31 0.08 Å for H in 1991 and 3.73 0.16 Å for this line in 1989. These values are consistent with the predictions of Kurucz models for = 30,000 K, = 4.25 (B0 IV) or 25,000 K and = 3.75 (B0 III/IV).

It may be noted here that HD 53367 is not the only young Be star with a long photometric period. Another early type Herbig Be star, BD+65∘1637 shows a similar behaviour, with a period of at least 15 years. It is to be expected that more long periodicity young variables will be detected when the photometric observations are prolonged. We can think of several possible causes for such long photometric periods:
a. Magnetic activity of a B star. Little is known about the magnetic fields of early type B-stars. The intrinsic continuum polarization HD 53367, observed by Oudmaijer & Drew (1999), is very low and has an angle of 44 degrees, which agrees with that of the dust arc in CMa R1 (Vrba, Baierlein & Herbst 1987). This suggests that the rotation axis of HD 53367 “remembers” the larger scale circumstellar field direction, which means that at least at the time of formation of the dust arc, the star had a magnetic field that could be coupled with the large scale field of CMa R1. The exceptionally low rotation velocity of HD 53367 may therefore be a result of magnetic braking during outflow or accretion.
Attempts to measure the magnetic field of HD 53367 have been made recently by Glagolevskij & Chountonov (1998). Although no significant field was detected at that moment it does not exclude the possibility of the presence of weak surface fields at other moments. We suggest that every 9 years during a short period the internal field moves upward and emerges in the surface layers of the star, thereby producing spot formation, similar to the solar activity cycle. If the spots cover a large part of the surface they may lower the effective temperature during the activity phase and may have an effect on the photometric colours. If the surface magnetic field was stronger during the earlier evolutionary phases of the star (e.g. during the convective phase) the field could also have braked the rotation of the star during outflow or accretion.
The braking time due to angular momentum loss in outflow has been calculated by Friend & MacGregor (1984). If the Alfvén radius of the magnetosphere is larger than the corotation radius the matter trapped in the magnetosphere at will lose angular momentum and will brake the rotation of the star. For a 20 M⊙ star with a rotation velocity of 250 km s-1 and a 200 G surface field we find an Alfvén radius of 1.74 R⋆. The outflow velocity at is then 700 km s-1. From equation 38 of Friend & MacGregor’s paper it is then seen that a mass outflow of M⊙ yr-1 in a field of only 200 G is able to brake the rotation of the star within 0.6 Myr. Similar results are obtained if one estimates the braking during the pre-main sequence accretion phase (Rathnasree 1994). At an accretion rate of M⊙ yr-1, a field of 400 G will be large enough to brake the rotation from close to break-up velocity to very slow rotation in about 1.7 Myr. In order to arrive at the same rotation velocity after a time-scale of 6 Myr smaller accretion rates and smaller fields would be sufficient.
b. A rotationally distorted Be star. The long-period photometric variation may be due to a quadrupole contribution in the external potential of a rotationally distorted Be star (Papaloizou, Savonije & Henrichs 1992). We should then expect a simultaneous periodic variation in the V/R ratio of the Balmer emission profiles. We have noted a change from V/R 1 for the profile observed in 1974 to values of V/R 1 for the profiles obtained in 1981 and 1994, but we do not have enough high resolution H observations to detect a periodicity.


4.3 LkH 220 (HU CMa) & LkH 218 (HT CMa)
In the course of the photometric monitoring program (ROTOR) at Mt. Maidanak, 153 observations of LkH 218 and 168 observations of LkH 220 were made between 1985 and 1995. The minimum time interval between the observations is 0.8 days. The variability was classified by Shevchenko et al. (1993) as LQ and BF respectively. Both stars vary irregularly with low amplitude ( 0.07 mag) on short time scales (2 days) but around 1990 the lightcurve of LkH 220 also shows a broad and shallow minimum during about 600 days (Fig. 13). For both stars there were a few variations with larger amplitude (0.2–0.4 mag). These variations were characterised by reddening during a decreasing brightness, as expected from an increasing circumstellar dust extinction. The slope of these variations in the colour-magnitude diagram is close to 3. The presence of circumstellar dust is also evident from the SEDs (Fig. 1).
5 Summary and Discussion
In the previous sections we have studied the photometric properties and the high resolution profiles of several lines in the spectra of the early B-type stars HD 52721, HD 53367, LkH 220, LkH 218, HD 52942, HD 53623, HD 53755, HD 53974 and HD 54439, which are members of CMa R1 (paper I). The membership is confirmed by the common foreground excess. We have described the photometric behaviour of the first four stars and we have discussed the possible origin. The conclusions of this discussion can be summarized by: (a) HD 52721 varies with a period of 0.80508 days and the variation is consistent with the presence of a partially eclipsing binary companion. (b) HD 53367 has a long-term photometric variation with a period of 9 yr, and a shorter variation (166 days) in radial velocity. The second variation (detected by Corporon & Lagrange 1999) is probably due to the presence of a binary companion. We have given arguments for the interpretation of the long-term photometric variability in terms of a cycle of magnetic activity. During its previous evolution, an outflow of M⊙ yr-1 in the presence of a modest (200 G) magnetic field would have been sufficient to brake the rotation of the star to its present low value of . (c) The photometric variability of LkH 218 and LkH 220 seems partly due to variability of the column density in their circumstellar dust envelopes.
Three of these stars (HD 52721, HD 53367 and LkH 220) have spectra, which are characterised by emission components in H, H, He i (5867 Å), the Ca ii (2) red triplet, the O i 7773 Å triplet and the O i 8446 line, which gives arguments for the presence of a disc around these stars (see also Hamann & Persson 1992). Whether these discs are classical Be star discs or the remnants of pre-main sequence accretion discs remains uncertain so far. Note that stellar winds from early B type main sequence stars and classical Be stars usually reach velocities in excess of 1500 km s-1 (see e.g. Porter 1999), much higher than the 600 and 450 km s-1 as observed for HD 52721 and HD 53367 in the wings of the Si iv lines (Fig. 8) and the 340 and 370 km s-1 in the wing of the 1548 Å C iv line. However, recently Drew, Proga & Stone (1998) modelled the wind from accretion discs of young early type B stars and found that rotating discs can have high mass-loss rates ( 10-7 M⊙ yr-1) in combination with lower velocity (a few hundred km s-1) equatorial disc winds. These are precisely the mass losses and wind velocities we measured for HD 52721 and HD 53367.
We also discussed the H and 5876 Å He i profiles of the five stars without clear indications of emission in H. In these stars H and He i have very similar profiles, which suggests that H is mainly formed in the photospheres of these stars. The high wind velocities measured in the wings of their Si iv profiles ( 1500 km s-1) of HD 53755 and HD 53974 are typical for normal early type stars. If the four H emission stars indeed have accretion discs, the next question is whether the other five young stars HD 52942 (B2 IVn), HD 53623 (B0.5–1 IV/V), HD 53755 (B0 V + F5 III), HD 53974 (B0 IIIn) and HD 54439 (B1 V) could have such discs. Although HD 53974, HD 53755 and HD 54439 show weak indications of emission in their H and He i profiles (Fig. 9), it seems doubtful if discs are present around these stars.
One obvious question is then why these stars do not have accretion discs in spite of their ages being comparable with those of the stars with clear H emission (paper I). The conditions for the existence of discs could be influenced by the presence of nearby binary companions. Both HD 52721 and HD 53367 have such companions, but of the other group also HD 53974 and HD 52942 have companions at comparable distances. We suggest that the survival of an accretion disc depends on influences from outside (winds or radiation from O stars or shock waves from nearby supernovae) which could evaporate accretion discs around young, early-type B stars (Yorke & Welz 1996). A natural candidate for such an outside disturbing source is the supernova about 0.8 Myr ago, which accelerated the star formation in CMa R1 (Herbst & Assousa 1978; see also paper I).
A strong indication for the position of this supernova is given by the centre of curvature of the ionization front S296, which is near (1950) = 7h08m, (1950) = 11.2∘ (Reynolds & Ogden 1978) and close to the original position of the runaway star HD 54662 (O7 III), deduced from its motion in space since the SN explosion 0.8 Myr ago. The other runaway candidate, HD 57682 (O9 Ve; Comerón et al. 1998), passes the centre at a larger distance (if the Hipparcos proper motions are assumed). It is remarkable that within the circle of curvature with radius 14 ( 25.7 pc) around the SN position only one star with H emission, HD 55135 (B4 Ve) (near the border and a foreground star at a distance of 500 pc with an of 0.10 mag) is present. This is in sharp contrast to the field at the west side of S296, where in a dust cloud region mapped with IRAS (see paper I and Luo 1991), the nine stars of our study are located. In the field between 6h50m–7h02m and between 8∘30′–12∘00′, bordering S296 at its west side, Tovmasyan et al. (1993) have found 23 stars at a distance of 1100 pc from which six stars have H emission. If we add LkH 218, LkH 220 and Z CMa, we have 26 stars in this field from which nine stars have H emission. The remarkable contrast between the relative numbers of H emission line stars east and west of S296 suggests that the dust clouds near this ionization front shields the stars westward of S296 from UV irradiation by the SN or by the two O7 stars in the circle (HD 54662 and HD 53975).
Recently several investigations have been devoted to the photo-evaporation of proplyds (discs) during FUV and EUV irradiation by an external star (Johnstone, Hollenbach & Bally 1998; Richling & Yorke 1998; Störzer & Hollenbach 1999). Until now few numerical estimates have been made and mostly for low mass stars. However, Richling & Yorke (1998) have also computed the evolution of a 1.67 M⊙ disc around a massive (8.4 M⊙) star as a result of irradiation from outside with a flux of EUV photons cm-2 s-1 (case A, model I) during 3000 yr. The authors do not give estimates for the H emission of this disc, as they did for the low mass discs, but although the 1.67 M⊙ disc is strongly deformed by the EUV influx, it seems to have conserved its inner structure after the period of 3000 yrs. In the CMa R1 situation the O stars have an EUV photon flux of s-1 (Cruz-González et al. 1974) at most, which for a distance of 18 pc to the dust barrier implies an upper limit of EUV photons cm-2 s-1 at the location of the barrier during perhaps 6 Myr. In comparison with the numerical simulation of Richling & Yorke these fluxes seem to be too low to affect the discs of the stars east of the dust shield. The presence of several H emission stars close to HD 54662 but outside the circle (HD 55439, HD 54858, MWC 551) seems to confirm this. The situation is quite different for the supernova. From a typical SN type II such as SN 1979c in M100 (Panagia et al. 1980) a flux of 300 ergs or FUV photons cm2 s-1 was flowing through a sphere at a distance of 25.7 pc at the seventh day after the explosion. Since the decay of the luminosity is exponential, the initial flux may easily have been higher by one order of magnitude. For other type II supernovae such as the Crab SN and SN 1181 (Panagia & Weiler 1980), the estimated FUV fluxes at 25.6 pc are of the same order. Such fluxes may initially be 300–1000 times larger than assumed in the simulation of Richling & Yorke, but after 200 days may have decreased to FUV photons cm-2s-1 (if the decay is similar to that of SN 1987A (Cassatella et al. 1987), which is not a typical SN type II). Although the disc simulations for UV fluxes with such time-behaviour have not been made yet, we expect an increased erosion rate of the outer disc (emission) layers of stars in the neighbourhood of the ionization front. However, discs of stars westward of this front are shielded by extinction of the dust cloud.
Although these cloud extinctions in the direction perpendicular to the line of sight are unknown, we can make an estimate of these from the 100 m optical depth distribution in the dust cloud, derived by Luo (1991) from the IRAS fluxes. We assume that the stars are in the mid-plane of the dust cloud at a geometrical depth of 15 pc (the extent of the cloud on the plane of the sky is 30 pc) and extrapolate the optical depth to the light path from the SN to the star. To this cloud extinction in the light path we add the circumstellar extinction, determined in the line of sight to the star. This total absorption in the light path from the SN to each star gives the following percentages of transmission of the FUV (at 1500 Å) flux: 12% (HD 52721), 4.5% (HD 52942), 1% (HD 53367), 1.2% (LkH 218), 6% (LkH 220), 60% (HD 53623), 40% (HD 53755), 26% (HD 53974), 28% (HD 53456), 40% (HD 53691), 10-4% (Z CMa).
This result shows that the stars with emission discs have received the lowest FUV photon fluxes from the SN, whereas the stars with high FUV transmissions show no evidence for the presence of such discs. The fact that HD 52942 shows no evidence for an emission disc in spite of its low incident FUV flux may be related to the binary nature of this object. We conclude that the presence of emission discs in and around CMa R1 appears to be correlated with the degree of shielding of the discs against photons from a central supernova source. A full explanation of emission discs in the CMa OB1 association will require numerical simulations of disc evaporation by the FUV photon flux from the supernova. However, other effects of the SN explosion (EUV irradiation, shock waves) are largely unknown, and should also be investigated.
Acknowledgments
The authors are indebted to Dr. E. Halbedel, who provided us with unpublished photometric data on HD 53367, obtained at Corralitos Observatory. We are also very grateful to Dr. Luo Shao-Guang for sending us his 100 m optical depth scans of the CMa OB1 region. We also are grateful to Dr. T.P. Ray for supplying additional information on his spectroscopic observations and to Dr. R.D. Oudmaijer for providing us with electronic versions of his spectra of HD 52721 and HD 53367. Thanks are also due to the technical crews for support during the observations at ESO and the SAO. This research has made use of the Simbad data base, operated at CDS, Strasbourg, France.
References
- [1] Abt H.A., Biggs E.S., 1972, “Bibliography of stellar radial velocities” (New York: Latham Process Corp.)
- [2] Andrillat Y., 1983, A&AS 53, 319
- [3] Andrillat Y., Jaschek M., Jaschek C., 1988, A&AS 72, 129
- [4] Böhm T., Catala C., 1995, A&A 301, 155
- [5] Bowen I.S., 1947, PASP 59, 253
- [6] Cassatella A., Fransson C., van Santvoort J., Gry C., Talavera A., Wamsteker W., Panagia N., 1987, A&A 177, L29
- [7] Cohen M., Kuhi L.V., 1979, ApJS 41, 743
- [8] Comerón F., Torra J., Gómez A.E., 1998, A&A 330, 975
- [9] Corcoran M., Ray T.P., 1998, A&A 331, 147
- [10] Corporon P., Lagrange A.-M., 1999, A&AS 136, 429
- [11] Cruz-González C., Recillas-Cruz E., Costero R., Peimbert M., Torres-Peimbert S., 1974, Rev. Mex. Astron. Astrofís. 1, 211
- [12] Drew J.E., Proga D., Stone J.M., 1998, MNRAS 296, L6
- [13] ESA, 1997, The Hipparcos Catalogue, ESA SP-1200
- [14] Ezhkova O.V., 1999, IBVS 4693, 1
- [15] Finkenzeller U., 1985, A&A 151 340
- [16] Finkenzeller U., Mundt R., 1984, A&AS 55, 109
- [17] Finkenzeller U., Jankovics I., 1984, A&AS 57, 285
- [18] Friend D.B., 1990, ApJ 353, 617
- [19] Friend D.B., MacGregor K.N., 1984, ApJ 282, 591
- [20] Garrison L.M., 1978, ApJ 224, 535
- [21] Garrison L.M., Anderson C.M., 1977, ApJ 218, 438
- [22] Glagolevskij Y.V., Chountonov G.A., 1998, Bull. Special Astrophys. Obs. 45, 105
- [23] Halbedel E.M., 1989, PASP 101,1004
- [24] Halbedel E.M., 1991, IBVS 3616, 1
- [25] Halbedel E.M., 1999, personal communication
- [26] Hamann F., Persson S.E., 1992, ApJS 82, 285
- [27] Hanuschik R.W., 1995, A&A 295, 423
- [28] Herbst W., Assousa G.E., 1977, ApJ 217, 473
- [29] Herbst W., Racine R., Warner J.W., 1978, ApJ 223, 471
- [30] Herbst W., Miller D.P., Warner J.W., Herzog A., 1982, AJ 87, 98
- [31] Herbst W., Herbst D.K., Grossman E.J., Weinstein D., 1994, AJ 108, 1906
- [32] Hobbs, L.M. 1974, ApJ 191, 381
- [33] Johnstone D., Hollenbach D., Bally J., 1998, ApJ 499, 758
- [34] Kilyakov V.S., Shevchenko V.S., 1976, Pis’ma Astron. Zh. 2, 494
- [35] Kurucz R.L., 1991, in “Stellar atmospheres–Beyond classical models” (eds. A.G. Davis Philip, A.R. Upgren, K.A. Janes), L. Davis press, Schenectady, New York, p. 441
- [36] Luo S.G., 1991, Acta Astroph. Sinica 11, 344
- [37] Moffat A.F.G., Vogt N., 1974, A&A 30, 381
- [38] Oegerle W.R., Peters G.J., Polidan R.S., 1983, PASP 95, 147
- [39] Oudmaijer R.D., Drew J.E., 1999, MNRAS 305, 166
- [40] Pamyatnykh A.A., 1999, Acta Astronomica 49, 119
- [41] Panagia N., Vettolani G., Boksenberg A., et al., 1980, MNRAS 192, 861
- [42] Panagia N., Weiler K.W., 1980, A&A 82, 389
- [43] Papaloizou J.C., Savonije G.J., Henrichs H.F., 1992, A&A 265, L45
- [44] Porter J.M., 1999, A&A 348, 512
- [45] Praderie F., Catala C., Czarny J., Thé P.S., Tjin A Djie H.R.E., 1991, A&AS 89, 91
- [46] Prinja R.K., 1990, MNRAS 246, 392
- [47] Rathnasree N., 1994, ASP Conf. Series 62, p. 227
- [48] Reynolds R.J., Ogden P.M., 1978, ApJ 224, 94
- [49] Richling S., Yorke H.W., 1998, A&A 340, 508
- [50] Rivinius T., Stefl S., Baade D., 1999, A&A 348, 831
- [51] Rountree J., Sonneborn G., 1993, “Spectral classification with the International Ultraviolet Explorer: an atlas of B-type spectra”, NASA Ref. Publ. 1312
- [52] Schaller G., Schaerer D., Meynet G., Maeder A., 1992, A&AS 96, 269
- [53] Schmidt-Kaler Th., 1982, “Landölt-Bornstein Catalogue”, VI/2b, Springer Verlag
- [54] Shevchenko V.S., Grankin K.N., Ibrahimov M.A., Mel’Nikov S.Y., Yakubov S.D., 1993, Ap&SS 202, 121
- [55] Shevchenko V.S., Ezhkova O.V., Ibrahimov M.A., van den Ancker M.E., Tjin A Djie H.R.E., 1999, MNRAS 310, 210 (Paper I)
- [56] Shevchenko V.S., Blondel P.F.C., Ezhkova O.V., Tjin A Djie H.R.E., 2000, in proc 33rd ESLAB Symp. “Star formation from the small to the large scale” (eds. F. Favata, A. Kaas & A. Wilson), ESA SP-445, p. 515.
- [57] Slettebak A., 1986, PASP 98, 867
- [58] Snow T.P., Lamers H.J.G.L.M., Lindholm D.M., Odell A.P., 1994, ApJS 95, 163
- [59] Störzer H., Hollenbach D., 1999, ApJ 515, 669
- [60] Strömgren B., 1948, ApJ 108, 242
- [61] Thé P.S., Wesselius P.R., Janssen I.M.H.H., 1986, A&AS 66, 63
- [62] Thompson G.I., Nandy K., Jamar C., Monfils A., Houziaux L., Carnochan D.J., Wilson R., 1978, Catalogue of Stellar Ultraviolet Fluxes, The Science Council
- [63] Tovmasyan G.M., Oganesyan R.K., Epremyan R.A., Yugenen D., 1993, AZh 70, 451
- [64] Uesugi A., Fukuda I., 1976, A revised catalogue of rotational velocities of the stars, University of Kyoto, Japan
- [65] Vrba F.J., Baierlein R., Herbst W., 1987, ApJ 317, 207
- [66] Wesselius P.R., van Duinen R.J., de Jonge A.R.W., Aalders J.W.G., Luinge W., Wildeman K.J., 1982, A&AS 49, 427
- [67] Yorke H.W., Welz A., 1996, A&A 315, 555