Near infrared spectroscopy of starburst galaxies
Abstract
We present new K–band spectroscopy for a sample of 48 starburst galaxies, obtained using UKIRT in Hawaii. This constitutes a fair sample of the most common types of starburst galaxies found in the nearby Universe, containing galaxies with different morphologies, masses, metallicities and far infrared luminosity L L⊙. The variety of near infrared spectral features shown by these galaxies implies different bursts characteristics, which suggests that we survey galaxies with different star formation histories or at different stages of their burst evolution.
Using synthetic starburst models, we conclude that the best ensemble of parameters which describe starburst galaxies in the nearby universe are a constant rate of star formation, a Salpeter IMF with an upper mass cutoff M M⊙ and bursts ages between 10 Myr and 1 Gyr. The model is fully consistent with the differences observed in the optical and FIR between the different types of starbursts. It suggests that HII galaxies have younger bursts and lower metallicities than SBNGs, while LIRGs have younger bursts but higher metallicities.
Although the above solution from the synthetic starburst model is fully consistent with our data, it may not constitute a strong constraint on the duration of the bursts and the IMF. A possible alternative may be a sequence of short bursts (which may follow an universal IMF) over a relatively long period of time. In favour of the multiple burst hypothesis, we distinguish in our spectra some variations of NIR features with the aperture which can be interpreted as evidence that the burst regions are not homogeneous in space and time. We also found that the burst stellar populations are dominated by early–type B stars, a characteristic which seems difficult to explain with only one evolved burst.
Our observations suggest that the starburst phenomenon must be a sustained or self–sustained phenomenon: either star formation is continuous in time or multiple bursts happen in sequence over a relatively long period of time. The generality of our observations implies that this is a characteristic of starburst galaxies in the nearby Universe.
keywords:
galaxies: starburst – infrared: galaxies1 Introduction
Although a wealth of information has been accumulated on starburst galaxies over the last 30 years, there are still fundamental questions which are left unanswered. In particular, we do not know if starburst galaxies form stars according to a universal Salpeter’s initial mass function (IMF), as it seems to be the case in normal galaxies (Elmegreen 1999), or if their IMF slope is flat or has a high lower mass cutoff, which would allow starburst galaxies to form preferentially massive stars (Rieke et al. 1993). Neither do we know if the typical duration of a burst is short, comparable to dynamical time–scales (Mas-Hesse & Kunth 1999), or if bursts are spread over a longer period of time (Meurer 2000).
In the past, various observations were carried out in order to find an answer to these two questions. Some of these studies have yield quite surprising results. By comparing different luminosity ratios in the optical and far infrared, Coziol (1996) found that most starburst galaxies may have kept forming stars at near constant rates over the last few billion years. The same conclusion was reached by Goldader et al. (1997b) for a sample of luminous infrared galaxies (L L⊙). Using synthetic starburst models, these authors found continuous star formation and burst ages varying between and yr. They also found that the best fitted IMF is Salpeter like, but have an upper mass cutoff M M⊙. This kind of IMF in starburst galaxies was previously reported by Doyon, Puxley & Joseph (1992), which also suggest that the upper mass cutoff may vary from galaxy to galaxy.
Using different arguments based on various luminosity ratios, Deutsch & Willner 1986, Coziol & Demers 1995 and Coziol 1996 have found that B type stars may be predominant in the ionised regions of massive starburst galaxies. Taken at face value, this last phenomenon seems consistent with the ages of bursts deduced by Goldader et al. and the special form of the IMF found by these authors and Doyon, Puxley & Joseph. However, as pointed out by Coziol 1996, assuming starburst is a self–sustained phenomenon, this observation could also be interpreted in terms of a sequence of short bursts spread over a few Gyr period.
Evidence of extended or multiple bursts was recently found in many well known active star forming galaxies, like NGC 6764 (Schinnerer, Eckart & Boller 2000), Arp 220 (Anantharamaiah et al. 2000), NGC 1614 (Alonso–Herrero et al. 2000) and most recently M82 (de Grijs, O’Connell & Gallagher 2000). In another recent paper, Meurer (2000), using HST, distinguished in nearby starburst galaxies different star clusters embedded in a diffuse glow of recently formed stars. Examining their colors, he concluded that these clusters are consistent with instantaneous bursts with very young ages (from 0 up to 100 Myr), while the diffuse light seems to be produced by stars formed continuously over a period ten times longer than the crossing times. A recent study of clusters in the irregular starburst galaxy NGC 1569 reveals similar clusters with ages between 3 Myrs and 1 Gyr (Hunter et al. 2000). Old (3 Gyr) merger remnants were recently reported in the radio galaxy NGC 1316 (Goudfrooij et al. 2000). Multiple bursts and low upper mass cutoff for the IMF may also be necessary to explain the number of different Wolf–Rayet sub–types in some WR galaxies (Schaerer et al. 2000). Even the small mass and less evolved HII galaxies seem to be formed of age–composite stellar systems (Raimann et al. 2000).
In the present article, we explore these issues further by studying the spectral characteristics in the near infrared (NIR) of a new sample of 48 starburst galaxies with different physical characteristics. As it is well known, the starburst family is composed of a great variety of galaxy types, spanning several orders in size, mass, luminosity and gas metallicity (Salzer, MacAlpine, & Boroson 1989). The burst characteristics of these galaxies may not necessarily be the same. By selecting galaxies with different physical characteristics, we therefore expect to draw a more general picture of the starburst phenomenon.
Our observations complete the study of luminous infrared galaxies (LIRG) made by Goldader et al. (1995, 1997a,b). By adding these two samples together, one can compare starburst galaxies which span a factor 100 in B and almost 1000 in FIR luminosity.
All the galaxies in our sample have modest far infrared (FIR) luminosity (L L⊙). According to the IRAS luminosity function (Rieke & Lebofsky 1986; Vader & Simon 1987; Saunders et al. 1990) such galaxies may form the bulk of the star forming galaxies in the nearby Universe. Our study, therefore, should reveal the “normal” behaviour in the NIR of starburst galaxies in the nearby Universe.
The K–band window in the NIR is ideal for our study. The extinction by dust in this part of the spectrum is that in the optical, which allows to compare star formation in galaxies with very different dust content. The K–band window also offers several diagnostic spectral lines for studying young stellar populations: the narrow emission line Br provides some constraints on the relative number of O and B stars, while the CO band absorption, longward of 2.3 m, can be used to estimate the ratio of Red Giants (RGs) over Red Super–Giants (RSGs) and better constrain the duration and age of the bursts (Doyon, Joseph & Wright 1994). All these parameters can now be easily deduce from available synthetic starburst models (Leitherer et al. 1999).
2 Presentation of the sample
2.1 Selection criteria and biases
The 48 galaxies in our sample were selected using optical criteria: they present a UV–excess in spectral lines or in the continuum, as established using an objective prism or the multiple filters technique. The galaxies were taken from various sources: the Montreal Blue Galaxy (MBG) survey (Coziol et al. 1993; 1994), the sample of compact Kiso galaxies observed by Augarde et al. (1994), the University of Michigan survey (Salzer, MacAlpine, & Boroson 1989) and the spectrophotometric catalogue of HII galaxies (Terlevich et al. 1991).
Discussion of the biases affecting these various surveys can be found in Coziol et al. (1997). In principle, by adding galaxies from objective prism and multiple filters surveys one can span the complete spectrum of starburst galaxies, including HII galaxies and Starburst Nucleus Galaxies (SBNGs). In practice, however, observation of HII galaxies in the NIR is more difficult, being less luminous than the SBNGs, the HII galaxies need too long exposure times. This explain the bias towards SBNGs in our sample.
By choosing galaxies which were selected based on optical criteria, we also favour galaxies which have a moderate to low FIR luminosity (Coziol et al. 1997). As we already mentioned in our introduction, this bias is opportune, as it allows us to study the most common type of starburst galaxies found in the nearby Universe (Rieke & Lebofsky 1986; Vader & Simon 1987; Saunders et al. 1990).
| Name | cz | D | B | Morph. | Dim. | 1’ | f(H) | O/H | Act. | ref. |
|---|---|---|---|---|---|---|---|---|---|---|
| (km s-1) | (Mpc) | (arc–min) | (kpc) | (erg s-1) | Type | |||||
| MBG 00027-1645 | 7339 | 99 | 13.8 | Scd pec | 29 | … | … | … | … | |
| MBG 00439-1342 | 675 | 10 | 13.8 | S0 pec | 3 | 38.23 | -3.5 | SBNG | (2b) | |
| MBG 00461-1259 | 6407 | 86 | 13.5 | (R)SB0 pec | 25 | 41.05 | -3.7 | HII | (2a) | |
| UM 306 | 5096 | 70 | … | compact | 20 | … | -3.8 | HII | (3) | |
| Mrk 1002 | 3168 | 44 | 13.3 | S0 | 13 | … | -3.1 | SBNG | (8) | |
| UM 372 | 12000 | 162 | … | compact | 47 | … | -3.9 | HII | (3) | |
| Mrk 363 | 2950 | 42 | 14.3 | S0 pec | 12 | 40.38 | -3.5 | … | (4) | |
| MBG 02072-1022 | 3859 | 53 | 13.6 | SA(r)0 pec | 15 | … | -3.4 | SBNG | (2a) | |
| MBG 02141-1134 | 4009 | 55 | 13.0 | Sc pec | 16 | 40.53 | -3.1 | SBNG | (2a) | |
| Mrk 1055 | 10830 | 146 | 15.0 | compact | 42 | … | … | … | … | |
| Mrk 602 | 849 | 13 | 13.9 | SB(rs)bc | 4 | 40.52 | … | … | (4) | |
| KUG 0305-009 | 5860 | 80 | 15.2 | compact | 23 | … | -3.2 | SBNG | (1) | |
| Mrk 603 | 2452 | 34 | 13.1 | S0 pec | 10 | … | -3.6 | SBNG | (9) | |
| KUV 03073-0035 | 7080 | 96 | 17.0 | compact | 28 | … | -3.7 | HII | (1) | |
| MBG 03084-1059 | 5003 | 68 | 14.5 | compact | 20 | 40.12 | -3.0 | SBNG | (2b) | |
| MBG 03183-1853 | 3949 | 53 | 14.1 | SB(r)b | 16 | … | … | … | … | |
| MBG 03317-2027 | 1233 | 17 | 13.5 | S0 pec | 5 | … | … | … | … | |
| KUG 0338+032 | 6615 | 90 | 16.5 | compact | 26 | … | -3.7 | HII | (1) | |
| MBG 03468-2217 | 4193 | 56 | 13.8 | (R)SB(l)a | 16 | 40.92 | -3.0 | SBNG | (2a) | |
| MBG 03523-2034 | 1733 | 24 | 14.4 | SA0 | 7 | … | -3.2 | SBNG | (2a) | |
| IRAS 04493-0553 | 2751 | 38 | 13.5 | Sb pec | 11 | … | … | … | … | |
| Mrk 1089 | 4068 | 56 | 13.3 | SB(s)m pec/int | 16 | … | -3.5 | SBNG | (10) | |
| Mrk 1194 | 4470 | 61 | 13.4 | SB0 | 18 | 41.09 | … | … | (4) | |
| II ZW 40 | 789 | 12 | 15.5 | Sbc | 4 | 38.95 | -4.0 | HII | (5) | |
| KUG 0720+335 | 4028 | 56 | … | Sp?/int? | 16 | … | -3.0 | SBNG | (1) | |
| Mrk 384 | 4702 | 65 | 13.8 | SBb | 19 | 40.84 | … | … | (4) | |
| KUG 0815+249 | 2036 | 29 | 15.3 | compact | 9 | … | -3.3 | SBNG | (1) | |
| KUG 0815+246 | 2435 | 35 | 15.3 | compact | 10 | … | -3.7 | … | (1) | |
| KUG 0821+229 | 7553 | 103 | 15.6 | compact | 30 | … | -3.6 | SBNG | (1) | |
| KUG 0825+252 | 2093 | 30 | 14.9 | pec/int? | 9 | … | … | … | … | |
| Mrk 90 | 4279 | 60 | 14.1 | compact | 17 | 40.52 | … | … | (4) | |
| Mrk 102 | 4269 | 60 | 14.5 | compact | 17 | 40.27 | -3.7 | … | (4) | |
| Mrk 401 | 1699 | 25 | 13.6 | (R)SB0/a | 7 | 40.08 | … | … | (4) | |
| I ZW 18 | 742 | 13 | 15.6 | Compact | 4 | … | -3.5 | HII | (6) | |
| Mrk 404 | 1266 | 19 | 12.0 | SAB(r)bc | 6 | … | … | … | … | |
| Mrk 710 | 1494 | 22 | 13.0 | SB(r)ab | 6 | … | … | … | … | |
| Mrk 33 | 1461 | 22 | 13.4 | Im pec | 6 | … | … | … | … | |
| MBG 21513-1623 | 11190 | 149 | 15.3 | S0/int? | 43 | 41.41 | -3.3 | SBNG | (2a) | |
| Mrk 307 | 5553 | 72 | 13.6 | SBc pec | 21 | 40.73 | -3.1 | … | (4) | |
| MBG 22537-1650 | 3271 | 43 | 14.5 | Sab | 13 | 40.20 | -3.4 | SBNG | (2a) | |
| KUG 2254+124 | 7629 | 100 | … | compact | 29 | … | … | SBNG | (1) | |
| KUG 2300+163 | 2081 | 26 | 14.2 | E3 pec | 8 | … | -3.7 | HII | (1) | |
| Mrk 326 | 3554 | 46 | 13.9 | SAB(r)bc | 13 | 40.52 | … | SBNG | (4) | |
| MBG 23318-1156 | 6180 | 82 | 14.5 | pec | 24 | … | … | … | … | |
| Mrk 538 | 2798 | 36 | 13.0 | SB(s)b pec/int? | 11 | … | -3.6 | SBNG | (4) | |
| MBG 23372-1205 | 6429 | 85 | … | pec | 25 | 40.52 | -3.5 | SBNG | (2b) | |
| MBG 23388-1514 | 9090 | 121 | 13.7 | … | 35 | 39.40 | -3.8 | HII | (2b) | |
| Mrk 332 | 2406 | 30 | 13.0 | SBc | 9 | … | … | … | … |
(1) Augarde et al. 1994; (2a) Coziol et al. 1993; (2b) Coziol et al. 1994; (3) Salzer, MacAlpine, & Boroson 1989; (4) Balzano 1983; (5) Masegosa, Moles & Campos-Aguilar 1994; (6) Izotov, Thuan & Lipovetsky 1998; (7) Kim et al. 1995; (8) Veilleux & Osterbrock 1987; (9) Liu & Kennicutt 1995; (10) Mazzarella & Boroson 1993
2.2 Physical characteristics
The physical characteristics of the galaxies in our sample are listed in Table 1. The redshifts, B magnitudes, morphologies and projected dimensions in the optical were all taken from NED111The NASA/IPAC Extragalactic Database.. The distances, in column 3, were estimated assuming H km s-1 Mpc-1, after correcting for the motion of the sun. These distances were used to determine the linear scale in kpc subtended in each galaxy by an angle of 1 arc–min on the sky (column 7). In many cases the morphology was not given. An examination of their images, as available in NED, allows us to determine that they look compact in appearance. These cases are identified in column 5. Only one galaxy, MBG 23388-1514, was not morphologically classified. Although we did not judged it compact, we could not establish its morphology.
Various spectroscopic data were collected from the literature to complement our analysis. Optical spectra of these galaxies were obtained using comparable apertures (2–3 arc–second) and median–low spectral resolutions, allowing fair comparisons with our data. When the flux is available, the observed H luminosity (column 8) was estimated. Metallicities (column 9) were determined using the ratio R([O iii] and the empirical relation proposed by Vacca & Conti (1992). For the metallicities of I Zw 18 and II Zw 40, we adopted the values estimated by Izotov, Thuan & Lipovetsky (1998) and Masegosa, Moles & Campos-Aguilar (1994). The activity types (column 10) were established by comparing the ratios [NII]/H with [OIII]/H (Baldwin, Phillips & Terlevich 1981; Veilleux & Osterbrock 1987). The numbers in the last column identify the references for the various spectroscopic data.
| Name | LIR/L⊙ | (60,25) | (100,60) | Act. type |
|---|---|---|---|---|
| MBG 00027-1645 | 8.18 | -2.11 | -1.77 | SBNG |
| MBG 00439-1342 | 8.61 | -2.74 | -1.47 | SBNG |
| MBG 00461-1259 | 10.22 | … | -0.73 | … |
| Mrk 1002 | 10.16 | -2.05 | -0.61 | SBNG |
| Mrk 363 | 9.83 | … | -0.83 | … |
| MBG 02072-1022 | 10.70 | -1.87 | -1.59 | SBNG |
| MBG 02141-1134 | 10.51 | -2.37 | -1.33 | SBNG |
| Mrk 1055 | 10.30 | … | -2.32 | … |
| Mrk 602 | 9.00 | -2.03 | -0.82 | SBNG |
| KUG 0305-009 | 9.92 | … | -2.22 | … |
| Mrk 603 | 10.35 | -2.04 | -0.28 | SBNG |
| MBG 03084-1059 | 9.83 | … | -1.85 | … |
| MBG 03183-1853 | 9.58 | … | -2.66 | … |
| MBG 03468-2217 | 10.29 | -1.98 | -0.47 | SBNG |
| IRAS 04493-0553 | 9.83 | -2.53 | -1.34 | SBNG |
| Mrk 1194 | 10.64 | -2.57 | -1.06 | SBNG |
| Mrk 384 | 10.45 | -2.11 | -1.19 | SBNG |
| Mrk 90 | 9.83 | … | -1.60 | … |
| Mrk 102 | 9.64 | … | -1.20 | … |
| Mrk 401 | 9.42 | -1.74 | -0.87 | SBNG |
| Mrk 404 | 9.91 | -2.48 | -1.35 | SBNG |
| Mrk 710 | 9.33 | -2.16 | -0.80 | SBNG |
| MBG 21513-1623 | 10.72 | -2.13 | -1.43 | SBNG |
| Mrk 307 | 10.27 | -2.56 | -1.70 | SBNG |
| KUG 2300+163 | 9.11 | … | -0.34 | … |
| Mrk 326 | 10.13 | -1.95 | -0.79 | SBNG |
| MBG 23318-1156 | 9.23 | … | -1.45 | … |
| Mrk 538 | 10.31 | -1.47 | -0.21 | SBNG |
| MBG 23372-1205 | 9.67 | … | -0.96 | … |
| MBG 23388-1514 | 9.14 | … | -1.05 | … |
| Mrk 332 | 9.91 | -2.35 | -1.31 | SBNG |
We give in Table 2 some information in the FIR for 31 galaxies (64%) in our sample. These data come from the IRAS Faint Source Catalogue, as found in NED. The FIR luminosity in column 2 was determined using the relation (Londsdale et al. 1985): , where is the redshift, erg cm-2 s-1 and and are the fluxes in Jansky at 60 and 100 m respectively. In column 3 and 4, we also give the FIR spectral indices (Sekiguchi 1987): . To facilitate our analysis, only galaxies which have IRAS fluxes with high or intermediate qualities had their FIR characteristics estimated. The last column gives the classification of activity type as deduced from FIR criteria (see section 2.2).
2.3 Nature of the starburst galaxies in our sample and physical variety of starburst galaxy hosts
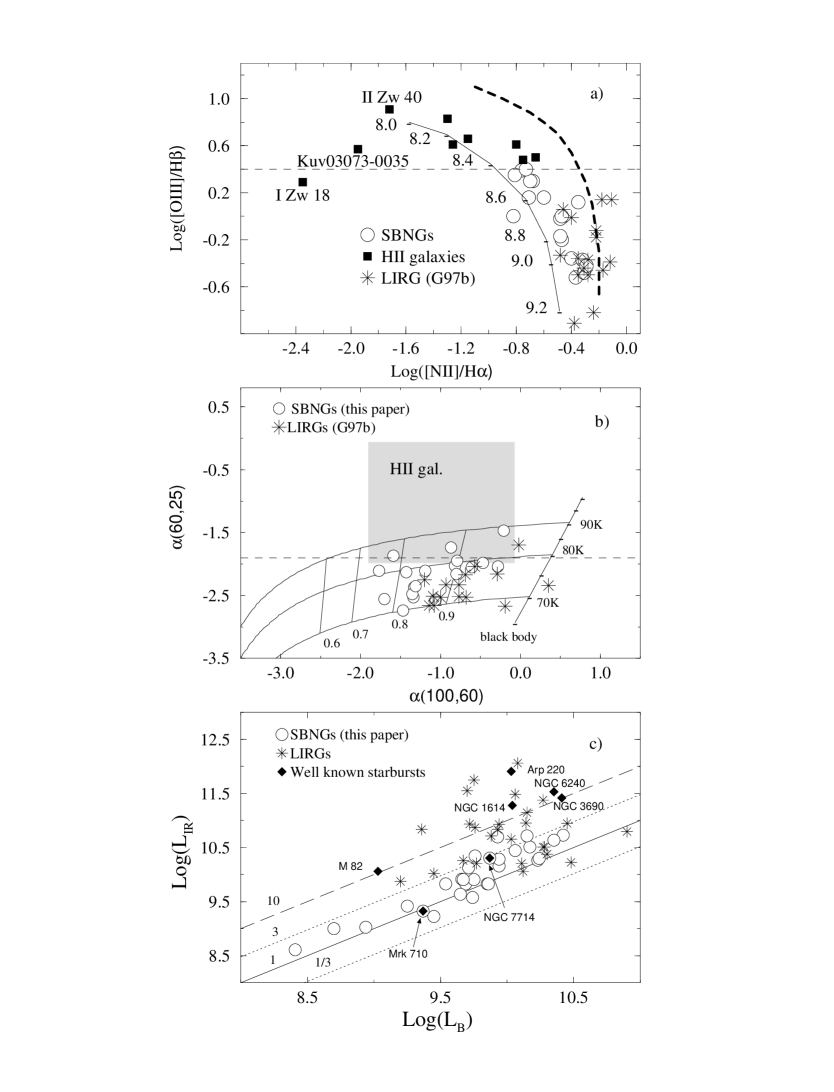
We show in Figure 1a the spectroscopic diagnostic diagram used to classify 28 galaxies in our sample with spectroscopic data available in the optical. In this diagram the horizontal dash line distinguishes between HII galaxies and SBNGs (Coziol 1996). We count 19 SBNGs for 9 HII galaxies. This result confirms our observational bias towards SBNGs. The thin continuous curve in Figure 1a follows the locus traced by normal disc HII regions (Coziol et al. 1994). On this curve, the gas metallicity, given as , increases as the level of excitation (related to [OIII]/H) decreases. The galaxies in our sample cover the complete sequence in starburst’s metallicities. Considering only the SBNGs, we found a mean metallicity , which is typical of this class of galaxies (Coziol et al. 1999).
Half of the galaxies that could not be classified in the optical have FIR characteristics which can be used to determine their starburst type: SBNGs or HII galaxies. In Figure 1b we show a diagnostic diagram based on IRAS spectral indices (60,25) and (100,60). Starburst galaxies are described in this diagram by a model with two dust components (Sekiguchi 1987): a cold component with a dust temperature of 27 K and a hot component with dust temperatures varying between 70 and 90 K. According to this model, starburst galaxies differ from normal spiral galaxies by their hot dust contribution, which is usually higher than 60%. Although very few HII galaxies are detected in the FIR, they can usually be distinguished from SBNGs from their hotter dust temperatures. This is indicated by the gray area in Figure 1b. According to this last criterion, most of the galaxies with FIR data in our sample are SBNGs.
| Aperture 1 | Aperture 2 | ||||||||
| ——————————————————– | ——————————————————– | ||||||||
| Name | z | f(Br) | EW(Br) | f(H2) | EW(H2) | f(Br) | EW(Br) | f(H2) | EW(H2) |
| (erg s-1) | (Å) | (erg s-1) | (Å) | (erg s-1) | (Å) | (erg s-1) | (Å) | ||
| MBG00027-1645 | 0.0269 | 2.1 0.3 | 4.1 0.7 | 1.7 0.3 | 3.2 0.6 | 0.7 0.2 | 2.6 0.8 | 0.8 | 2.9 |
| MBG00439-1342 | 0.0019 | 2.7 | 3.7 | 1.6 | 2.1 | 0.9 | 2.7 | 0.7 | 2.1 |
| MBG00461-1259 | 0.0232 | 1.8 0.4 | 11.0 2.7 | 0.8 | 4.5 | 0.7 0.2 | 8.3 1.7 | 0.3 | 3.2 |
| UM306 | 0.0175 | 0.2 | 10.9 | 0.2 | 7.2 | 0.1 | 11.2 | 0.1 | 11.6 |
| Mrk1002 | 0.0121 | 8.8 0.6 | 8.4 0.6 | 2.7 0.8 | 2.5 0.7 | 5.5 0.4 | 8.6 0.6 | 1.3 | 1.9 |
| UM372 | 0.0395 | 0.9 | 11.7 | 0.7 | 8.4 | 0.4 | 5.4 | 0.5 | 6.7 |
| Mrk363 | 0.0087 | 1.0 | 3.0 | 1.6 | 4.4 | 0.4 | 2.7 | 0.6 | 3.8 |
| MBG02072-1022 | 0.0138 | 37.4 1.9 | 10.5 0.5 | 11.5 | 3.1 | 25.2 0.8 | 13.9 0.4 | 5.4 | 2.8 |
| MBG02141-1134 | 0.0149 | 4.2 0.5 | 7.7 0.9 | 2.0 0.4 | 3.5 0.6 | 1.7 0.4 | 7.6 1.7 | 0.8 0.2 | 3.5 0.8 |
| Mrk1055 | 0.0388 | 1.1 | 4.2 | 1.1 | 3.7 | 0.8 | 4.1 | 0.6 | 2.8 |
| MRK602 | 0.0018 | 6.1 | 7.3 | 3.0 | 3.5 | 5.5 | 9.1 | 2.2 | 3.5 |
| KUG0305-009 | 0.0214 | 1.1 0.3 | 4.2 1.3 | 0.8 | 2.8 | 0.6 0.2 | 3.9 1.2 | 0.6 | 3.8 |
| Mrk603 | 0.0095 | 23.5 0.8 | 22.9 0.8 | 4.1 0.8 | 3.7 0.8 | 16.9 0.4 | 23.4 0.6 | 1.4 0.3 | 1.8 0.4 |
| KUV03073-0035 | 0.0236 | 1.0 0.3 | 5.0 1.4 | 1.0 | 4.5 | 0.6 0.1 | 5.6 0.9 | 0.6 | 5.1 |
| MBG03084-1059 | 0.0180 | 1.2 | 4.3 | 0.9 | 3.3 | 0.8 0.2 | 5.4 1.1 | 0.5 | 3.3 |
| MBG03183-1853 | 0.0132 | 0.7 | 3.0 | 1.1 | 4.4 | 0.4 | 3.5 | 0.4 | 3.8 |
| MBG03317-2027 | 0.0047 | 1.6 | 2.1 | 2.8 | 3.5 | 1.4 | 2.8 | 1.3 | 2.4 |
| KUG0338+032 | 0.0228 | 0.7 | 8.3 | 0.8 | 8.2 | 0.4 0.1 | 5.8 1.8 | 0.3 | 4.4 |
| MBG03468-2217 | 0.0157 | 8.6 0.7 | 8.4 0.7 | 3.3 0.5 | 3.1 0.4 | 6.3 0.5 | 8.2 0.6 | 1.6 0.4 | 2.0 0.5 |
| MBG03523-2034 | 0.0070 | 1.3 0.4 | 5.4 1.7 | 1.1 0.3 | 4.7 1.1 | 0.5 | 3.7 | 0.3 | 2.0 |
| IRAS04493-0553 | 0.0095 | 1.6 0.3 | 7.4 1.4 | 0.9 0.3 | 3.9 1.2 | 0.5 0.2 | 6.9 2.3 | 0.4 | 5.5 |
| Mrk1089 | 0.0148 | 10.7 0.3 | 84.9 3.9 | 1.8 0.2 | 13.5 1.9 | 3.7 0.2 | 79.0 4.7 | 0.9 0.2 | 18.8 4.5 |
| Mrk1194 | 0.0167 | 5.6 0.5 | 4.1 0.4 | 3.7 0.6 | 2.6 0.4 | 1.1 0.3 | 1.8 0.5 | 1.5 0.3 | 2.3 0.4 |
| IIZW40 | 0.0034 | 45.1 0.4 | 264.4 9.3 | 2.3 0.5 | 13.0 2.7 | 34.3 0.4 | 322.0 15.0 | 1.2 0.2 | 11.6 1.4 |
| KUG0720+335 | 0.0134 | 16.9 0.6 | 18.4 0.7 | 3.5 0.7 | 3.6 0.8 | 13.2 0.4 | 18.9 0.6 | 2.1 0.4 | 2.8 0.5 |
| Mrk384 | 0.0155 | 3.0 1.0 | 3.7 1.2 | 3.1 | 3.7 | 2.0 0.4 | 5.0 0.9 | 1.5 | 3.5 |
| KUG0815+249 | 0.0075 | 1.5 0.4 | 7.7 1.9 | 1.0 | 4.8 | 0.6 0.1 | 5.8 1.1 | 0.7 | 6.2 |
| KUG0815+246 | 0.0091 | 0.9 | 7.4 | 1.4 | 10.4 | 0.6 | 8.5 | 0.7 | 8.7 |
| KUG0821+229 | 0.0253 | 0.5 0.2 | 4.2 1.4 | 0.9 | 7.1 | 0.5 0.2 | 8.1 2.5 | 0.8 | 11.1 |
| KUG0825+252 | 0.0071 | 0.4 | 3.9 | 0.7 | 6.5 | 0.3 | 5.5 | 0.3 | 4.7 |
| Mrk90 | 0.0112 | 2.0 | 4.8 | 1.0 | 2.4 | 0.8 | 4.2 | 1.0 | 4.7 |
| Mrk102 | 0.0105 | 2.0 | 3.5 | 2.5 | 4.1 | 1.2 0.4 | 4.4 1.5 | 1.8 | 6.2 |
| Mrk401 | 0.0061 | 6.8 0.7 | 5.2 0.5 | 2.4 | 1.7 | 6.4 0.5 | 7.3 0.6 | 1.5 | 1.6 |
| IZW18 | 0.0020 | 2.0 | 180.4 | 1.3 | 85.3 | 0.8 | 76.5 | 0.7 | 70.4 |
| Mrk404 | 0.0038 | 11.5 1.3 | 5.3 0.6 | 4.4 | 1.9 | 8.9 0.7 | 6.1 0.5 | 3.0 1.0 | 2.0 0.6 |
| Mrk710 | 0.0055 | 18.3 0.6 | 36.3 1.2 | 3.1 0.6 | 5.7 1.1 | 15.1 0.4 | 57.5 2.2 | 2.3 0.3 | 8.3 1.2 |
| Mrk33 | 0.0040 | 29.8 0.9 | 34.0 1.1 | 3.2 0.8 | 3.5 0.9 | 18.6 0.5 | 33.8 1.0 | 2.0 0.4 | 3.5 0.7 |
| MBG21513-1623 | 0.0381 | 0.5 0.1 | 6.5 1.5 | 0.6 | 7.0 | 0.4 | 11.3 | 0.3 | 7.1 |
| Mrk307 | 0.0193 | 2.1 | 8.9 | 1.4 | 5.4 | 1.2 0.3 | 10.4 2.3 | 0.8 | 6.3 |
| MBG22537-1650 | 0.0138 | 1.0 0.3 | 3.5 1.0 | 1.2 | 4.0 | 0.6 0.2 | 4.0 1.0 | 0.6 | 3.5 |
| KUG2254+124 | 0.0256 | 0.8 0.2 | 10.6 2.7 | 0.8 | 9.9 | 0.4 0.1 | 8.8 2.8 | 0.5 | 10.8 |
| KUG2300+163 | 0.0082 | 1.3 0.2 | 21.4 2.5 | 0.5 | 7.0 | 0.6 0.1 | 22.0 2.8 | 0.2 | 5.9 |
| Mrk326 | 0.0140 | 5.2 0.6 | 5.3 0.6 | 2.4 | 2.3 | 6.1 0.4 | 8.4 0.6 | 2.4 0.6 | 3.1 0.8 |
| MBG23318-1156 | 0.0206 | 0.9 0.2 | 12.9 3.0 | 1.0 | 12.4 | 0.5 0.2 | 15.4 4.9 | 0.4 | 10.1 |
| Mrk538 | 0.0110 | 14.6 0.9 | 17.1 1.1 | 6.7 1.0 | 7.5 1.1 | 10.5 0.4 | 18.9 0.7 | 3.2 0.3 | 5.4 0.6 |
| MBG23372-1205 | 0.0239 | 0.8 0.2 | 9.0 2.7 | 0.7 | 7.6 | 0.9 | 21.3 | 0.8 | 16.8 |
| MBG23388-1514 | 0.0303 | 1.6 | 23.3 | 1.6 | 23.0 | 0.5 | 13.7 | 0.6 | 14.8 |
| Mrk332 | 0.0110 | 2.5 0.8 | 2.6 0.8 | 2.6 0.7 | 2.6 0.7 | 2.2 0.6 | 3.7 0.9 | 1.9 0.5 | 2.9 0.8 |
| Aperture 1 | Aperture 2 | ||||||||
|---|---|---|---|---|---|---|---|---|---|
| ——————————————————– | ——————————————————– | ||||||||
| Name | z | COspec | mK | S/N | COspec | mK | S/N | ||
| (mag.) | (mag.) | ||||||||
| MBG00027-1645 | 0.0269 | -2.85 0.14 | 0.21 0.01 | 12.32 | 116 | -3.01 0.14 | 0.25 0.01 | 13.04 | 92 |
| MBG00439-1342 | 0.0019 | -3.15 0.13 | 0.23 0.01 | 12.14 | 115 | -2.90 0.10 | 0.20 0.01 | 12.99 | 92 |
| MBG00461-1259 | 0.0232 | -3.33 0.23 | 0.17 0.02 | 13.55 | 49 | -3.27 0.23 | 0.17 0.02 | 14.23 | 48 |
| UM306 | 0.0175 | -4.37 0.35 | -0.02 0.04 | 15.74 | 26 | -3.66 0.44 | 0.03 0.05 | 16.49 | 23 |
| Mrk1002 | 0.0121 | -2.40 0.10 | 0.19 0.01 | 11.59 | 101 | -2.03 0.08 | 0.17 0.01 | 12.09 | 111 |
| UM372 | 0.0395 | -3.11 0.34 | 0.02 0.03 | 14.22 | 23 | -3.84 0.25 | 0.03 0.03 | 14.32 | 50 |
| Mrk363 | 0.0087 | -3.08 0.10 | 0.15 0.01 | 12.85 | 108 | -3.01 0.12 | 0.14 0.01 | 13.72 | 92 |
| MBG02072-1022 | 0.0138 | -2.80 0.13 | 0.29 0.01 | 10.34 | 53 | -3.06 0.12 | 0.32 0.01 | 11.09 | 272 |
| MBG02141-1134 | 0.0149 | -3.01 0.12 | 0.20 0.01 | 12.34 | 85 | -2.56 0.13 | 0.15 0.01 | 13.26 | 54 |
| Mrk1055 | 0.0388 | -3.61 0.21 | 0.16 0.02 | 12.95 | 49 | -4.01 0.21 | 0.21 0.02 | 13.33 | 60 |
| MRK602 | 0.0018 | -2.97 0.17 | 0.22 0.01 | 11.93 | 132 | -2.93 0.19 | 0.20 0.02 | 12.27 | 185 |
| KUG0305-009 | 0.0214 | -2.90 0.12 | 0.17 0.01 | 13.12 | 70 | -2.31 0.13 | 0.15 0.01 | 13.70 | 73 |
| Mrk603 | 0.0095 | -2.83 0.08 | 0.16 0.01 | 11.61 | 107 | -2.79 0.07 | 0.17 0.01 | 11.99 | 187 |
| KUV03073-0035 | 0.0236 | -2.49 0.14 | 0.23 0.02 | 13.28 | 73 | -2.50 0.14 | 0.26 0.02 | 13.94 | 68 |
| MBG03084-1059 | 0.0180 | -2.74 0.14 | 0.20 0.01 | 13.02 | 63 | -2.95 0.15 | 0.25 0.01 | 13.73 | 52 |
| MBG03183-1853 | 0.0132 | -3.24 0.12 | 0.16 0.01 | 13.19 | 67 | -3.35 0.16 | 0.15 0.01 | 14.17 | 55 |
| MBG03317-2027 | 0.0047 | -3.03 0.10 | 0.22 0.01 | 12.01 | 80 | -2.90 0.10 | 0.21 0.01 | 12.43 | 90 |
| KUG0338+032 | 0.0228 | -3.11 0.23 | 0.12 0.02 | 14.24 | 30 | -3.40 0.21 | 0.12 0.03 | 14.53 | 46 |
| MBG03468-2217 | 0.0157 | -2.36 0.10 | 0.27 0.01 | 11.61 | 85 | -2.51 0.10 | 0.28 0.01 | 11.93 | 129 |
| MBG03523-2034 | 0.0070 | -2.60 0.18 | 0.21 0.02 | 13.22 | 42 | -2.40 0.15 | 0.23 0.02 | 13.90 | 49 |
| IRAS04493-0553 | 0.0095 | -3.04 0.15 | 0.18 0.02 | 13.35 | 37 | -2.49 0.23 | 0.16 0.03 | 14.50 | 21 |
| Mrk1089 | 0.0148 | -2.45 0.32 | 0.19 0.04 | 13.83 | 26 | -3.68 0.45 | 0.16 0.05 | 14.97 | 18 |
| Mrk1194 | 0.0167 | -2.66 0.09 | 0.22 0.01 | 11.33 | 240 | -2.67 0.09 | 0.21 0.01 | 12.22 | 222 |
| IIZW40 | 0.0034 | -1.97 0.15 | 0.07 0.01 | 13.42 | 64 | -1.79 0.18 | 0.06 0.02 | 13.91 | 73 |
| KUG0720+335 | 0.0134 | -2.66 0.08 | 0.24 0.01 | 11.72 | 120 | -2.75 0.08 | 0.26 0.01 | 12.02 | 169 |
| Mrk384 | 0.0155 | -3.11 0.12 | 0.25 0.01 | 11.91 | 52 | -2.13 0.12 | 0.16 0.01 | 12.60 | 42 |
| KUG0815+249 | 0.0075 | -3.19 0.21 | 0.16 0.02 | 13.40 | 51 | -3.90 0.20 | 0.16 0.02 | 14.09 | 49 |
| KUG0815+246 | 0.0091 | -3.20 0.24 | 0.14 0.02 | 13.91 | 35 | -3.45 0.31 | 0.12 0.04 | 14.55 | 35 |
| KUG0821+229 | 0.0253 | -3.28 0.30 | 0.11 0.03 | 13.87 | 34 | -4.25 0.27 | 0.14 0.02 | 14.57 | 33 |
| KUG0825+252 | 0.0071 | -3.06 0.17 | 0.18 0.01 | 14.19 | 36 | -3.56 0.21 | 0.15 0.01 | 14.89 | 36 |
| Mrk90 | 0.0112 | -3.24 0.18 | 0.22 0.02 | 12.66 | 58 | -2.98 0.13 | 0.16 0.01 | 13.41 | 50 |
| Mrk102 | 0.0105 | -3.68 0.14 | 0.18 0.01 | 12.29 | 71 | -3.16 0.16 | 0.12 0.01 | 13.06 | 55 |
| Mrk401 | 0.0061 | -2.91 0.08 | 0.21 0.01 | 11.43 | 286 | -2.80 0.08 | 0.22 0.01 | 11.86 | 306 |
| IZW18 | 0.0020 | -3.63 3.36 | 0.43 0.34 | 16.45 | 2 | -6.69 2.88 | -0.01 0.29 | 16.89 | 3 |
| Mrk404 | 0.0038 | -2.69 0.11 | 0.24 0.01 | 10.85 | 91 | -2.38 0.08 | 0.23 0.01 | 11.26 | 88 |
| Mrk710 | 0.0055 | -2.06 0.22 | 0.09 0.02 | 12.33 | 64 | -1.65 0.24 | 0.10 0.03 | 13.02 | 71 |
| Mrk33 | 0.0040 | -2.63 0.10 | 0.20 0.01 | 11.80 | 95 | -2.57 0.08 | 0.19 0.01 | 12.31 | 117 |
| MBG21513-1623 | 0.0381 | -2.60 0.26 | 0.14 0.02 | 14.26 | 32 | -3.18 0.45 | 0.12 0.05 | 15.22 | 23 |
| Mrk307 | 0.0193 | -3.24 0.23 | 0.21 0.02 | 13.19 | 49 | -2.98 0.22 | 0.24 0.02 | 13.96 | 38 |
| MBG22537-1650 | 0.0138 | -2.70 0.11 | 0.16 0.01 | 12.92 | 78 | -2.88 0.13 | 0.17 0.01 | 13.60 | 92 |
| KUG2254+124 | 0.0256 | -3.84 0.25 | 0.10 0.03 | 14.33 | 25 | -4.65 0.31 | 0.20 0.04 | 14.98 | 31 |
| KUG2300+163 | 0.0082 | -2.54 0.22 | 0.19 0.02 | 14.61 | 44 | -2.49 0.21 | 0.17 0.02 | 15.58 | 52 |
| Mrk326 | 0.0140 | -2.87 0.10 | 0.24 0.01 | 11.67 | 105 | -2.68 0.10 | 0.27 0.01 | 12.00 | 166 |
| MBG23318-1156 | 0.0206 | -3.67 0.34 | 0.05 0.03 | 14.44 | 24 | -3.59 0.34 | 0.11 0.04 | 15.29 | 19 |
| Mrk538 | 0.0110 | -3.11 0.13 | 0.22 0.01 | 11.83 | 82 | -3.19 0.13 | 0.27 0.01 | 12.31 | 79 |
| MBG23372-1205 | 0.0239 | -3.28 0.49 | 0.09 0.05 | 14.22 | 22 | -3.16 0.75 | 0.07 0.08 | 15.04 | 18 |
| MBG23388-1514 | 0.0303 | -5.80 0.78 | -0.12 0.08 | 14.59 | 13 | -5.33 0.57 | -0.03 0.07 | 15.30 | 13 |
| Mrk332 | 0.0110 | -3.51 0.15 | 0.21 0.01 | 11.75 | 129 | -3.45 0.15 | 0.23 0.01 | 12.22 | 153 |
2.4 Probability to find an AGN in our sample
Using FIR criteria we can also ascertain what is the probability that one of the galaxies in our sample is dominated by an AGN. According to Coziol et al. (1998), 99% of IRAS starburst galaxies have (60,25) (the horizontal dash line in Figure 1b), while only 25% of Seyfert galaxies have such FIR colours. Almost all the galaxies in our sample have (60,25) , which excludes the possibility that one of these galaxies is dominated by an AGN. Note that the three galaxies exceeding this limit in our sample (Mrk 538, Mrk 401 and MBG 02072-1022) have already been classified as SBNGs from their spectra. In fact, all the galaxies previously classified as starburst based on their optical spectra occupy this region of the diagram, which thus confirms their nature as starburst.
Only six of the galaxies detected in the FIR diagram do not have a spectral classification in the optical. Based on the reported statistics above, and the total number of galaxies which was necessary to established it (see Coziol et al. 1998), we estimate to 7% the probability to find an AGN (which is probably not predominant) in this region of the diagram. This reduce to none the probability that one of these six galaxies also host an AGN. This results is not surprising considering the moderate FIR luminosity of these galaxies and the fact that the probability to find an AGN increases with the FIR luminosity (Veilleux, Kim & Sanders 1999).
The above conclusion hold also for the ten galaxies in our sample without spectral classification or FIR detection. Height of these galaxies were classified as starburst based on an objective prism spectrum, which rules out the presence of a broad line or luminous AGN. The last two are MBG galaxies which were classified as starburst based on narrow lines and small [NII]/H ratios in one spectrum. The fact that these galaxies were not detected in IRAS suggests that the probability they host an AGN is practically null.
2.5 Comparison with LIRGs and uLIRGs
At this point of our analysis, it is convenient to compare our sample of galaxies with the 16 LIRGs previously classified as starburst in the study of Goldader et al. (1997a). In Figure 1a, we see that the LIRGs have spectroscopical characteristics similar to SBNGs. However, they are generally more metal rich, having solar metallicity on average. Their hot dust contribution (Figure 1b) is also higher than in SBNGs, which is consistent with their higher FIR luminosity.
In Figure 1c, we compare the FIR and B luminosities of our galaxies with those of the LIRGs. For comparison, we also include some ultra luminous infrared galaxies (uLIRGs) from the literature. The ratios LIR/LB can be used to distinguish galaxies with unusually high star formation rates (see Coziol 1996): normal late–type spiral galaxies with constant star formation rates over the last 3 Gyrs have LIR/LB . One can see that the ratio LIR/LB tends to increase with the B luminosity. The uLIRGs and LIRGs have both higher B luminosities and, therefore, higher LIR/LB ratios as compared to SBNGs. Most of the galaxies in our sample have ratios LIR/LB varying between 1 and 3. This comparison suggests that uLIRGs and LIRGs are generally more massive than SBNGs (having higher B luminosity) and may have more active burst regions or have younger bursts (as judged from their higher LIR/LB ratios).
One remarkable feature of Figure 1c is how the starburst galaxies in our sample differ from well known uLIRGs, like Arp 220, NGC 6240, NGC 1614 or NGC 3690. The nature of uLIRGs is still in debate. It is not sure if part of the activity observed in these galaxies is not due to an hidden AGN. This is not the case of the galaxies in our sample. The position, in Figure 1c, of the ”prototype“ starburst galaxy M82 seems, however, interesting. This galaxy looks more like an uLIRG than to one of our galaxies. This is consistent with the extreme properties observed in this object, which may also suggest some kind of AGN activity (Seaquist, Frayer & Frail 1997; Allen & Kronberg 1998; Kaaret et al. 2000). Two other archetype starburst galaxies in our sample are NGC 7714 (Mrk 538) and Mrk 710. These two galaxies are more representative of the starburst activity in our sample of galaxies.
The above analysis emphasizes the diversity of physical characteristics of galaxies hosting a starburst. Our observations should reveal if this variety of physical characteristics is reflected in their NIR spectral features.
3 Observation
The 2–2.5 m spectra, studied in this paper, were obtained with the CGS4 spectrometer (Mountain et al. 1990) on UKIRT on the nights of 1992 November 5 and of 1993 November 24, 25, and 26. A 75 l/mm grating was used in first order, providing a resolving power () of 300 in the -band and a spectral coverage encompassing most of the -band. The plate scale was 3 arc–second per pixel and the slit width was 1 pixel. This aperture was sufficient to cover the central and most luminous part (usually the nucleus) of the galaxies. The slit length was 30 pixels. For all galaxies, the slit was positioned in the north south direction on the brightest optical peak as seen from the offset guider camera. Integration times were generally 10–20 minutes and sky frames were obtained by nodding 10 pixels along the slit, hence keeping the object always on the slit. Several spectroscopic and photometric standards were also observed during each night. The spectrophotometric accuracy of our spectra is estimated to be 20%. The spectra were reduced under the IRAF environment using IRAF scripts written by one of us (RD). Details on the procedure followed for the reduction can be found in Doyon et al. (1995).
In Table 3, we present the fluxes and equivalent widths of the Br and H2 emission lines as measured in our spectra. These quantities were estimated after rectifying the continuum by fitting a power law () from the featureless sections of the spectrum. The choice of a power–law is physically justified by the fact that late-stars show approximately Rayleigh–Jeans spectrum in the NIR (F, between 2 and 2.9m; see appendix A of Doyon, Joseph & Wright 1994). A minimisation routine was then used to fit a Gaussian profile to the Br emission line. In Table 3, values without an error estimate corresponds to 3 sigma upper limits.
We give in Table 4 the exponent () of the power law fit for the continuum, the CO spectroscopic indices (COspec), as defined in Doyon, Joseph & Wright (1994), and the spectroscopic K magnitudes. The COspec quoted include the uncertainty in the continuum level. In general, the error on COspec is dominated by this uncertainty, which is less than 0.02 mag. The second column of Table 4 gives the redshifts as deduced from the features observed. These redshifts are in relatively good agreement with the one found in NED. The last column gives the signal to noise ratios in our spectra.
For each galaxy in the two tables we give two sets of data. The first set corresponds to values as measured using an aperture covering 3 arc–second (Aperture 1). The second set (the last four columns of each tables) corresponds to values as measured using an aperture covering only 3 arc–second (Aperture 2). In our following analysis, the smaller aperture will be associated to the nucleus of the galaxies.


A few representative spectra are shown in Figure 2 and Figure 3. We regroup the spectra in two categories. In the first category, Figure 2, the galaxies possess strong Bracket (2.166 m) emission. These galaxies also show relatively strong HeI (2.059 m) and H2 1-0 S(1) (2.122 m) emission lines. They show, on the other hand, different strengths of the CO absorption band longward of 2.293 m.
The most extreme case in our sample is the HII galaxy II Zw 40. This galaxy shows very strong emission lines and extremely weak CO band. This galaxy also happen to be one of the less chemically evolved galaxies in our sample. Two SBNGs with intense emission lines are Mrk 710 and Mrk 1089. Most galaxies in our sample resemble Kug 0720+335 and Mrk 538 (NGC 7714), which have medium intensity emission lines and relatively strong CO band.
In the second category, Figure 3, we find galaxies which have weaker emission lines than Mrk 538 and somewhat stronger CO band. In some galaxies, like Mrk 332, the NIR emission lines are barely visible, and only upper limits can be measured.
The NIR spectra of our sample of galaxies show significant variations. This result indicates that the diversity of physical characteristics of starburst galaxy hosts, as observed in the optical and far infrared, implies some variety of the NIR spectral features. Synthetic starburst models will now be used in order to understand what these variations mean in terms of the burst characteristics.
4 NIR Analysis
4.1 Synthetic starburst models: duration, age of the burst and IMF
Using synthetic starburst models, it is possible to interpret NIR features like EW(Br) and COspec in terms of the duration of the burst, its age and the form of the IMF (Puxley, Doyon & Ward 1997; Leitherer & Heckman 1995; Mayya 1997). The principal steps in the synthetic starburst model are the following (Leitherer & Heckman 1995): A) stars are formed at specified rates and distributed along the HR diagram; B) evolutionary models describe the time dependence of the individual physical parameters of the stars (mass, luminosity, etc.); C) the stellar number densities in the HR diagrams are determined and any desired synthetic quantities assigned to each stars. By summing over the entire stellar population the model yields the integrated properties of starburst galaxy.
In these models, star formation is represented by an exponential law: , where is the age of the burst and its duration. Two limiting cases are of special interest: an instantaneous burst and a constant star formation rate. An instantaneous burst corresponds to the case where the duration of star formation is short as compared to the age of the galaxy (). All the stars are thus formed at the same epoch. The other limiting case is a constant star formation rate (CSFR). This mode of star formation is characteristic today of disc in giant spiral galaxies (Kennicutt 1983).
It is important to note that theoretically a CSFR can always be approximated as a series of instantaneous bursts. It means that a system having experienced a sequence of bursts over a time period comparable to would be observationally indistinguishable from a galaxy with a CSFR (Leitherer et. all 1999).
Another important parameter in synthetic starburst model is the IMF. This function is usually expressed as a power law: , where the constant is determined by the total mass converted into stars. To get the whole spectrum of star masses formed, the IMF is integrated between the upper and lower mass cutoff, Mup and Mlow. In starburst models the exponent of the IMF and the two mass cutoff are not very well constrained and it is therefore important to try different possible values.
We choose to compare our data with the models of Leitherer et al. (1999). These authors have made their grids of results directly accessible on the WEB222http://www.stsci.edu/science/starburst99. We consider only two limiting cases: the instantaneous burst and the CSFR (1 M⊙ per yr). For each of these cases, three different scenarios are tested: 1) a Salpeter IMF, , with M M⊙; 2) a Salpeter’s IMF with M M⊙; 3) an IMF with a steeper slope, and M M⊙. The models cover ages from to yr.
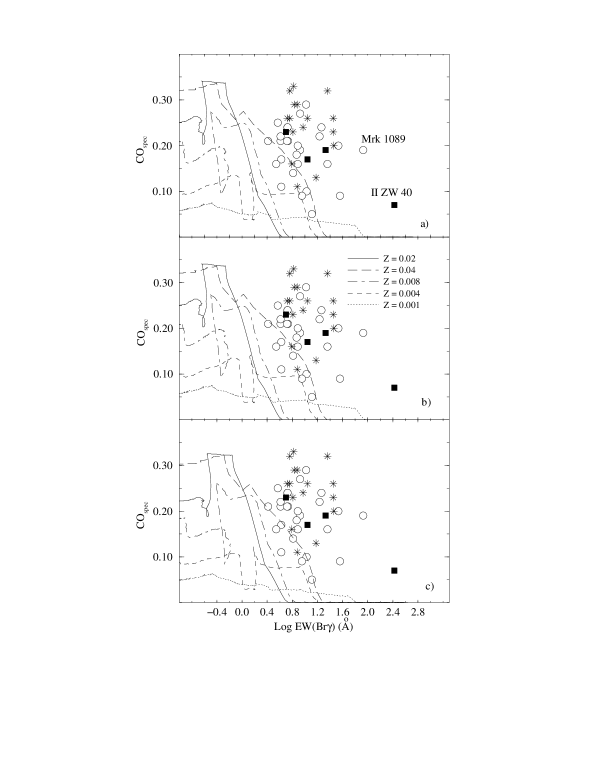
Comparisons of our data for EW(Br) and COspec with the instantaneous burst models are presented in Figure 4. From this figure, we conclude that none of the instantaneous burst models can fit the ensemble of our data. For solar metallicity (Z ) the models generally underestimate the value of EW(Br). Some galaxies can be fitted by instantaneous bursts, but the predicted metallicity is 2 times solar, which is much higher than the gas metallicity we have estimated in these galaxies. Our results confirm those of Goldader et al. (1997b), extending their conclusion to starburst galaxies with different physical properties and FIR luminosity. It implies that the instantaneous burst scenario is not a good representation of the starburst phenomenon.
Our data are compared with the CSFR models in Figure 5. One can see in Figure 5a that the Salpeter’s IMF model with M M⊙ cannot fit the ensemble of our data. But a relatively good fit is obtained in Figure 5b, when the upper mass cutoff is equal to M M⊙ . We see no improvement in Figure 5c in adopting an IMF slope .
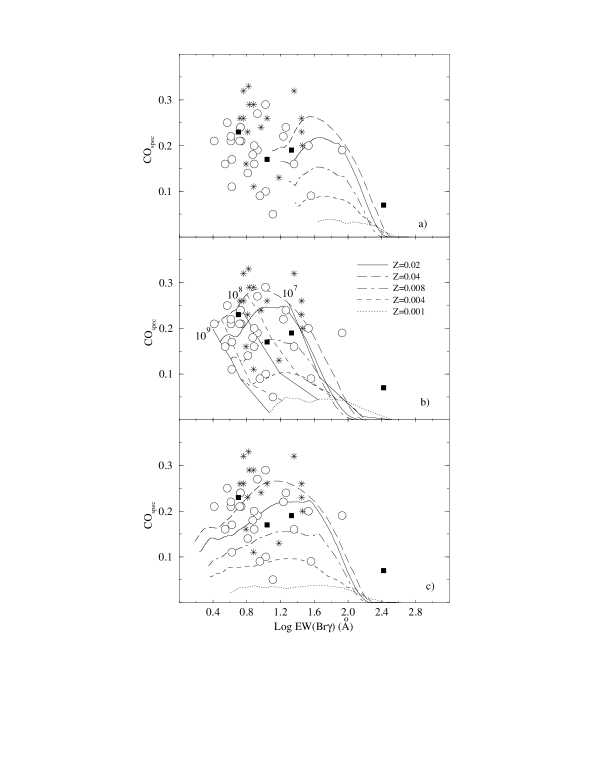
Once again our results confirm those of Goldader et al. (1997b), extending their conclusion to all the starburst types known. We conclude that the best parameters which describe starburst galaxies in the nearby Universe are a CSFR and a Salpeter’s IMF with an upper mass cutoff M M⊙.
According to this solution, the bursts have ages between 10 Myr and 1 Gyr, the majority being older than 100 Myr. Comparing with LIRGs, we found, on average, younger bursts for these galaxies, with ages lower than 100 Myr. This is consistent with the difference in luminosity ratios noted in Section 2.5. The model reproduce correctly also the fact that LIRG are more metal rich than the SBNGs. The consistency with the metallicities deduced from their optical spectra (Section 2.2) is remarkably good.
According to the model, HII galaxies must have younger bursts than the SBNGs. The metallicities predicted by the models are also in good agreement with those measured. Young bursts and low metallicities are also consistent with the higher dust temperatures suggested by the FIR model in Section 2.3.
In our sample, the galaxy which have the youngest burst is II Zw 40. The position of this galaxy in Figure 5a suggests that it may be possible to fit an IMF with upper mass cutoff M M⊙ (although the predicted metallicity would then be wrong). The same conclusion may also apply to Mrk 1089. These observations may suggest varying IMF in some galaxies (Doyon, Puxley & Joseph 1992).
From the above discussion, we conclude that the solution of the synthetic starburst model is consistent with observations in the optical and FIR. In particular, it satisfactorily explains the differences between the different starburst types: HII galaxies have younger bursts and lower metallicities than SBNGs, while LIRGs have younger bursts but higher metallicities. These differences may be related to different histories of star formation or different stages in burst evolution.
Taken at face value, the above result confirms the studies of Doyon, Puxley & Joseph (1992), Goldader et al. (1997b) and Coziol (1996). The generality of our observation further suggests that this must be a characteristic of starburst galaxies in the nearby Universe. However, the above solution may not represent strong constraints on the duration of the burst or the IMF. This is because the synthetic starburst models we used cannot distinguished between real constant star formation and a series of instantaneous bursts (Leitherer et. all 1999). In order to verify this alternative, we will now reexamine our spectra and search for traces of previous bursts.
4.2 Spatial variation of NIR features: evidences for sequences of bursts

In order to reproduce CSFR using a sequence of bursts, one must assume that this sequence spreads over a relatively long period of time. The solution of synthetic starburst model suggests a period extending over up to 1 Gyr. If this sequence of burst is related to some self–regulated mechanism or to propagation of star formation, we may also assume that the different bursts do not happen in the same regions of space. This implies that the bursts regions should be heterogeneous in space and in time. With sufficient spatial resolution, we should then observe a variation in burst characteristics as we survey different regions. As a first test, therefore, we can check if a variation of aperture in our spectra induces some variation of the NIR spectral features.
Before doing the aperture test, it is important to verify that the obvious increase of scale with distance, implied by our two fixed apertures, do not introduce any systematic variations, which could be misinterpreted as variation of burst characteristics. Associating the smaller aperture ( arc–second) to the nucleus, we verify in Figure 6 that the ratios of the Br fluxes and equivalent widths, as measured in and out of the nucleus, do not show any relation with the redshift. Similar negative results were also obtained for H2, the K magnitudes, the COspec and for the slope of the continuum (). These negative results suggest that what ever variations we may observed for these ratios, their origin must be intrinsic to each galaxy.
Having verified that the two fixed apertures do not introduce spurious effects, we now proceed to examine how the different ratios varied in each galaxy. In Figure 7a, we first compare the ratios of the fluxes in Br with the ratios of the equivalent widths. In general, the ratios f(Br)/f(Br)N are higher than one, which indicate that the bursts of star formation generally extend over a few kpc around the nucleus. The equivalent widths, on the other hand, are generally wider in the nucleus, except in galaxies where the ratio f(Br)/f(Br), which correspond to extended bursts, where the equivalent width stays constant or increases out of the nucleus. According to synthetic starburst models, EW(Br) is an indicator of the age of the burst. From the above observation we then deduce that in the galaxies where the star formation is more concentrated, the bursts are younger in the nucleus. The contrary seems to be true in galaxies where the bursts are more extended. No difference is observed between HII galaxies and SBNGs.
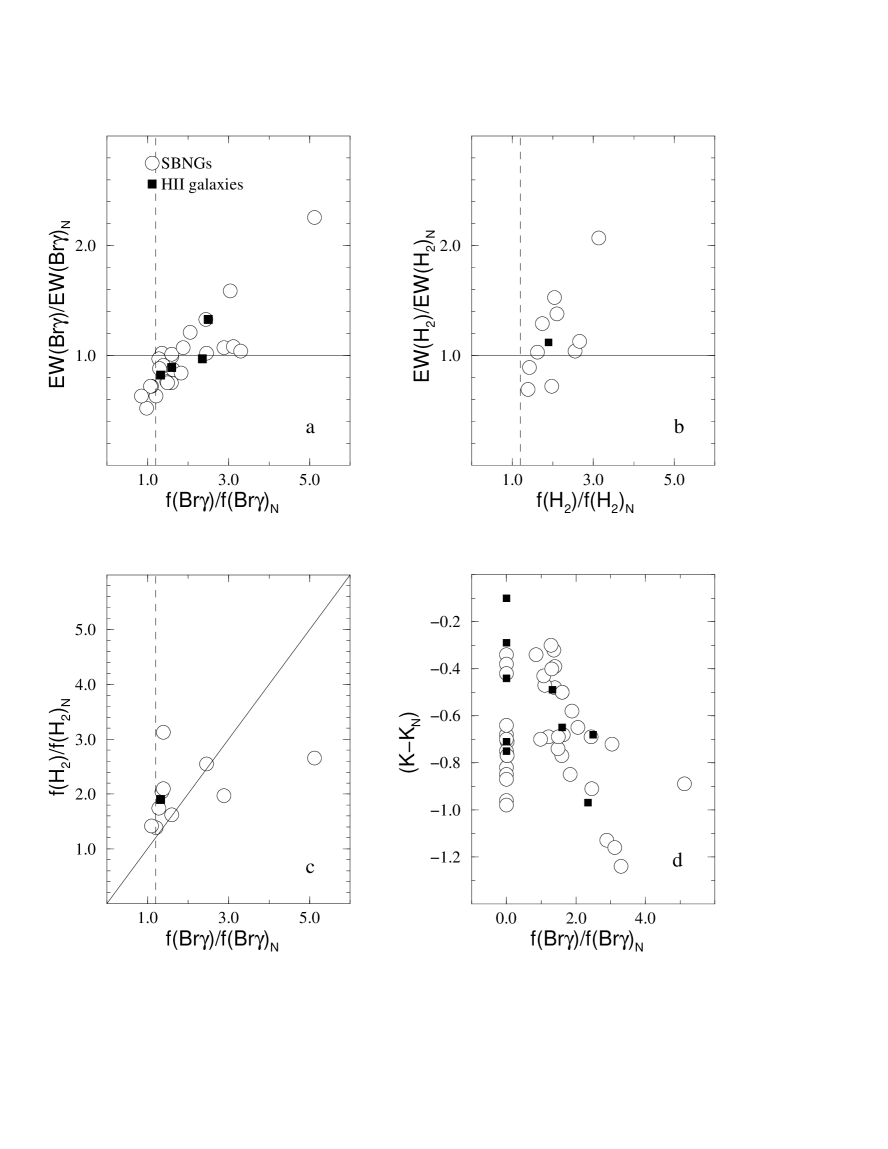
The case for H2, Figure 7b, is slightly different. Very few galaxies in our sample show significant H2 emission. In these galaxies we find the same tendency than for Br, which is the H2 emission generally spreads out of the nucleus. But the H2 equivalent width tends to be wider out of the nucleus. In Figure 7c one can see that in galaxies where the star formation is concentrated in the nucleus (f(Br)/f(Br)), the H2 emission is more intense than Br out of the nucleus. Only two galaxies, Mrk 1089 and 1194, show the reverse tendency. For the galaxies in our sample with significant amount of H2 emission, the H2 emission seems, therefore, to be always more intense and wide spread in regions where Br is less intense and less abundant. We verified also that 50% of the galaxies without H2 detection have detectable Br emission, which is consistent with the general tendency observed. The signification of this variation is not obvious, however, and its possible interpretation will therefore be kept for later during our analysis.
For the K–band magnitude, we naturally expect it to increase as the number of stars included in the aperture increases. However, the mean variation observed in Figure 7d seem smaller than what we expected. While the gain in surface represented by the difference in aperture is a factor 3, we find a meager K , which corresponds to an increase in flux by only a factor 1.8. The K–band emission, therefore, seems mostly concentrated in the nucleus. Indeed, one can see in Figure 7d that the difference in K–band magnitude is smaller in galaxies where the bursts are concentrated (f(Br)/f(Br)) than in galaxies where the bursts are extended. The K–band emission seems, therefore, to tightly follow the region of the bursts. This observation suggests that the stars emitting in the K band must be tightly related to the bursts.
No trend was observed for COspec or . These two parameters show random variations with standard deviations for the difference in COspec and for the ratios of .
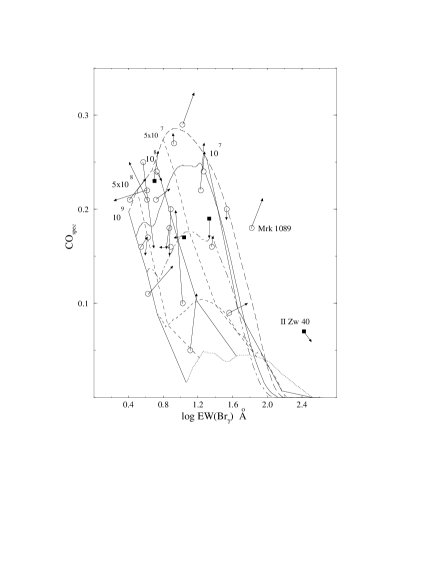
To illustrate what effects the variations of NIR features have on the burst characteristics of each galaxy, we show in Figure 8 the changes introduced by an increase in aperture in the burst model of Figure 5b. In this figure, an increase of the equivalent width transforms into a younger age while an increase of the COspec transforms into an increase of metallicity and a younger age. In Figure 8, one can see that some variations may imply significant differences in terms of the burst characteristics. No trend is observed, however, which suggests that the cause of these variations may depend on the particular history of star formation of each galaxy. Higher spatial resolution will be necessary to confirm this result.
From the above analysis we conclude that the variation of the NIR spectral features with aperture are consistent with a variation of burst characteristics in space. This result supports our hypothesis that the bursts regions are not homogeneous in space. However, the absence of systematic trends and the lack of spatial resolution impede us to conclude on the real cause of this variation and we must therefore search for other evidence in favour of the multiple burst hypothesis.
4.3 Luminosity–luminosity relations

Our previous analysis suggests that the stars emitting in the K–band are tightly related to the burst population. We should then expect to find a good correlation between the K–band absolute magnitude and parameters link to the burst. This is important to verify, because the stars producing the K–band luminosity are probably the same stars which produce the CO band. A correlation of K–band luminosity with parameters directly linked to the burst would thus favour massive and young stars, namely RSGs, over older stars like RGs.
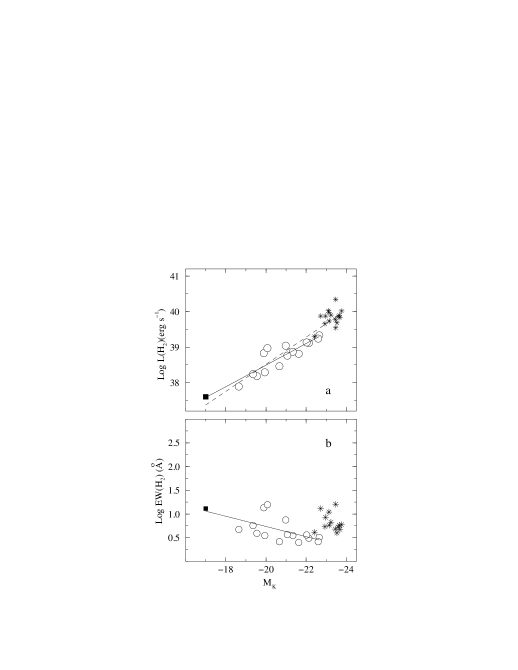
We see in Figure 9a that L(Br) increases with the K–band absolute magnitude. A linear regression performed on our data (continuous curve in Figure 9a) gives a weak but statistically significant coefficient of correlation R%. (with 33 points, the probability to obtain higher correlation by chance is P%; Pugh & Winslow 1966). The correlation improves to 82% when we include the LIRGs (dash curve in Figure 9a). The properties of our galaxies are in good continuity with those of the LIRGs, which form the upper limit of the distribution.
The correlation of L(Br) with the K–band absolute magnitude confirms that the stars producing this luminosity are related to the burst population. The relative weakness of this relation, however, may suggest that they are not correlated to the younger stars. But this result is consistent with what we expect if the stars emitting in the K–band are in majority RSGs: the number of RSGs increases with the intensity of the burst, but these stars also appear in great number only after the peak intensity of the bursts.
In Figure 9b, we find a reverse tendency for EW(Br), this parameter decreasing as MK increases. These two parameters are not strongly correlated (R%), although the correlation is still statistically significant (P%). The obvious interpretation for this reverse tendency is that galaxies which are richer in burst regions naturally also contain the highest number of evolved stars.
What is interesting in this last figure is the high dispersion of the data. This high dispersion suggests that the evolution of the bursts depends on the particular star formation history of each galaxy. This is consistent with our analysis of the variation with aperture and suggests that the bursts may also be heterogeneous in time (the dispersion in EW(Br) is a dispersion in time). The behaviour of the LIRGs is particularly remarkable, suggesting younger bursts than the observed tendency would have predicted. This could be one indication of repetitive bursts.
Note that we do not reject, a priori, the alternative which is that the stars emitting in the K–band are old RGs. In this case, the correlation of MK with L(Br) would suggest some relation between mass and the intensity of the bursts, while the correlation between MK and EW(Br) would mean that the bursts evolve more rapidly in galaxies where they are more intense. However, it would be difficult in this case to understand why the correlation are not stronger. But such interpretations, in fact, are much more constraining than what our data can revealed (we do not have information on the masses or the intensity of the bursts, which, anyway, should be normalized by the surface or volume). To our knowledge, such relations were never reported before, and our data are obviously insufficient to defend them. Our favoured interpretation, on the other hand, do not imply any new mechanisms, relying only on standard star evolutionary scenarios. Another argument in favour of our interpretation may be the relatively strong correlation we find between L(H2) and MK, as we now show.
A very strong correlation, R%, is found between L(H2) and MK in Figure 10a. The lower number of points in this fit do not influence the results: with 16 points, the probability to obtain a higher correlation by chance is P%. This good correlation do not depends on the inclusion of the LIRGs either, the coefficient increasing only to R% when we include them. For the equivalent widths, Figure 10b, we also find a better correlation than for Br, R%, P%. This behaviour suggests that the H2 emission is better correlated to a more evolved phase of the bursts, being correlated to SRGs, than to a younger phase. In general, therefore, the behavior of H2 emission seems consistent with the hypothesis of heterogeneous burst in space and time, showing variation with aperture (section 4.2) and the coexistence of evolved components with younger ones. It would help, however, to determine what is the process producing this line, since the two most probable mechanisms, supernovae shocks remnants and UV-fluorescence, imply much different time scales.
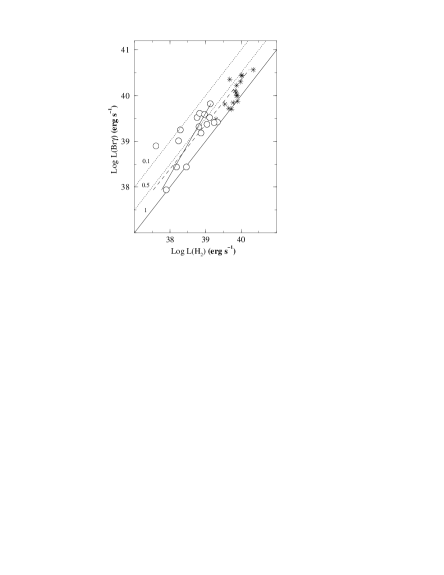
In principle, it would be possible to determine what is the mechanism producing the H2 emission by comparing the two luminosities L(Br) and L(H2). In Figure 11 we find that L(H2) is relatively well correlated to L(Br) (R% with P%). But the ratios L(Br)/L(H2) stay between 0.1 and 1, which is consistent with supernovae shocks remnants (Moorwood & Oliva 1990) or UV-fluorescence (Puxley, Hawarden & Mountain 1990). Therefore, although our observations suggest that the H2 emission phenomenon is related to a more evolved phase of the bursts, we are unable to say if this phase happen a few million years (the time scale of supernovae) or a few or yrs (the time scale of B stars, responsible for UV-fluorescence) after the maximum of the bursts.
4.4 Spectral types of ionising stars
In Coziol & Demers 1995 and in Coziol (1996), one evidence in favor of a sequence of bursts was the predominance of B type stars in starburst nucleus galaxies. We can repeat the analysis performed in Coziol (1996) to verify this result in the NIR. The advantage of working in the NIR is that the extinction in this part of the spectrum is less severe, and the fraction of obscured stars should therefore be less important (Calzetti et al. 1995), decreasing the uncertainties related to this method.
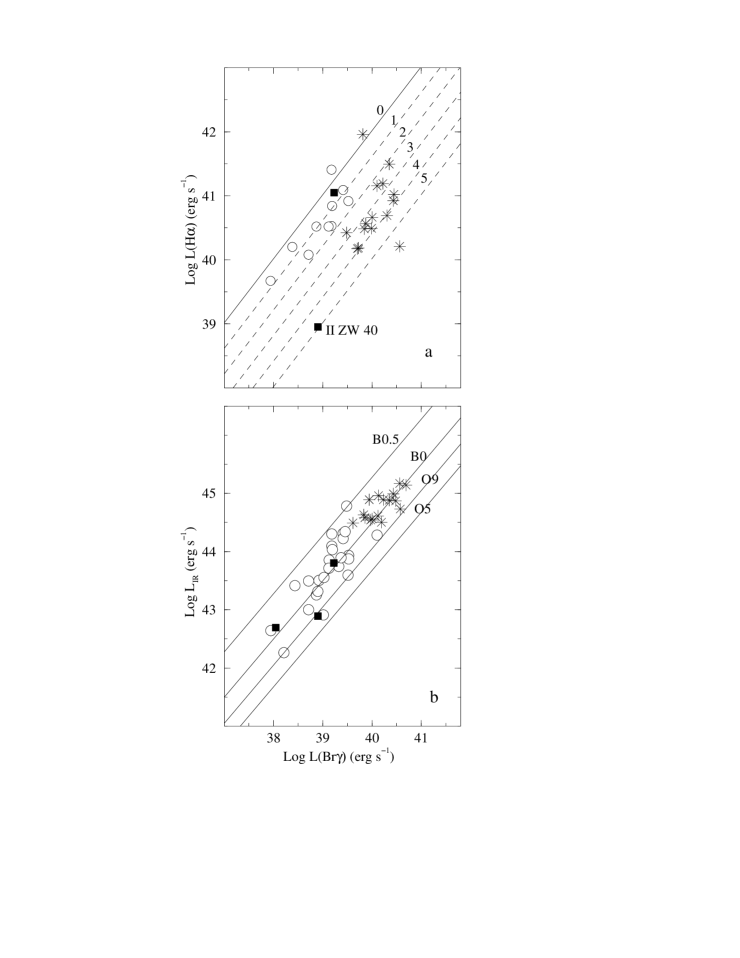
The level of extinction in our galaxies can be estimated (Figure 12a) by comparing L(Br) with the luminosity in H (L(H)). For the theoretical relation between L(Br) and L(H) we use the one adopted by Leitherer & Heckman (1995). The theoretical ratio is traced in Figure 12a as a continuous curve. Lower ratios then must correspond to various magnitudes in extinction in the optical. In our galaxies, the extinction varied between 0 and 2 magnitudes , which is in good agreement with values estimated from the Balmer decrement method (Contini, Considère & Davoust 1998). This should not be surprising considering the low dust extinction in these galaxies. The LIRGs seem to suffer slightly higher extinction, the values varying between 3 and 4 magnitudes.
Once corrected for extinction, the flux ratios Br/LIR are proportional to the ionising flux produced by stars with various spectral types (Devereux & Young 1990). We show in Figure 12b the locus expected for ionising star clusters with different spectral types. This figure confirms the dominance of B type stars as found in Coziol (1996).
5 Discussion
The question that we need to answer is: can we accept the result of the synthetic starburst model? In order to answer this question we need first to better understand this result. The main reason why the instantaneous burst solution is rejected by our observation is because the predictions of the models are in contradiction with the values of the CO spectral indices we measured. In an instantaneous burst, the Br equivalent width stays high for the first years. During this time, COspec is negligible and begins to increase only around year, when the most massive stars evolve as RSGs. It is because we observe both intense Br emission and relatively strong CO lines that we need continuous star formation. The answer seems, therefore, to rely on the validity of the CO spectral index.
To obtain a good fit with any of the instantaneous burst models, the CO spectral indices would need to decrease by more than 50%. Obviously, this cannot be due to the method we used to measure these lines. The strength of the CO bands in our spectra is undeniable. A relatively strong value of COspec is consistent with a predominance of RSGs over RGs (Doyon, Joseph & Wright 1994). This is consistent with the correlation found between MK and L(Br), which suggests that the stars producing this luminosity, and probably also the CO band, are related to the burst population. Moreover, this relation is relatively weak because RSGs appear in great number only slightly after the culmination of the burst. The relatively strong CO bands in our spectra seems therefore to be real, and a constant star formation rate is consequently necessary to explain our data.
But what about the low upper mass cutoff? If we look at Figure 5, we see that the reason why we need such feature is because the Br equivalent widths seem too weak as compared to the model with upper mass cutoff M M⊙. Now, this result is far from obvious. It is therefore highly significant that when we determine the spectral types of the ionising stars in these galaxies we find a value which is consistent with this result: the dominant ionising stars are early–type B or late–type O which have masses of the order of 10 to 20 M⊙ (Panagia 1973), in good agreement with the upper mass cutoff suggested by the model. We have therefore to conclude that the solution suggested by the synthetic starburst model is fully consistent with our data.
But how could star formation be continuous? In order to sustain star formation in starburst galaxies, some mechanism other than interaction is necessary. Observations of nearby starburst galaxies suggests that most (%) of these galaxies are relatively isolated and cannot be associated to on–going interaction events (Telles & Terlevich 1995; Coziol et al. 1997b). In our sample, only five galaxies have a peculiar morphology suggesting some sort of direct interaction. The best example is NGC 1089. The galaxy II Zw 40, on the other hand, which also has the youngest burst, cannot be easily connected to an interaction event. The same is true for most of the galaxies in our sample. More than two thirds (19) of our galaxies are isolated early–type spirals (earlier than Sbc) or galaxies with a compact appearance (14 galaxies). The rest (10 galaxies) looks like normal late–type spirals (Sbc or later). There is, consequently, no obvious dynamical cause for the bursts observed in most of these galaxies, which suggests that some ”internal“ regulating or self–sustained star formation mechanism must be active.
In order for star formation to be continuous over a significantly long period of time, star formation rates cannot be very high either. This may be in contradiction with some observations in very intense starburst galaxies. This is why a sequence of bursts may be a more interesting alternative. If the bursts are intense but do not last very long, the reservoir of gas will not be exhaust, allowing ignition of new bursts later on. Assuming some self-regulated mechanism, this process could probably extend over a relatively long period of time. One can already find in the literature different mechanisms capable of producing bursts in sequence, either by regulation or propagation of star formation from supernovae feedback (Gerola, Seiden & Schulman 1980; Krügel & Tutukov 1993) or multiple small merger events on a few Gyr period (Tinsley & Larson 1979). These two alternatives were already found to be consistent with the chemical properties of nearby starburst galaxies (see Coziol et al. 1997 and 1999 for example).
But what evidence do we have in favour of a sequence of bursts? In our spectra we have found some variation of burst characteristics with the aperture which suggests the bursts are not homogeneous in space. The fact that we do not observe systematic trends for these variations suggests that their origin may be related to the particular star formation history of each galaxy. This could be one signature of internal processes. Considering that these variations are observed over regions a few kpc wide, it is probably more realistic to assume also that different star formation events occurred during different time intervals (this would be the case for star formation propagation). The dispersion of the K–band absolute magnitude vs. EW(Br) relation is highly suggestive of some intermittent events, superimposed, perhaps, on a more global behaviour.
However, the strongest evidence in favour of a sequence of bursts may be the predominance of early–type B stars in the ionised regions of these galaxies. Such stars, with masses of the order of 10 to 20 M⊙, have lifetime of a few yrs only. For one burst population, it is therefore difficult to understand how this particular composition of stars is possible. This cannot be explained solely in terms of an age effect. Indeed, the main sequence lifetime of these stars is only a factor 10 older than those of more massive stars and a factor 10 younger than the age of the bursts deduced from the synthetic starburst model, which would mean that we observe all these galaxies in a very particular and short phase of their evolution. Considering the generality of our observations, this makes it a very improbable event333It is doubtful that we can explain such rare events based on the obvious bias that these are starburst galaxies, considering that such galaxies form between 25 to 30% of all the galaxies in the nearby Universe..
A sequence of short bursts, on the other hand, without any limit on the upper mass cutoff and extending over a relatively long period of time (a few 108 or 1 Gyr) in order to mimic continuous star formation, may reproduce such phenomenon. Short bursts would produce few massive stars, which would then evolve rapidly and all disappear before another burst begin. Depending on the frequency of the bursts, the average population would then evolve statistically towards the predominance of early–type B stars. Note that it is probably impossible to reproduce such stellar population with constant star formation, unless the IMF upper mass cutoff is truncated towards low mass stars.
To finish, we have concluded that we cannot identify what is the mechanism responsible for the H2 emission in our galaxies. However, the different time scales over which these processes culminate should help us estimate which is the more probable one. Supernovae shocks remnants are predominant only when a high number of massive stars are produced and the bursts are very young (a few years). Infrared fluorescence, on the other hand, is produced by early B stars, which radiate ample photons in the Lyman–Werner band ( Å). These stars have longer life times and should therefore prevail only when the burst is old or, for some reason, they are predominant in a burst population. The fact that B stars do seem to be over abundant in our galaxies suggests that fluorescence must be the main mechanism responsible for the H2 emission. One would then expect to see an increase of fluorescent emission in regions where B stars dominate over O stars (Tanaka, Hasegawa & Gatley 1991). This would explain some of the variation we observed when we change the aperture, which would constitute, consequently, another evidence in favour of the multiple bursts scenario hypothesis.
6 Conclusion
Although the solution proposed by the application of the synthetic starburst models to our sample of starburst galaxies may look counter intuitive, we have shown that it seems to be fully consistent with our data. Our analysis confirms, therefore, the results previously obtained by Deutsch & Willner 1986, Doyon, Puxley & Joseph (1992), Coziol & Demers 1995, Coziol (1996) and Goldader et al. (1997b).
However, the solution proposed by the models may not represent strong constraints on the duration of the burst or the form of the IMF. This is because the models cannot distinguish between constant star formation or a sequence of short bursts over an extended period of time. This alternative, the sequence of short bursts, will have to be tested fully before we can conclude on the values of these two important parameters in starburst galaxies.
What ever is the solution, our observations are clear on one thing, which is that starburst must be a sustained or self–sustained phenomenon: either star formation is continuous in time or different bursts happen in sequence over a relatively long period of time. The generality of our observations suggests that this is a characteristic of starburst galaxies in the nearby Universe.
Acknowledgments
R. C. would like to thank the Observatoire de Besançon for supporting his work. The authors would also like to thank Leitherer et al. for making their synthetic starburst models available to the community and an anonymous referee for interesting comments and useful suggestions. This research has made use of the NASA/IPAC Extragalactic Database (NED) which is operated by the Jet Propulsion Laboratory, Caltech, under contract with the National Aeronautics and Space Administration.
References
- [1] Alonso–Herrero A., Engelbracht C. W., Rieke M. J., Rieke G. H., Quillen A. C. 2000 (astro-ph/0008317)
- [2] Anantharamaiah K.R., Viallefond F., Mohan N. R., Goss W. M., Zhao J.H. 2000, ApJ, 537, 613
- [3] Augarde R., Chalabaev A., Comte G., Kunth D., Maehara H., 1994, A&AS, 104, 259
- [4] Allen M. L., Kronberg P. P. 1998, ApJ, 502, 218
- [5] Baldwin J. A., Phillips M. M., Terlevich R., 1981, PASP, 93, 5
- [6] Balzano V. A., 1983, ApJ, 268, 602
- [7] Calzetti D., Bohlin R. C., Kinney A. L., Storchi-Bergman T., Heckman T. M. 1995, ApJ, 443, 136
- [8] Contini T., Considère S., Davoust E., 1998, A&AS, 130, 285
- [9] Coziol R., 1996, A&A, 309, 345
- [10] Coziol R., Demers S., Peña M., Torres-Peimbert S., Fontaine G., Wesemael F., Lamontagne R., 1993, AJ, 105, 35
- [11] Coziol R., Demers S., Peña M., Barnéoud R., 1994, AJ, 108, 405
- [12] Coziol R., Demers S., 1995, in Paturel G., Petit C., eds., The world of galaxies II, ApJ Letters & Communications 31, Overseas Publishers Association, p. 41
- [13] Coziol R., Demers S., Barnéoud R., Peña M., 1997, AJ, 113, 1548
- [14] Coziol R., Torres C. A. O., Quast G. R., Contini T., Davoust E., 1998, ApJS, 119, 239
- [15] Coziol R., Carlos-Reyes R. E., Consière S., Davoust E., Contini T., 1999, A&A, 345, 733
- [16] de Grijs R., O’Connell R. W., Gallagher III J. S. 2000 (astro-ph/0010046)
- [17] Deutsch L. K., Willner S. P., 1986, ApJ, 306, L11
- [18] Devereux N. A., Young J. S., 1990, ApJ, 350, L25
- [19] Doyon R., Puxley P. J., Joseph R. D., 1992, ApJ, 397, 117
- [20] Doyon R., Joseph R. D., Wright G. S., 1994, ApJ, 421, 101
- [21] Doyon R., Nadeau D., Joseph R. D., Goldader J. D., Sanders D. B., Rowlands N., 1995, ApJ, 450, 111
- [22] Elmegreen B., 1999, in Livio M., ed., Unsolved Problems in Stellar Evolution Cambridge University Press, in press (astro-ph/9811289)
- [23] Gerola H., Seiden P. E., Schulman L. S., 1980, ApJ, 242, 517
- [24] Goldader J. D., Joseph R. D., Doyon R., Sanders D. B., 1995, ApJ, 444, 97
- [25] Goldader J. D., Joseph R. D., Doyon R., Sanders D. B., 1997a, ApJ, 474, 104
- [26] Goldader J. D., Joseph R. D., Doyon R., Sanders D. B., 1997b, ApJS, 108, 449
- [27] Goudfrooij P., Mack J., Kissler-Patig M., Meylan G., Minniti D. 2000 (astro-ph/0010275)
- [28] Hunter D. A., O’Connell, R. W., Gallagher, J. S., Smecker-Hane, T. A. 2000 (astro-ph/0009280)
- [29] Kaaret P., Prestwich A. H., Zezas A., Murray S. S., Kim D.-W., Kilgard R. E., Schlegel E. M., Ward, M. J., 2000, MNRAS in press (astro-ph/0009211)
- [30] Kennicutt R. C. Jr., 1983, ApJ, 272, 54
- [31] Kim D.-C., Sanders D. B., Veilleux S., Mazzarella J. M., Soifer B. T., 1995, ApJS, 98, 129
- [32] Krügel E., Tutukov A. V., 1993, A&A, 275, 416
- [33] Leitherer C., Heckman T. M., 1995, ApJS, 96, 9
- [34] Leitherer C. et al., 1999, ApJS, 123, 3
- [35] Liu C. T., Kennicutt R. C., 1995 ApJS, 100 325
- [36] Londsdale C. J., Helou G., Good J. C., Rice W., 1985, Catalogued Galaxies and Quasars Observed in the IRAS Survey, JPL D-1932, Pasadena
- [37] Izotov Y. I., Thuan T. X., Lipovetsky V. A., 1998, ApJ, 497, 227
- [38] Masegosa J., Moles M., Campos-Aguilar A., 1994, ApJ, 420, 576
- [39] Mas–Hesse J. M., Kunth D., 1999, A&A, 349, 765
- [40] Mayya Y. D., 1997, ApJ, 482, L149
- [41] Mazzarella J. M., Boroson T. A., 1993, ApJS, 85, 27
- [42] Meurer G. R., 2000, in Lançon A., Boily C. M., eds., Massive stellar Clusters, ASP conf. Ser. p.81
- [43] Mountain C. M., Robertson D. J., Lee T. J., Wade R., 1990, in Instrumentation in astronomy VII, Bellingham, WA, Society of Photo-Optical Instrumentation Engineers, p.14
- [44] Panagia N., 1973, ApJ, 78, 929
- [45] Pugh E. M., Winslow G. H. 1966, in The Analysis of Physical Measurements, (Addison-Wesley), section 12-8
- [46] Puxley P. J., Hawarden T. G., Mountain C. M., 1990, ApJ, 364, 77
- [47] Puxley P. J., Doyon R., Ward M. J., 1997, ApJ, 476, 120
- [48] Raimann, D., Bica, E., Storchi-Bergmann, T., Melnick, J., Schmitt, H. 2000, MNRAS, 314, 295
- [49] Rieke G. H., Lebofsky M. J., 1986, ApJ, 304, 326
- [50] Rieke G. H., Loken K., Rieke M. J.; Tamblyn P., 1993, ApJ, 12, 99
- [51] Salzer J. J., MacAlpine G. M., Boroson T. A., 1989, ApJS, 70, 447
- [52] Saunders W., Rowan–Robison M., Lawrence A., Efstathiou, G., Kaiser N., Ellis R. S., Frenk C. S., 1990, MNRAS, 242, 318
- [53] Schaerer D., Guseva N. G., Izotov Y. I., Thuan T. X. 2000 (astro-ph/0008519)
- [54] Schinnerer E., Eckart A., Boller Th. 2000 (astro-ph/0007461)
- [55] Seaquist E. R., Frayer D. T., Frail D. A., 1997, ApJ, 487, 131
- [56] Sekiguchi K., 1987, ApJ, 316, 145
- [57] Tanaka M., Hasegawa T., Gatley I., 1991, ApJ, 374, 516
- [58] Telles E., Terlevich R. J., 1995, MNRAS, 275, 1
- [59] Terlevich R., Melnick J., Masegosa J., Moles M., Copetti M. V. F., 1991, A&A, 91, 285
- [60] Tinsley B. M., Larson R. B., 1979, MNRAS, 186, 503
- [61] Vader J. P., Simon M., 1987, AJ, 94, 854
- [62] Vacca W. D., Conti P. S., 1992, ApJ, 410, 543
- [63] Veilleux S., Osterbrock D. E., 1987, ApJS, 63, 295
- [64] Veilleux S., Goodrich R. W., Hill G. J., 1997, ApJ, 477, 631
- [65] Veilleux S., Kim D.-C., Sanders D. B. 1999, ApJ, 522, 113